Bitcoin - Last drop, then a huge pump! (watch this wedge)Bitcoin is currently trading at around 78,000 at the time of writing this article, and I expect the price to go down to 71k - 72k in the short term. Why? As we can see on the chart, there are many reasons why Bitcoin should go down. The first reason is that whales (banks, institutions) still didn't sweep liquidity below the April 2025 swing low. This is a huge point of interest because a lot of retail traders have their stop losses exactly below this swing low. The second reason is that the price should touch the falling wedge's downward-sloping trendline.
I think this is a pretty good opportunity to buy/long Bitcoin at these levels because also the RSI indicator is starting to be oversold. I think we should definitely see a temporary rise to 83k - 84k before eventually going lower. It depends on the falling wedge pattern - will bulls be strong enough to break out of this pattern? We will see, but right now, we want to buy this strong support of 72k!
This is my plan for the next weeks. Right now I expect a drop, but soon we should see a pretty strong rebound. If you watch my previous ideas and you are my follower, you probably know that Bitcoin will go down even lower this year, probably below 60k! So, I am not recommending buying any altcoins whatsoever. We may see some interesting gains in the short term, but in the mid-term altcoins are still bearish. A good opportunity to buy altcoins would be in October 2026, but we still need more data to confirm this bias.
Write a comment with your altcoin + hit the like button, and I will make an analysis for you in response. Trading is not hard if you have a good coach! I am very transparent with my trades. Thank you, and I wish you successful trades!
Community ideas

Gold 30-Min — Volume Buy & Sell Reversal Triggered⚡Base : Hanzo Trading Alpha Algorithm
The algorithm calculates volatility displacement vs liquidity recovery, identifying where probability meets imbalance.
It trades only where precision, volume, and manipulation intersect —only logic.
✈️ Technical Reasons
/ Direction — LONG / Reversal 4938 Area
/ Direction — LONG / Reversal 4760 Area
☄️Bullish momentum confirmed through strong candle body.
☄️Structure shifted with higher-low near key demand base.
☄️Volume expanding confirms order-flow alignment upward.
☄️Buyers reclaimed imbalance with sustained clean break.
☄️Algorithm detects rising momentum under low liquidity.
✈️ Technical Reasons
/ Direction — SHORT / Reversal 5423 Area
☄️Bearish rejection confirmed through sharp candle body.
☄️Lower-high forming beneath resistance supply region.
☄️Volume decreasing confirms exhaustion in price rally.
☄️Sellers regained imbalance with heavy top rejection.
☄️Algorithm detects fading demand and shift to control.
⚙️ Hanzo Alpha Trading Protocol
The Alpha Candle defines the day’s real control zone — the first battle of momentum.
From this origin, the Volume Window reveals where the next precision strike begins.
⚙️ Hanzo Volume Window / Map
Window tracked from 10:30 — mapping true market behavior.
POC alignment exposes institutional bias and breakout potential zones.
⚙️ Hanzo Delta Window / Pulse
Delta window monitors real buying vs. selling power behind each move.
Tracks volume aggression to expose who controls the candle — buyers or sellers.
When Delta aligns with Volume Map, momentum becomes undeniable.

GOLD Price Update – Clean & Clear ExplanationGold is showing early signs of recovery after a strong bearish move, but the price is still trading below a major descending trendline, which remains a key resistance.
The broader structure is still bearish, as price continues to respect the downward sloping trendline from previous highs. However, recent price action shows higher lows, suggesting short-term bullish momentum is building.
A clean breakout and close above the descending trendline could trigger a strong upside move toward 5,050 / 5,200 Rejection from the trendline may lead to a pullback toward 4,845 and possibly 4,730 Gold is at a critical breakout zone. Momentum is improving, but confirmation is needed. Traders should watch for price reaction at the trendline before committing to direction.
“If you come across this post, please like, comment, and share. Thanks!”

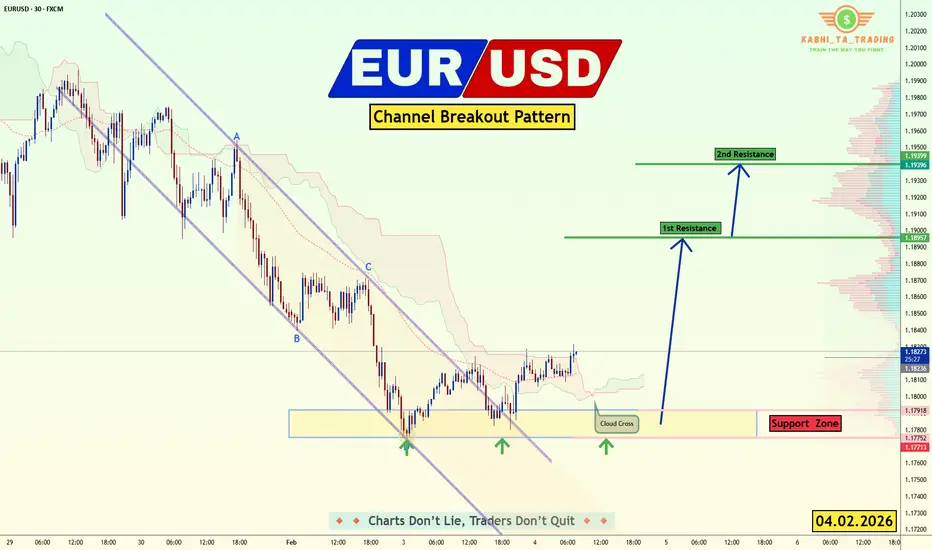
EUR/USD - Upside Expansion Next? (04.02.2026)📝 Description🔍 Setup FX:EURUSD
EUR/USD has been trading inside a descending channel and recently showed signs of structure shift after breaking and retesting the channel boundary.
Price reacted multiple times from the demand/support zone, forming higher lows.
Ichimoku shows a cloud cross and improving momentum, hinting at potential upside continuation.
This suggests sellers are weakening while buyers gradually gain control.
📍 Support & Resistance
🟥 Support Zone: 1.1790 – 1.1770
🟩 1st Resistance: 1.1895
🟩 2nd Resistance: 1.1940
⚠️ Disclaimer
This idea is for educational purposes only.
Forex trading involves risk. Always manage your risk and follow your own plan.
💬 Support the Idea 👍 Like if you see bullish continuation
💬 🔁 Share with fellow EUR/USD traders
#EURUSD #Forex #PriceAction #ChannelBreakout #BullishSetup #TradingView #SupportResistance #IntradayTrading #Kabhi_TATrading
XAUUSDHello Traders! 👋
What are your thoughts on GOLD?
Gold printed a new all-time high before facing a sharp bearish rejection from the highlighted resistance zone. Following this strong sell-off, price dropped aggressively toward the 4400 support area, where buyers stepped in and prevented further downside.
After reacting positively to this key support, Gold rebounded and is now trading around the 4900 level. Based on the current price structure and Fibonacci retracement levels, we expect this recovery to extend toward the upper resistance zone near the 0.618 Fibonacci level.
However, this resistance area is considered a high-probability rejection zone, and from there, a bearish reaction could occur, potentially pushing price back toward the trendline support and lower Fibonacci targets.
Don’t forget to like and share your thoughts in the comments! ❤️

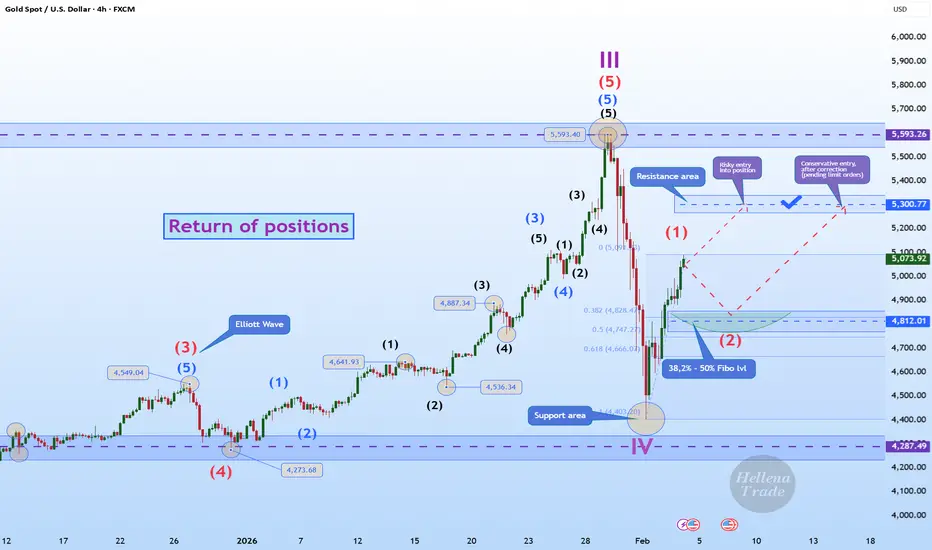
Hellena | GOLD (4H): LONG to 5300 area (Wave 3).Colleagues, the price has shown a positive upward trend, and I believe that wave “1” is either complete and wave ‘2’ correction will begin, or wave “1” will be extended.
In any case, I expect the price to reach 5300 as the nearest target. This movement after the correction will confirm the structure.
A correction in wave “2” should be expected in the range of 38.2% - 50% Fibonacci levels at 4800.
Manage your capital correctly and competently! Only enter trades based on reliable patterns!
NAS100 - Weekly CSL - Model 2 - Double top LiqudityHi friends, new Weekly range createdanm we are about to play model 2 probability. As always we are looking for the manipulation in to the key level around the range. Don't forget confirmation switch from manipulation phase to the distribution phase to make the setup valid. Stay patient and enter only after change in order flow. If price reaches 50% of the range take partial or full close.
👊 Trade Visual
I promised myself I’d become the person I once needed the most as a beginner. Below are links to a powerful lessons I shared on Tradingview. Hope it can help you avoid years of trial and error I went thru.
📊 Sharpen your trading Strategy
⚙️ 100% Mechanical System - Complete Strategy
🔁 Daily Bias – Continuation
🔄 Daily Bias – Reversal
🧱 Key Level – Order Block
📉 How to Buy Lows and Sell Highs
🎯 Dealing Range – Enter on pullbacks
💧 Liquidity – Basics to understand
🕒 Timeframe Alignments
🚫 Market Narratives – Avoid traps
🐢 Turtle Soup Master – High reward method
🧘 How to stop overcomplicating trading
🕰️ Day Trading Cheat Code – Sessions
🇬🇧 London Session Trading
🔍 SMT Divergence – Secret Smart Money signal
📐 Standard Deviations – Predict future targets
🎣 Stop Hunt Trading
💧 Liquidity Sweep Mastery
🔪 Asia Session Setups
📀 Gold Strategy
🧠 Level Up & Mindset
🛕 Monk Mode – Transition from 9–5 to full-time trading
⚠️ Trading Enemies – Habits that destroy success
🔄 Trader’s Routine – Build discipline daily
💪 Get Funded - $20 000 Monthly Plan
🧪 Winning Trading Plan
⭕ Backtesting vs Reality
🛡️ Risk Management
🏦 Risk Management for Prop Trading
📏 Risk in % or Fixed Position Size
🔐 Risk Per Trade – Keep consistency
🧪 Risk Reward vs Win Ratio
💎 Catch High Risk Reward Setups
☯️ Smart Money - Who control Markets
Adapt useful, Reject useless and add what is specifically yours.
David Perk

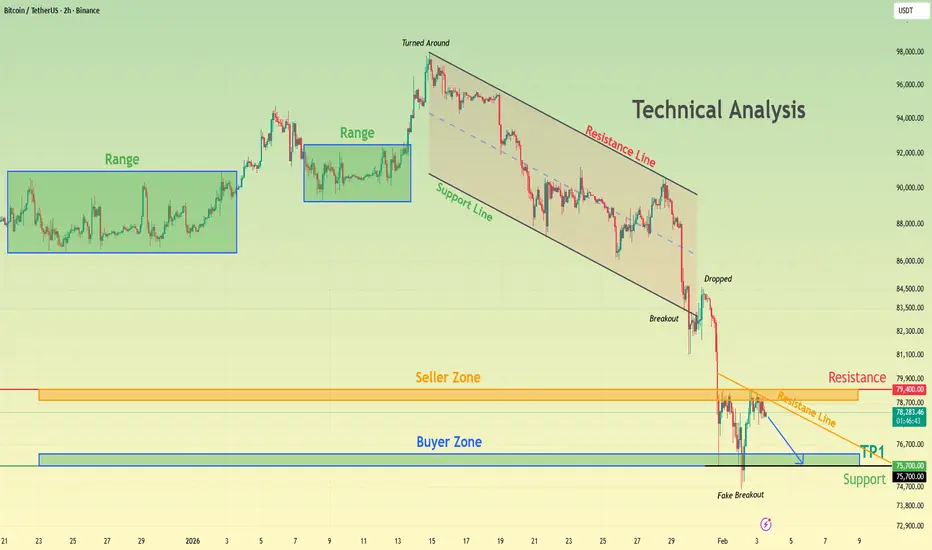
BTCUSDT Bearish Structure Holds - Short From ResistanceHello traders! Here’s my technical outlook on BTCUSDT (2H) based on the current chart structure. Bitcoin initially traded within a clearly defined range, where price moved sideways for an extended period, indicating market equilibrium and accumulation before the next directional move. This ranging phase eventually resolved to the upside, leading to a strong impulsive rally and a short-term bullish continuation. However, after reaching the local top, price turned around and transitioned into a well-structured descending channel, confirming a shift in short-term market control from buyers to sellers. Following the breakdown, Bitcoin dropped sharply into the Seller Zone, where price briefly reacted before continuing lower. The sell-off eventually extended into the major Buyer Zone around 75,700, which aligns with a key horizontal support area and prior demand. Price briefly pierced this level, forming a fake breakout, but quickly recovered back above support — a strong indication that sellers failed to gain acceptance below demand. Currently, BTC is stabilizing above the Buyer Zone and attempting a short-term recovery. This price behavior suggests a corrective rebound rather than a confirmed trend reversal at this stage. Structurally, as long as price holds above the Buyer Zone, a recovery move toward the 78,700–79,400 Resistance / Seller Zone (TP1) remains possible. This area also aligns with a descending resistance line, making it a key level to watch for potential rejection. Rejection from the Resistance / Seller Zone favors continuation to the downside. A move back toward the 75,700 support is the first target, followed by potential extension toward lower demand levels if selling pressure accelerates. Acceptance below the Buyer Zone would confirm bearish continuation and open the door for deeper downside. The bearish scenario remains valid as long as price stays below resistance and fails to reclaim the broken structure. Only a strong breakout and acceptance above the Seller Zone would invalidate the short setup. Until then, BTC remains in a corrective bounce within a broader bearish structure. Please share this idea with your friends and click Boost 🚀
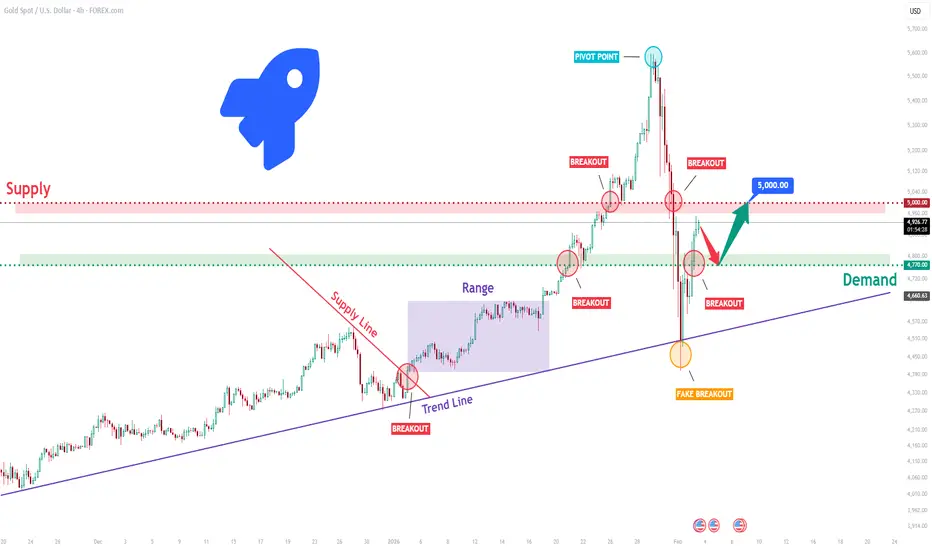
XAUUSD Long: After Fake Breakdown - $5,000 Back in SightHello traders! Here’s a clear technical breakdown of XAUUSD (4H) based on the current chart structure. Gold has been trading within a well-defined bullish environment for an extended period, supported by a rising trend line that guided price action higher. During this phase, price consistently printed higher highs and higher lows, confirming strong buyer control. After breaking above a descending supply line, XAUUSD entered a consolidation phase, forming a clear range before eventually expanding to the upside. This expansion resulted in multiple bullish breakouts, culminating in a strong impulsive rally toward the 5,000 psychological level, where price reached a major pivot point and bullish momentum began to exhaust.
Currently, XAUUSD is consolidating above the Demand Zone around 4,770, indicating stabilization after the sharp correction. This area aligns with previous breakout structure and acts as a critical decision zone. As long as price holds above this demand, the broader bullish structure remains valid despite the recent volatility. The current rebound appears corrective, suggesting the market may be building strength for the next directional move rather than entering a sustained bearish trend.
My primary scenario favors a bullish continuation as long as XAUUSD remains above the 4,770 Demand Zone and continues to show acceptance above the reclaimed structure. A successful hold in this area could allow price to gradually rotate higher, targeting a retest of the 5,000 Supply Zone as the next upside objective. This level remains a major barrier, and a clean breakout with strong acceptance above 5,000 would open the door for further bullish expansion. Alternatively, a decisive breakdown and acceptance below the 4,770 Demand Zone would invalidate the bullish continuation scenario and signal a deeper corrective move toward the rising higher-timeframe trend line. For now, structure slightly favors buyers, with the demand zone acting as the key battlefield. Manage your risk!
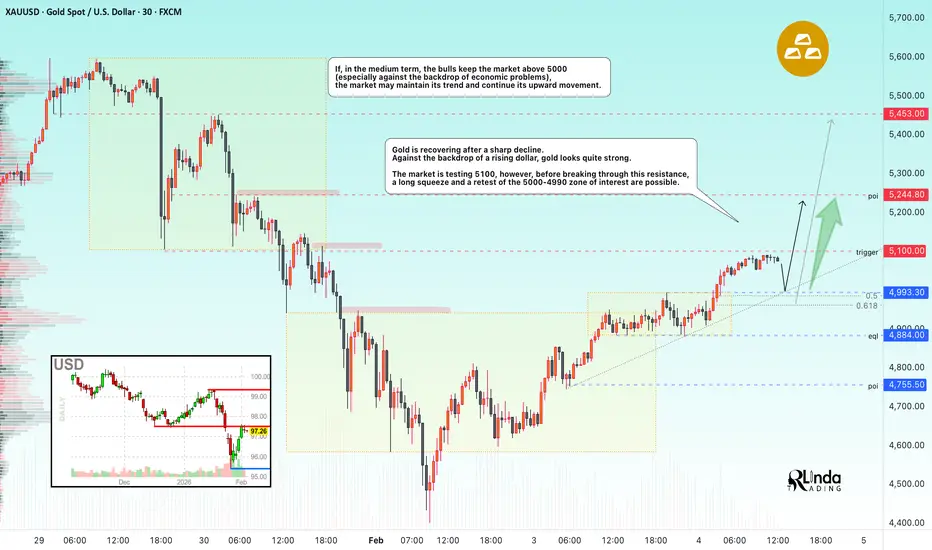
GOLD - Recovery. Pullback before growth to 5250...FX:XAUUSD continues its steady recovery. Against the backdrop of a rising dollar, the price of the metal looks quite strong... The rebound is due to the return of demand for safe-haven assets.
Geopolitics: US-Iran and new stages of escalation in the Russia-Ukraine conflict after a brief respite.
Uncertainty surrounding Fed policy under likely chair Kevin Warsh: on the one hand, expectations of lower rates, on the other, his reputation as a “hawk” and plans to reduce the Fed's balance sheet.
End of the shutdown and dollar weakness: The signing of the funding bill ended the partial US government shutdown, but delays in data releases (employment report) remain, which is holding back the dollar and supporting gold.
Today, the market is awaiting the ADP private sector employment report and the ISM Services PMI. The data will determine short-term market sentiment.
Resistance levels: 5100, 5150, 5250
Support levels: 5050, 5000
Technically, the local trend coincides with the global one, which generally indicates a bullish market sentiment. The formation of local movement and intraday bars indicates the presence of bulls.
Before breaking through 5100 and continuing to grow, the market may test the support zones: 5050 / 5000. A long squeeze and holding the price above key zones may resume growth.
Best regards, R. Linda!
Trusting Your System After a Losing StreakTrusting Your System After a Losing Streak
Welcome everybody to another educational article.
Today we are covering one of the hardest moments every trader, beginner, novice or pro will face:
“Trusting your system after a losing streak.”
This is where most traders ditch profitable systems not because the system failed, but because emotion took control and said “I am Losing with this”
Trusting your system after a losing streak is not about blind belief.
It is about understanding probability, psychology, and discipline.
What Is a Trading System?
A trading system is a set of clearly defined rules that control:
• Entries
• Exits
• Risk management
• Trade management
A system removes emotion and replaces it with structure.
An EDGE that works best for you.
What Is a Losing Streak?
A losing streak is a series of losing trades that occur within normal probability.
Losing streaks are not failure, they are a statistical reality in trading. (They are needed)
Profitable system experience drawdown.
Gaining Trust in a System:
Trust is not given it is built.
You build trust in a system by:
• Clearly defining system rules
• Back testing across different market conditions
• Forward testing in demo or small size
• Tracking performance over a large sample size
Testing proves that losses are part of the system not a sign is not broken.
When you have seen the data, losses stop feeling personal.
Losing Trust in a System
Traders lose trust in their system when emotion overrides logic.
This often happens when:
• A losing streak appears unexpectedly
• Results don’t match recent performance
• Social media shows others “winning”
• Patience runs out
Instead of reviewing data, traders:
• Change strategies weekly
• Mix systems together
• Add random indicators
• Chase the next “better” setup
This strategy-hopping resets progress and prevents mastery.
Maintaining Trust After a Losing Streak
Maintaining trust is purely mental.
You must control the urge to react emotionally.
Even when trades lose, you still benefit.
Every loss provides:
• More data
• More clarity
• More understanding of system strengths and weaknesses
Losing streaks often occur because:
• Market conditions change
• Volatility shifts
• Structure transitions
These periods allow you to adapt, refine, and improve your strategy.
Trading Is Not Judged Only by Money
We live in a world where success is measured by money.
Trading is different.
A trade is not defined by profit or loss, it is defined by execution.
As mentioned in previous posts:
Positive Wins vs Negative Wins
A positive win:
• Making money while following the plan
• Hitting a target and stopping for the day
A negative win:
• Hitting stop loss
• Accepting it
• Closing the platform
• Being done for the day
It may feel frustrating —
but discipline is strengthened.
That frustration is growth.
Losses Are Data, Not Failure
By following your rules even when you lose, you strengthen your system.
You did not receive a money return you received a data return.
That data:
• Refines your edge
• Improves your entries
• Strengthens your confidence
• Leads to long-term profitability
Every losing trade is an investment in future performance.
Losing streaks do not mean your system is broken.
They mean the system is being tested.
Trust is built through:
• Data
• Discipline
• Consistency
• Emotional control
Traders who survive losing streaks grow.
Traders who react emotionally reset themselves.
Trust the process.
Respect the data.
Stay disciplined.
That’s how profitable traders are made.
XAUUSD: High-Volume Correction After Bullish ImpulseMarket Read
From the recent swing low, Gold has printed a clear bullish impulse. The move was strong, directional, and momentum-driven. The current pause is best interpreted as a high-volume correction , not a bearish reversal.
At this stage, there is no technical reason for downside as long as price holds the corrective base and structure remains intact.
Structure Breakdown
Strong bullish impulse from the lows (clean expansion).
Followed by a tight, high-volume consolidation (time correction, not price damage).
No bearish displacement or structural breakdown inside the correction.
Primary Thesis
This correction is likely a base for impulse repetition .
A continuation higher is expected only after a confirmed breakout .
No breakout = no trade.
Breakout Confirmation Criteria (Mandatory)
Liquidity Sweep: Short-term highs taken before expansion.
Displacement: Strong candle bodies breaking the range, not wicks.
Imbalance (FVG): Clear inefficiency created on the breakout leg.
Acceptance: Price must hold above the breakout level.
Invalidation Rule: After the liquidity-grab wick, price must NOT accept beyond the wick extreme. Acceptance beyond it = bias shift.
Bullish Continuation Scenario
Condition: Clean breakout and acceptance above the current consolidation high.
Expectation: Repetition of the prior bullish impulse.
Targets: First reaction into nearby supply, then reassessment.
Failure Scenario
Condition: Acceptance below the corrective base.
Implication: The move up is confirmed as a completed correction.
Bias: Stand aside until a new structure forms.
Execution Notes
No anticipation. Only confirmation.
Mid-range entries offer low edge.
This is a continuation setup, not a bottom-picking trade.

Bitcoin - Sweep, Reclaim, Then Continuation Lower?Higher Timeframe Context
Price continues to respect a broader bearish structure, with lower highs forming after the previous distribution phase. The recent downside expansion did not occur randomly, it aligned with higher timeframe weakness and persistent sell-side pressure. Even though support has reacted before, the overall order flow still favors sellers until proven otherwise. This keeps any upside move categorized as corrective rather than a true shift in trend.
Liquidity Event and Support Reclaim
The key technical development here is the sweep of a weekly low followed by a close back above it and inside a strong weekly support zone. This type of behavior often signals engineered liquidity rather than genuine acceptance below the level. When price quickly reclaims support after taking stops, it typically creates the fuel for a relief move, as trapped shorts begin to cover and responsive buyers step in.
Short-Term Repricing Potential
With liquidity now collected from below, price has room to rotate higher in the near term. The path above contains inefficiencies that remain unfilled, particularly the daily imbalance that sits overhead. Markets tend to revisit these gaps as part of delivery, especially after a sweep and reclaim sequence. In addition, a cluster of lower timeframe consolidation rests in that same region, making it an attractive draw for price before any larger directional decision.
Confluence With Lower Timeframe Targets
The projected push higher is not expected to mark a bullish reversal, but rather a controlled retracement into areas where liquidity is resting. A sweep of the intraday consolidation would effectively reset positioning and potentially provide higher timeframe sellers with improved entry locations. When corrective rallies move into imbalance while the macro structure remains bearish, they often transition into continuation legs once the rebalancing is complete.
Why The Bearish Bias Remains Intact
Despite the strong reaction from support, nothing in the current structure suggests a confirmed shift in market direction. The broader pattern still points downward, and rallies should be viewed through the lens of distribution until market structure decisively changes. If price delivers into the overhead targets and begins to show rejection, it would reinforce the idea that the recent reclaim was simply a setup for continuation rather than accumulation.
Conclusion
The sweep and reclaim of weekly support opens the door for a temporary move higher, primarily driven by imbalance fills and liquidity resting within nearby consolidations. However, with the higher timeframe structure still leaning bearish, the expectation is for this relief rally to eventually exhaust itself and transition into another leg lower.
___________________________________
Thanks for your support!
If you found this idea helpful or learned something new, drop a like 👍 and leave a comment, I’d love to hear your thoughts! 🚀

Is the Rally Just for Selling? A Bearish Scenario for XAGUSDXAGUSD is currently showing that a short-term bearish trend is clearly dominating, as both news-driven factors and technical structure fail to support a sustainable bullish reversal. The broader macro backdrop continues to favor the U.S. dollar, with U.S. Treasury yields remaining elevated and expectations that the Fed will not ease policy anytime soon , keeping capital flows cautious toward precious metals such as silver.
On the H4 timeframe, after a sharp sell-off that decisively broke the prior bullish structure , the current price action appears to be nothing more than a technical rebound. XAGUSD remains below the Ichimoku cloud, signaling that short- to medium-term control is still firmly in the hands of sellers , and that the recovery lacks the strength required to shift overall market conditions.
The 98.0–98.5 zone is now acting as a key resistance area. This zone previously served as support and has since flipped into resistance, reinforcing its technical significance. Repeated rejection from this area would further validate the bearish continuation scenario.
If XAGUSD fails to break and hold above this resistance , the higher-probability outcome is a renewed move lower, with an initial target near 80, followed by a deeper decline toward the 75.6 support zone. In the current environment, the most rational strategy remains selling rallies in line with the trend , rather than attempting to catch bottoms against prevailing momentum.

Elise | XAUUSD – 30M – Corrective Bullish RecoveryOANDA:XAUUSD
After sweeping sell-side liquidity below 4,450, price showed strong rejection and transitioned into a corrective bullish move. Buyers are stepping in gradually, but upside remains reaction-dependent as price approaches previous distribution levels. Momentum favors a controlled recovery unless demand fails.
Key Scenarios
✅ Bullish Case 🚀 →
Sustained hold above 4,730 support keeps upside continuation valid.
🎯 Target 1: 5,050 – 5,080
🎯 Target 2: 5,400 – 5,450
❌ Bearish Case 📉 →
Failure below 4,730 invalidates the recovery structure.
🎯 Downside Target 1: 4,600
🎯 Downside Target 2: 4,450 – 4,400 (Major Demand Zone)
Current Levels to Watch
Resistance 🔴: 5,050 – 5,120 / 5,400 – 5,450
Support 🟢: 4,730 / 4,600 / 4,450
⚠️ Disclaimer: For educational purposes only. Not financial advice.

Gold 30-Min — Volume Buy & Sell Reversal Triggered⚡Base : Hanzo Trading Alpha Algorithm
The algorithm calculates volatility displacement vs liquidity recovery, identifying where probability meets imbalance.
It trades only where precision, volume, and manipulation intersect —only logic.
✈️ Technical Reasons
/ Direction — LONG / Reversal 4355 Area
☄️Bullish momentum confirmed through strong candle body.
☄️Structure shifted with higher-low near key demand base.
☄️Volume expanding confirms order-flow alignment upward.
☄️Buyers reclaimed imbalance with sustained clean break.
☄️Algorithm detects rising momentum under low liquidity.
✈️ Technical Reasons
/ Direction — SHORT / Reversal 4905 Area
☄️Bearish rejection confirmed through sharp candle body.
☄️Lower-high forming beneath resistance supply region.
☄️Volume decreasing confirms exhaustion in price rally.
☄️Sellers regained imbalance with heavy top rejection.
☄️Algorithm detects fading demand and shift to control.
⚙️ Hanzo Alpha Trading Protocol
The Alpha Candle defines the day’s real control zone — the first battle of momentum.
From this origin, the Volume Window reveals where the next precision strike begins.
⚙️ Hanzo Volume Window / Map
Window tracked from 10:30 — mapping true market behavior.
POC alignment exposes institutional bias and breakout potential zones.
⚙️ Hanzo Delta Window / Pulse
Delta window monitors real buying vs. selling power behind each move.
Tracks volume aggression to expose who controls the candle — buyers or sellers.
When Delta aligns with Volume Map, momentum becomes undeniable.

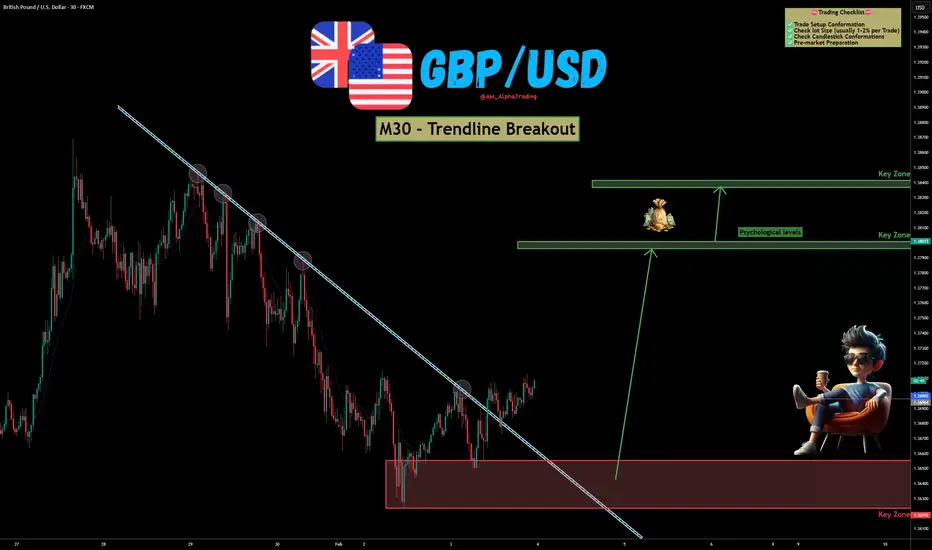
GBP/USD – Trendline Breakout | Bullish Reversal SetupGBP/USD has shown a clear breakout above a well-respected descending trendline on the M30 timeframe, hinting at a potential shift from bearish to bullish momentum. Price action is reacting strongly from a key demand zone, increasing the probability of continuation to the upside. OANDA:GBPUSD
📊 Technical Overview :
Price respected the descending trendline multiple times, confirming its validity.
The recent clean breakout and hold above the trendline suggests buyers are stepping in.
A strong base has formed at the lower demand zone, acting as a launchpad for the move.
Upside targets are aligned with psychological levels and higher-timeframe key zones, offering a favorable risk-to-reward setup.
As long as price holds above the breakout area, bullish continuation remains the preferred bias.
✅ Support this analysis with a
LIKE 👍 | COMMENT 💬 | FOLLOW 🔔
It helps a lot & keeps the ideas coming!
⚠️ Disclaimer: This analysis is for educational purposes only and does not constitute financial advice. Forex trading involves high risk. Trade only with capital you can afford to lose and always do your own research.
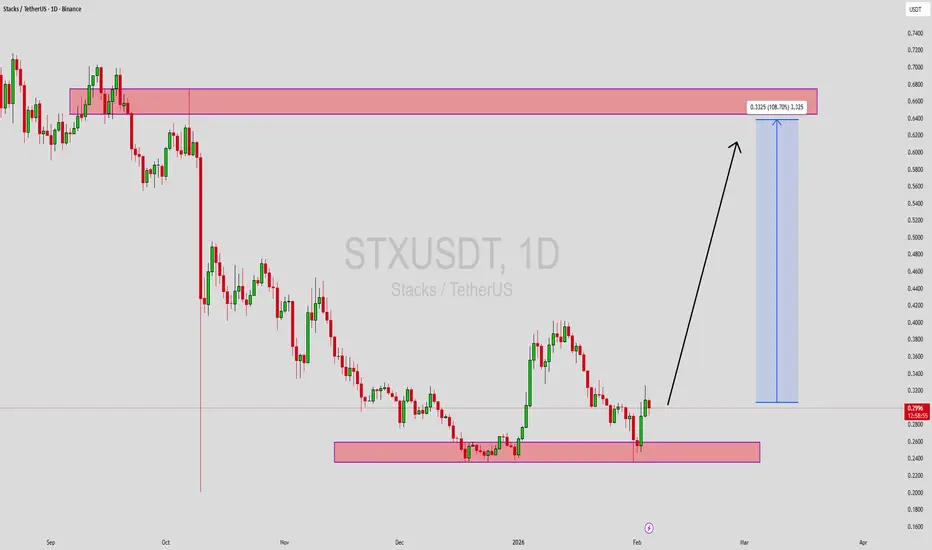
STXUSDT Forming Bullish MomentumSTXUSDT is forming a clear bullish momentum pattern, a classic bullish reversal signal that often indicates an upcoming breakout. The price has been consolidating within a narrowing range, suggesting that selling pressure is weakening while buyers are beginning to regain control. With consistent volume confirming accumulation at lower levels, the setup hints at a potential bullish breakout soon. The projected move could lead to an impressive gain of around 90% to 100% once the price breaks above the wedge resistance.
This bullish momentum pattern is typically seen at the end of downtrends or corrective phases, and it represents a potential shift in market sentiment from bearish to bullish. Traders closely watching STXUSDT are noting the strengthening momentum as it nears a breakout zone. The good trading volume adds confidence to this pattern, showing that market participants are positioning early in anticipation of a reversal.
Investors’ growing interest in STXUSDT reflects rising confidence in the project’s long-term fundamentals and current technical strength. If the breakout confirms with sustained volume, this could mark the start of a fresh bullish leg. Traders might find this a valuable setup for medium-term gains, especially as the pattern completes and buying momentum accelerates.
✅ Show your support by hitting the like button and
✅ Leaving a comment below! (What is your opinion about this Coin?)
Your feedback and engagement keep me inspired to share more insightful market analysis with you!
Lingrid | GOLD Correction Ends - Bullish Move Ahead ?OANDA:XAUUSD reacted aggressively from the resistance zone near the recent peak, but the sell-off appears corrective rather than trend-breaking. Price swept liquidity below the rising structure, tagged the higher-timeframe support zone, and quickly rebounded — a sequence that often signals exhaustion on the downside. Importantly, the broader ascending trendline remains intact, keeping the higher-low framework alive.
If price continues to stabilize above the 4,800 support area, upside pressure could rebuild toward the 5,200 level, where previous balance and unfilled liquidity sit. The sharp drop may have served as a reset, allowing momentum to reload rather than reverse.
➡️ Primary scenario: hold above 4,790 → recovery toward 5,200
⚠️ Risk scenario: sustained acceptance below 4,720 could open the door for a deeper structural pullback
If this idea resonates with you or you have your own opinion, traders, hit the comments. I’m excited to read your thoughts!

Gold Holds Demand - Long Scenario After Correction Toward $5,180Hello traders! Here’s my technical outlook on XAUUSD (1H) based on the current chart structure. Gold initially traded within a well-defined range, indicating a period of accumulation and market balance. This consolidation eventually resolved to the upside, leading to a strong impulsive move and confirming bullish intent. Following the breakout, price respected a clean ascending channel, forming higher highs and higher lows. Multiple bullish breakouts along the structure confirmed sustained buyer control. However, after reaching the Resistance / Seller Zone around 5,180–5,200, bullish momentum weakened, and price faced strong rejection, resulting in a sharp corrective drop. This pullback drove price into a major Buyer Zone around 4,880–4,925, which aligns with a key horizontal support level and a previous breakout area. Price briefly dipped below this zone but quickly reclaimed it, forming a fake breakdown — a strong sign of seller exhaustion and buyer defense at demand. Currently, XAUUSD is stabilizing above the Buyer Zone, suggesting the correction may be complete. As long as price holds above this demand area, the structure favors a long scenario on pullbacks rather than continuation to the downside. A healthy retracement and consolidation within or just above the Buyer Zone could provide a favorable long opportunity. Bullish confirmation from this area increases the probability of a continuation move toward the 5,180 Resistance / Seller Zone (TP1). This level represents the first major upside target and an area where partial profits can be considered. If bullish momentum strengthens and price breaks above the Seller Zone with acceptance, the move could extend further toward higher resistance levels, confirming trend continuation. The long scenario remains valid as long as price holds above the Buyer Zone and avoids acceptance below support. A decisive breakdown and acceptance below the Buyer Zone would invalidate the long bias and shift focus back toward bearish continuation. Until that happens, Gold remains positioned for a bullish recovery from demand within the broader market structure. Please share this idea with your friends and click Boost 🚀

Gold’s 15% Two-Day Surge Signals Strength Despite VolatilityGold’s 15% Two-Day Surge Signals Strength Despite Volatility
From our previous analysis, gold is only rising as expected. After the price tested 5600, we saw an aggressive sell-off from the high to 4400, where gold also found strong support.
This drop was almost -20%, but what is surprising is that gold has already recovered by almost 15% in just two days.
Fundamentals have not changed much, and the geopolitical and economic backdrop has remained largely unchanged, thus increasing the chances that gold will continue to rise further.
It is possible that it could test 5000 before moving higher, but we cannot rule out the possibility that it will rise from the current price.
The U.S. military on Tuesday shot down an Iranian drone that "aggressively" approached the Abraham Lincoln aircraft carrier in the Arabian Sea, the U.S. military said. It is possible that this news will create a stir in the coming days.
You may watch the analysis for more details
Thank you and good luck! 🍀
❤️ If this analysis helps your trading day, please support it with a like or comment ❤️

XAUUSD – H2 Technical OutlookXAUUSD – H2 Technical Outlook: Bullish Structure Rebuild as Precious Metals Surge | Lana ✨
Precious metals are back in focus as silver surges sharply, adding momentum to the broader metals complex. In this context, gold is showing signs of structure rebuilding after a healthy correction, setting the stage for potential continuation.
📈 Market Structure & Technical Context
After a strong impulsive drop, gold successfully defended the 4,420–4,450 strong support zone, where buyers stepped in decisively. Since then, price has been forming higher lows along an ascending trendline, signalling a shift from distribution into recovery.
The current price action suggests this move is corrective-to-bullish, not just a short-lived bounce.
🔍 Key Levels to Watch
Strong Support: 4,420 – 4,450
This zone remains the structural base. As long as price holds above it, bullish scenarios stay valid.
Mid Resistance / Reaction Zone: ~5,050 – 5,080
Price is currently consolidating here, absorbing supply after the rebound.
Next Resistance: ~5,135
A clean break and acceptance above this level would confirm continuation strength.
Upper Targets: ~5,300 – 5,350
Aligned with Fibonacci extensions and prior supply zones.
Higher Objective: ~5,580
Only in play if bullish momentum accelerates across the metals market.
🎯 Bullish Scenarios
If gold continues to respect the upper trendline and holds above the 5,000 psychological level:
A brief pullback into 5,000–5,050 could offer structure for continuation.
Acceptance above 5,135 opens the path toward 5,300+.
Strong momentum, supported by silver’s breakout, could extend moves toward 5,580.
Any pullbacks toward support are currently viewed as constructive corrections, not weakness.
🌍 Intermarket Insight
Silver’s sharp rally highlights renewed demand across precious metals, often acting as a leading signal for broader sector strength. This backdrop supports the idea that gold’s recent correction was a reset, not a reversal.
🧠 Lana’s View
Gold is rebuilding its bullish structure step by step. The focus is not on chasing price, but on how price reacts at key levels. As long as structure and momentum remain aligned, the broader trend stays constructive.
✨ Stay patient, respect the zones, and let the market confirm the next expansion.

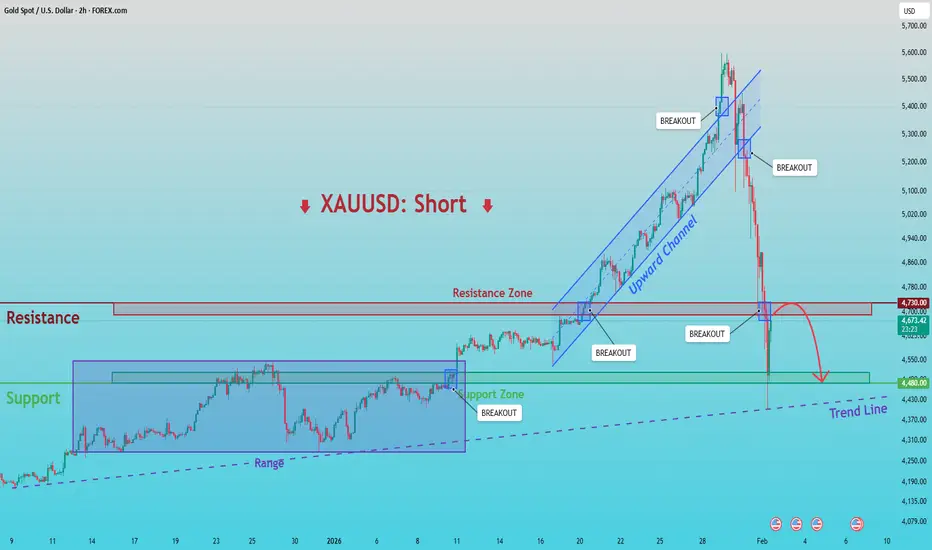
XAUUSD: Below 4,730 Resistance - Targeting 4,480 SupportHello everyone, here is my breakdown of the current XAUUSD setup.
Market Analysis
XAUUSD was previously trading within a clearly defined upward channel, where price respected both the rising support and resistance boundaries, forming a sequence of higher highs and higher lows. This structure confirmed strong bullish control and sustained trend continuation. During this phase, multiple bullish breakouts occurred, each followed by continuation, reinforcing buyer dominance. However, as price reached the upper boundary of the channel near the recent highs, bullish momentum started to fade. The market failed to maintain acceptance at elevated levels, and selling pressure increased sharply.
Currently, gold broke decisively below the lower boundary of the upward channel, marking a clear structural shift. This breakdown was accompanied by strong bearish candles, signaling aggressive seller participation. Price then dropped rapidly into the former Resistance Zone around 4,730, which has now been tested from above and below. The inability to reclaim and hold above this level suggests that previous support has flipped into resistance, reinforcing the bearish bias. Overall, the recent price action points to a trend transition from bullish continuation into a corrective-to-bearish phase.
My Scenario & Strategy
My primary scenario favors a short setup as long as XAUUSD remains below the 4,730 Resistance Zone and continues to show rejection from this area. The current rebound appears corrective in nature, rather than the start of a new bullish leg. As long as price fails to reclaim the broken channel and resistance, I expect selling pressure to resume. The next logical downside target lies near the 4,480 Support Zone, which aligns with previous demand and a rising higher-timeframe trend line, making it a natural area for price to react (TP1).
However, if gold manages to reclaim the 4,730 resistance with strong acceptance and closes back above it, this would weaken the bearish scenario and suggest a deeper recovery or potential range formation. For now, structure favors sellers, with rallies viewed as opportunities for continuation to the downside rather than trend reversal.
That’s the setup I’m tracking. Thank you for your attention, and always manage your risk.