How to Build a Super Pitchfork with Reaction & Trigger LinesIn this educational video tutorial, I guide you through the process of setting up a Super Pitchfork using the Bitcoin daily chart. This method is inspired by Patrick Mikula’s work in " The Best Trendline Methods of Alan Andrews. "
I demonstrate how to:
- Create and project reaction lines
- Generate bullish and bearish trigger lines
- Apply a personal timing technique for pitchforks based on Michael Jenkins’ methods by squaring significant pivots to the median line, reaction lines, and upper parallel to produce time-based reaction points anticipating potential market turns.
This walkthrough is for traders who already have a foundational understanding of pitchforks.
Inspired by the work of Patrick Mikula, this is how I personally apply and expand on the Super Pitchfork method in my own charting.
Pitchforks

Understanding PitchforkThe Pitchfork indicator, also known as Andrews' Pitchfork, is a popular technical analysis tool used by traders to identify potential support and resistance levels, as well as to gauge the direction of a trend. Developed by Dr. Alan Andrews, this indicator is based on the concept of median lines and is particularly useful in trending markets.
How the Pitchfork Indicator Works
The Pitchfork indicator consists of three parallel trendlines that are drawn using three key points on a price chart:
Pivot Points:
The first point (P0) is a significant high or low in the price action.
The second (P1) and third (P2) points are subsequent highs or lows that form the basis of the trend.
Drawing the Pitchfork:
The middle line (median line) is drawn from P0 to the midpoint between P1 and P2.
The upper and lower lines are drawn parallel to the median line, starting from P1 and P2, respectively.
These three lines create a "pitchfork" shape, which helps traders visualize potential areas of support and resistance.
Key Features of the Pitchfork Indicator
Trend Identification:
The Pitchfork is most effective in trending markets. The median line acts as a dynamic support or resistance level, depending on the direction of the trend.
In an uptrend, prices tend to gravitate toward the median line and often find support there.
In a downtrend, the median line acts as resistance.
Support and Resistance Levels:
The upper and lower lines of the Pitchfork serve as potential resistance and support levels, respectively.
Traders often look for price reactions (bounces or breaks) at these levels to make trading decisions.
Price Targets:
The Pitchfork can help identify potential price targets. For example, if the price breaks above the upper line in an uptrend, it may continue to move higher, with the next target being the extension of the median line.
Divergence and Convergence:
The Pitchfork can also highlight divergences or convergences between price action and the indicator, which may signal potential reversals or continuations.
How Traders Use the Pitchfork Indicator
Trend Confirmation:
Traders use the Pitchfork to confirm the strength and direction of a trend. If prices consistently respect the median line and the parallel lines, the trend is considered strong.
Entry and Exit Points:
Traders often enter trades when prices bounce off the median line or one of the parallel lines. Exits are typically planned near the opposite parallel line or when the price shows signs of reversal.
Stop-Loss Placement:
Stop-loss orders are often placed just outside the Pitchfork lines to minimize risk in case the price breaks through the expected support or resistance levels.
Combining with Other Indicators:
The Pitchfork is often used in conjunction with other technical indicators, such as moving averages, RSI, or MACD, to increase the probability of successful trades.
Limitations of the Pitchfork Indicator
While the Pitchfork is a powerful tool, it has some limitations:
It works best in trending markets and may produce false signals in sideways or choppy markets.
The accuracy of the Pitchfork depends on the correct selection of pivot points, which can be subjective.
It requires practice and experience to use effectively.
Conclusion
The Pitchfork indicator is a versatile and insightful tool for traders seeking to analyze trends and identify key levels of support and resistance. By understanding how to draw and interpret the Pitchfork, traders can enhance their technical analysis and make more informed trading decisions. However, like all technical tools, it should be used in conjunction with other analysis methods and risk management strategies to maximize its effectiveness.

Median Lines and Finding the Right Path When it comes to learning about markets and trading, finding the right path and committing to it is the hardest part. The right path has little to do with any technical analysis method. It has to do with structuring our mental framework so that we fundamentally change how we experience markets, trading, and loss.
In the video, I show some Median Line and Action/Reaction work but this work is useless by itself. No tool is good or bad, they are just tools we use to comprehend markets. The problem arises when the tools start using us and we think there is some kind of magic to them.
The essence of our strategy should be to structure our methods and mindset towards functionality. The journey we should commit to is one marked by fostering accountability and responsibility in all our actions. The swing trade Idea I show, takes method and structures it into function.
Shane

UNVEILING THE COMPREHENSIVE ARSENAL OF TRADING TOOLS
The trading landscape in the 21st century is characterized by a revolutionary fusion of cutting-edge technology and financial acumen. As the accessibility of trading increases, traders wield a versatile suite of tools that encompass chart patterns, Fibonacci retracements, Andrews' pitchfork, and the Zig Zag indicator. This in-depth exploration delves into the profound significance of these tools, unraveling their collective potential to empower proactive traders with precision, insight, and strategic advantage.
The Evolution of Modern Trading Tools:
The digital age has ushered in a new era of trading prowess, where rapid data flows and advanced software solutions redefine the boundaries of trading. Enabled by the synergy of computers, high-speed internet, and sophisticated charting software, traders enjoy real-time access to data analytics and market trends. Within this realm, a rich repository of tools is available, catering to traders' diverse needs with heightened precision and predictive power.
Chart Patterns : Deciphering Market Sentiment:
Chart patterns occupy a pivotal role as visual conduits of market psychology and price action trends. From classic formations like double bottoms to iconic patterns like head and shoulders, these visual representations encapsulate historical price movements and inform future price dynamics. Proactive traders leverage chart patterns to anticipate pivotal reversals and breakout points, weaving together historical trends and human behavioral insights into actionable trading strategies.
Fibonacci Retracements: Unveiling Harmonious Ratios:
At the nexus of mathematics and trading, Fibonacci retracements harmonize the natural ratios discovered by Leonardo of Pisa, known as Fibonacci. These ratios, including the Golden Ratio (0.618) and its derivatives, echo natural proportions that echo throughout nature and financial markets. Traders utilize these retracements to identify potential support and resistance levels, choreographing entry and exit points with a mathematical precision that complements market intuition.
Andrews' Pitchfork: Sculpting Market Trends:
From the annals of technical analysis emerges Andrews' pitchfork—a tool that imparts structure to market trends. Crafted by Dr. Alan Andrews, this method employs three pivotal price points to map out potential trend channels, identify support and resistance zones, and navigate the ebb and flow of market movements. Proactive traders harness this tool's prowess to create strategies that thrive within these discernible channels.
Zig Zag Indicator : Distilling Price Trends:
Navigating the labyrinthine price chart is simplified by the Zig Zag indicator—a tool designed to eliminate market noise and elucidate significant price movements. This indicator employs precise highs and lows to create lines that showcase trends with clarity, ensuring that traders are privy to substantial trends while disregarding minor fluctuations. In this manner, the Zig Zag indicator becomes a beacon amidst market complexity.
A Synergistic Trading Arsenal:
The amalgamation of chart patterns, Fibonacci retracements, Andrews' pitchfork, and the Zig Zag indicator engenders a holistic trading approach of unparalleled potency. While chart patterns unveil market psychology, Fibonacci retracements contribute mathematical precision, Andrews' pitchfork orchestrates trend analysis, and the Zig Zag indicator distills trends from noise, thus harmonizing a comprehensive trading strategy.
Conclusion:
In an era marked by unceasing innovation, success in trading is predicated upon the adept utilization of a multifaceted toolset. The amalgamated prowess of chart patterns, Fibonacci retracements, Andrews' pitchfork, and the Zig Zag indicator constitutes a comprehensive arsenal that empowers traders with foresight, precision, and strategic edge. As the 21st-century trading milieu continues its evolution, mastery over these tools remains pivotal, transforming the intricate dynamics of financial markets into a realm of opportunity and achievement.
TCPLTP

Andrews' Pitchforks are FunHere's an example of a pitchfork drawn on the 2 weekly BNC:BLX chart, measured from the March 2020 low to the Nov 2021 high and completed at the Nov 2022 low, and then extended in direction and levels (up to 9 levels can be added).
The chart above makes for a solid example of how pitchforks can be used to derive a trend or channel and find solid support and resistance levels within it. They are also just fun to work with!
There are several types of pitchforks which can be tested until you've found one that works best for your chart. They are called Andrews' Pitchforks because they were originally developed by Alan Andrews, with several derivatives created by modifying calculation for the placement of the pitchfork's handle (the slope of its median line):
Normal Pitchfork - Andrews' original pitchfork tool.
Schiff Pitchfork - moves start of the handle line halfway to the base of the channel.
Modified Schiff Pitchfork - handle start is adjusted by a distance equal to half the difference between price values of its first two points (first low and high, or first high and low) of three.
Inside Pitchfork - handle adjusted to half of the vertical & half of the horizontal distance between the first two points of three.
In the example above, I chose a Modified Schiff Pitchfork , and then identified 3 points of consecutive highs and lows. In this case: low -> high -> low. You can choose to do the opposite of this and start from high -> low -> high, typically your first point should represent the beginning of a new trend.
Play around with trying this in different timeframes, and also try editing / adding / removing levels. You can try basic levels at increments of 25% or by utilizing classic Fibonacci levels (or both, as shown above).
Pitchforks are a type of Fibonacci tool, so I like using classic Fib levels. You could just use the Fibonacci Channel tool and get a similar result. But, the nice thing about utilizing a pitchfork is that it can help you identify a channel that may not be immediately obvious.
Here is another example of using a Modified Schiff Pitchfork to derive trends on a popular altcoin, BINANCE:HBARUSD :
Thanks for reading, I hope this was helpful to you. I learned more about pitchforks myself while working on this, and encourage others to do the same!

Modified Schiff Pitchfork on Full Chart HistoryAn example of how a modified Schiff Pitchfork, with lines extended, can be used to ascertain trend and various trend levels for the full chart history of BINANCE:HBARUSD
Pitchforks can be extended to detect new bottoms and tops as well:

Information about PITCHFORK (Andrew's Pitchfork)Pitchfork a simple yet effective tool, if implemented correctly, can offer you dynamic levels to watch which one could have ignored otherwise.
------- Pitchfork has three points -------
1) Anchor Point
2) High Point of TREND
3) Low point of TREND
------- Quality of Pitchfork -------
1) Applying Pitchfork on Higher timeframes to Judge where we are in a macro trend is a good way to use Pitchfork and to see if MACRO trend is actually changing or not.
2) Number of interaction points to the median line and extreme lines which can act as DYNAMIC support or resistance lines is crucial.
3) HAVING your ANCHOR POINT between High and Low of next TREND is OPTIMAL way to get good result from your PITCHFORK.
If you would like me to update this with how to use pitchfork and post more educational content,
then please do like this idea and comment your queries which i will try to answer.
My previous ideas :-

Follow the eye - detailsIn the chart there are 2 Median Lines, 1 Fan (Dr . Alan H. Andrews style) a trendline - and... a smiling dog 'cause it's Fun!
Now the Median Line per 1.2.3. been shared for the first time here
The Upper Parallel Median line test is where the Blu arrow is and it shows a dynamic resistance level that worked pretty well.
Here is another update of the same pattern:
Right now prices are close to the 50% lower inside Parallel Median Line, first small green arrow in the chart. The 2 green arrows show 2 potentially relevant support zones.
The second Median Line is the one per 1'.2.3. The prices tested the Center Line of this pattern (orange arrow). The second test been where the blu arrow is, and it's the 50% upside parallel of this Median Line (resistance).
This Median line been shared for the first time here:
and then here:
but the most important been this one
Considered the efficacy of these 2 Median Lines in the past we may have high probability to see these patterns working as good dynamic levels to check even in the future.
The dynamic trendline offered extremely relevant Res. zone that been tested multiple times and may worth a check in the future. The first time we pointed out the potential efficacy of that trendline been here:
The Fan using the Dr Alan H. Andrews settings could be used as dynamic support and resistance to check and the crosses of the fan with the trendlines generated form the Median Lines are called "energy points" and could be checked as price magnet levels as well as resistance or support and trend chaange detectors.
Maybe U can use the levels in this chart to track the future price fluctuations.
Hope you enjoy!
(Too much hurry from me yesterday, have to say sorry to Nico the moderator.)

Pitchfork Tutorial- Platinum as an exampleBasic forks
Platinum as an example
Major pivots
Always
High-low-high
OR
Low-High-Low
Use pitchforks to frame PA
80% of the time price returns to the median line from the third pivot
GRI 2022

CL1! - How I approach my analysisA Trader asked me, if I could show how I approach my analysis. And this is what this Video is about.
At the end we even have a potential trade and definitely a chart to observe.
What you will see is:
- the big picture
- swings
- Andrews Pitchfork
- the sine-wave pattern
...and even the classic Head & Shoulder, which reveille where the meat is.
Let's start...

HowTo - Find REAL Pivot/Swing Highs & LowsWant to avoid unnecessary stops and find REAL market structure? Here's you can improve, hiding your stops, and identify a REAL turn in the current flow of price.
Questions?
Ask!
#learntoearn

The Power of the P0 - P3/P4 Fork for finding P5 ReversalsThe power of the Fork is NOT in just anchoring 3 pivots. The power comes from how the USER applies & interprets the "Story" the FORK is showing you. Today I am showing you a unique method of isolating important pivots in the market that give the trader an increased probability or edge in capturing a strong move. it is NOT the unicorn you've been searching for however unicorns leave clues for those who can see them!
Thanks
RB

Use of Pitchfork for intraday in Live MarketHere I bring you the concept of classic pitchfork and how to use it in live intraday market...
watch full video and you will see that how perfectly the pitchfork level works....

How to Accurately Read My Schiff PitchforkAnother link to the Schiff Pitchfork idea is also below in "Related Ideas" :
I realized that sharing my Schiff Pitchfork idea may not have been sufficient enough to allow others to be able to use it efficiently and accurately. I wanted to make a video that shows people how I use the Schiff Pitchfork to trade and analyze; Along with some extra tips.
The video is 20 minutes, but well worth it and shows my analysis for BTC since I have came back to charting this January 13th.
In related links, you can also find the idea "BTC End above 41,700 potential". That idea shows some of the analysis on the movements during those times.
Thank you for watching the video. I hope you enjoyed it. Stay Healthy and Stay Safe.

Get major S&P trading levels through Pitchfan!Hey everyone, how are you all?
Let’s discuss Pitchfan and Fibonacci Channel on S&P 500. There are some bearish news in the market. The news includes Federal Reserve’s stance on increasing the interest rates, making investors shifting into the bond markets. Netflix down by 22%. Your trades should always respect the fundamental analysis. Don’t try to go against it.
Market Condition:
S&P Index has been in a massive uptrend, giving around 120% returns from its previous low on 20 March 2020. It has been in uptrend since March 2020, having few corrections. But, with Pitchfan, we can catch all these corrections with high accuracy.
Pitchfan
Pitchfan is a mixture of Fibonacci Fan and Pitchfork. It uses both of their levels and has some features of Gann Fan too. The red coloured line is the median line which is the main support and resistance line. The other lines have importance according to Fibonacci’s rules. Main lines are 0.382, 0.5, 0.618. We have kept 0.25 because it is the median of the red line and the 0.5 level of Fibonacci. You can use my levels through the picture in the chart.
How to draw a pitchfan?
Pitchfan is drawn at the starting of a trend. Here, the market was consolidating before entering into the uptrend. A is the the first low of the trend, B is the next high and C is the next low. It can be drawn on the higher timeframes. Refer to the image below.
How to trade these levels?
These lines are the major points where the trend reverses on the lower timeframes. We can use these levels to trade. You need to check two things to get the direction of the trade:
The current trend matches on both the higher timeframes and the lower timeframes.
The news is in the same direction as your trade.
After this, you have to get the best entry. For this, you need to get these three confirmations:
Candlestick Pattern
Fibonacci Retracement or any Chart Pattern
RSI or any other Oscillator
Check out the below chart image to get the perfect entry:
Observations:
Price will touch these lines in 70% of the cases. Price might not touch these lines in 30% of the cases due to sentiments or any other driving factor.
When price passes by any major level, it will always take a pullback on the lower timeframes. You may trail your stop loss or enter into the trade by checking out the pullback.
Targets?
Target can be the next line coming in the direction of the trade. Always have RR of 3 or more. You can always trail the stop loss after checking out for the pullback on the lower timeframes.
Always check the news before carrying your positions overnight.
S&P might bounce back from the yellow level, from the blue demand zone. If it breaks it, our target will be the red median line.
Fibonacci Channel:
Fibonacci channels gives the major turning levels too. Here, you can see the price is bouncing back from the 0.5 to 0.618 levels, and it has happened multiple times. You can take confirmations on the lower timeframes and take the trades accordingly. Do let me know if you want to learn how to make it.

Quick Andrews Pitchfork Lesson & forecast.It's all in the text boxes.
I''m still a novice with APs, so take it with a grain of salt. But, that's pretty much the gist of pitchforks.
The artistry is in identifying two things. First, the proper datapoints for the anchor and tine points. Second, which frickin' version fits price action - original, schiff, modified schiff, or inside.
If you are a Pitchfork aficionado, please critique. I'm eager to hear your thoughts.

Pitchfork Tutorial from the G to the R to the IPitchfork tutorial
On oil
But could be on anything
Major pivots ABC
high low high
or
low high low
Using tradingview's excellent pitchfork tools
GRI 2022

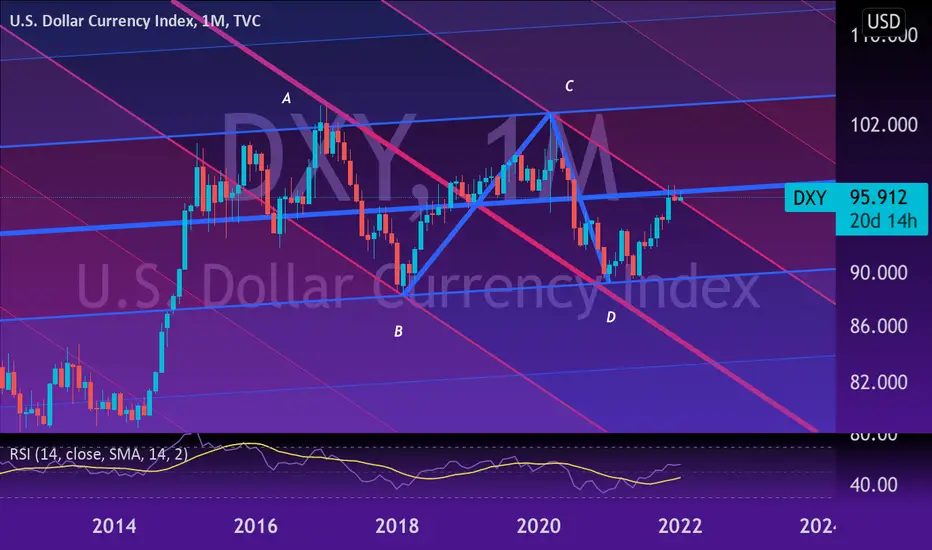
Action reaction charting: DXY macroDXY is at a critical point
And what DXY does next will effect everything
Here we use action reaction charting as developed by Dr Alan Andrews to see why this is a critical moment for markets and the dollar
The Andrews pitchfork uses three major pivots ABC, and forms a median line from A to bisect B and C
80% of the time price returns to median line
Here i have taken the last 4 pivots on the monthly chart ABCD
I have an Andrews fork (PINK) on the ABC pivots
And a modified Schiff fork on the BCD pivots (BLUE)
We can see for the last three months price is trying to break up into the upper right quandrant formed by the two forks, if it fails it will fall into the lower right quandrant
The apex of each gives us price targets of 103 and 89
I believe it will break up
TRADE AT YOUR OWN RISK
GRI 2022
Schiff's trident and Variant Trident, Guide Part 15Schiff's trident and Variant Trident
After Schiff presented his work to Andrews, Andrews suggested a small modification. Practically, the work of this trident derives from displacing the principles of the trident half the vertical distance and half the horizontal distance between the largest and the minimum as shown in the previous graphic. The early fork is now at the midpoint of the blue trend line drawn between the high point and the low point.
Therefore, to draw the modified Shiff's trident, the following method is used:
Set the A and B aspects of the trident (same as standard Shiff's trident).
Mark the highest and lowest of the current upward or downward trend of the market.
To establish C (origin of the pitchfork), we move the principles half the vertical distance between the highest and the lowest and half the horizontal distance between the same points of view. This point will give us C, corresponding to the midpoint of the present trend.
From here, we draw the pitchfork following the standard method in the same way as shown in the following image.
To apply it, it is as simple as doing the following:
Maximum:
First we get the maximum. Then the minimum point after this. Finally the Maximum Point of this Minimum Point. In bearish case. Now in a bullish case it is the same but in reverse.
Minima:
First we get the minimum. Then the maximum point after this. Finally the Minimum Point of this Maximum Point. In Bullish case.
Then we have the Modified Version that places this automatically. So that you save the issue of placing it yourself. Either way. It will place it automatically. Try it. Schiff's Trident Variant or Modified. It is quite good for if you are new to try it in your own way as you practice and it is automatic.

How to draw Action an reaction lines in trend ..................How to draw Action an reaction lines in trend ..................

DOGE IIIA close above previous high shows that the buyers are leading the current wave, a move back to test the pivot 1 could be doable but not so easy considered the actual momnetum. Only with a move back and with a close under pivot 1 we will reconsider the long positions opened in the 0.05 ish.
Update of:

how to apply pitchfork and auto pitchfork studyPitchfork , is a technical indicator for a quick and easy way for traders to identify possible levels of support and resistance of an asset's price. It is presents and based on the idea that the market is geometric and cyclical in nature
* Developed by Alan Andrews, so sometimes called Andrews’ Pitchfork
* It is created by placing three points at the end of previous trends
* Schiff and Modified Pitchfork is a technical analysis tool derived from Andrews' Pitchfork
In general, traders will purchase the asset when the price falls near the support of either the center trendline or the lowest trendline. Conversely, they'll sell the asset when it approaches the resistance of either the center line or the highest trendline.
█ Usage Tips :
* Andrews' Pitchfork (Original) best fit in a Strong Trending Market
* Schiff and Modified Pitchfork better with Correcting or Sideways Market. Modified Pitchfork is almost identical to a Parallel Chanel
Step By Step Applying Pitchfork
Auto Pitchfork Study ʙʏ DGT ☼☾
Besides Auto Pitchfork Pivot, Support and Resistance plotting, study also includes Auto Fibonacci Retracement Levels and Zig Zag indicator
Link to the Auto Pitchfork ʙʏ DGT ☼☾ :

PITCHFORK LEVELS for BTC These aee not holygrail level but you will find btc to show a reaction on these levels and we can scale down to lower timeframe for a trade.
