Bitcoin - Bull trap, expect 92000 USD in November! (must see)Bitcoin formed a symmetrical triangle, and the triangle broke bullish, but can we really believe this price action, or is it a bullish trap? To trap bulls into buying, but then sending the price down. I see many issues with the current price action.
Price created a CME GAP at around 111,000 USD, and you probably know that these gaps tend to be filled pretty quickly. In one of the next analyses, I will tell you how many gaps were filled and how many remained open on the daily and weekly charts. So the price should definitely go back and fill the gap, which means the price needs to go back into the symmetrical triangle, which is bearish.
I think it would be a good long to buy this CME GAP, but only for a short-term intraday trade. I think we are going to go to 92k in November.
Next issue is that Bitcoin just formed a bearish (W)(X)(Y) Elliott wave pattern, so instead of a breakout above the wave (W), we have seen a fakeout or a liquidity sweep. That's another sign of weakness.
The next issue is gold. I think gold's recent pretty significant fall from its all-time high can push the price of Bitcoin down as well.
Altcoins are very weak, and I see BTC.D going up, which suggests that we cannot expect any altcoin season.
So this is my current outlook on BTC, I think we are going to go down in November. You know that the Bitcoin market is highly manipulated by huge banks and governments (they work together), and they can send the price down to take liquidity and liquidate traders on the futures market. This is how they make most of their money, not by sending the price straight to the upside. That's why we will always see many significant drops on the way to the upside. And I think their next plan is to liquidate all ETF traders, so be careful.
Write a comment with your altcoin + hit the like button, and I will make an analysis for you in response. Trading is not hard if you have a good coach! This is not a trade setup, as there is no stop-loss or profit target. I share my trades privately. Thank you, and I wish you successful trades!
Community ideas

Bitcoin - Liquidity grab signals further downside!Bitcoin (BTC) is currently in a crucial phase within a broader consolidation structure. After a strong upward move, the price has encountered significant resistance and is showing signs of weakening buying pressure. On the daily chart, it is clear that the price has re-entered the triangle structure after a brief breakout above resistance.
Liquidity Grab
Around $116,000, a clear liquidity sweep can be observed. Above this level, many stop orders and short-position liquidity were clustered. After this liquidity was taken, the price reversed sharply downward — indicating that large market players likely used this move to take profits or open short positions.
Fake-Out from the Triangle Pattern
The breakout above the triangle structure turned out to be a fake-out. Instead of holding above the trendline for confirmation, the price quickly fell back within the formation. This indicates buyer weakness and strengthens the bearish scenario. A fake-out above a consolidation pattern often leads to a move in the opposite direction — toward the lower boundary of the structure.
Daily FVG
The current candle is positioned within an important daily Fair Value Gap (FVG). If the daily close remains as it is, this bullish FVG will convert into a bearish FVG, meaning the area will now act as resistance. This suggests that bears are taking control and further downward price action is likely.
Target
After an upward fake-out that collects liquidity, price often moves to the opposite side of the pattern. In this case, that would be the lower side of the triangle. A drop toward $103,000–$104,000 is therefore the most likely scenario. This zone aligns with previous structural support and can serve as a logical target area.
Conclusion
Bitcoin is showing clear signs of exhaustion near the top of the range. The liquidity grab and fake-out from the triangle reinforce the bearish outlook. With the daily FVG flipping bearish and bullish momentum fading, a move down toward the $103,000–$104,000 zone appears to be the most probable next step — unless BTC unexpectedly manages to close above the FVG.
-------------------------
Thanks for your support. If you enjoyed this analysis, make sure to follow me so you don't miss the next one. And if you found it helpful, feel free to drop a like 👍 and leave a comment 💬, I’d love to hear your thoughts!

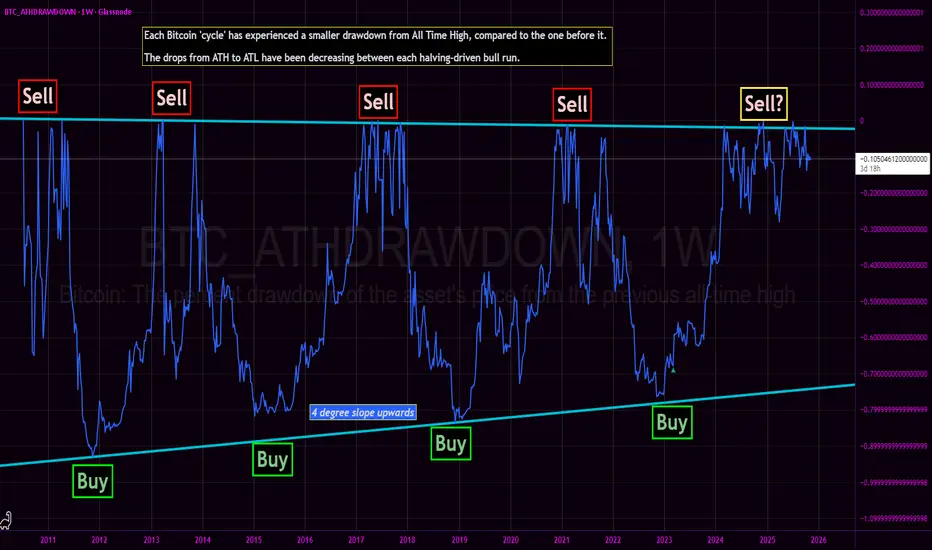
Bitcoin All Time High Drawdown - Bottom nowhere in sight?We revisit the Bitcoin All Time High Drawdown chart originally published in March 2023.
The core thesis of the BTC_ATHDRAWDOWN chart remains intact: each subsequent market cycle has exhibited a diminishing drawdown from its prior All-Time High, with generational cycle bottoms resting squarely on a discernible upward-sloping diagonal support (the 'Buy' line). The 2022-2023 bear market bottomed perfectly on this structural trendline, confirming the '4 degree slope upwards' trend.
Current Cycle Progress: The Sawtooth Fractal
Following the decisive breakthrough of the 2021 All-Time High, price action has entered an unprecedented and structurally complex phase. We are currently witnessing a prolonged high-frequency sawtooth waveform of continuous All-Time Highs.
This action represents the longest sawtooth fractal near ATH of any cycle prior.
This is a stark deviation from the swift, parabolic ascents that characterized previous blow-off tops:
Contrasting the 2017 Pattern: The 2017 bull run culminated in a sharp, almost vertical run-up to $20,000, immediately followed by a steep and rapid crash. That was a classic V-top.
The 2024/2025 Pattern: Instead of a quick V-top, the market is engaged in an extended, messy distribution/consolidation phase right at the very peak. The continuous setting of new, marginal ATHs followed by sharp, shallow pullbacks creates a dense, high-frequency signal in the ATH Drawdown chart.
This structural evolution—a prolonged struggle to hold and marginally exceed previous peaks—suggests that the market is either building a much larger, more resilient base for an extended super-cycle, or undergoing a slow, drawn-out distribution that fundamentally alters the historical BTC cycle cadence.
This is not financial advice, and presented merely as conjectural musing.
BITCOIN Has this huge Bearish Divergence started the Bear Cycle?Bitcoin (BTCUSD) continues to be under heavy pressure in the past 4 weeks since the October 06 All Time High (ATH) and finds itself battling to hold the 1W MA50 (blue trend-line) as Support. That trend-line has been basically the Support of this Bull Cycle since March 2023, and acted as the most optimal long-term buy level.
** Has the Bull Cycle ended? **
However this Bull Cycle may have very well come to an end already as the 1W RSI has been long exhibiting the same kind of bearish pattern (Lower Highs trend-line), while also having completed the 4-year Cycle, that all previous Bull Cycles formed on their respective tops. This is a huge Bearish Divergence formation as it goes against the price's Higher Highs, indicating trend exhaustion.
As you can see that 1 RSI Lower Highs trend-line formed the November 2021, December 2017 and December 2013 Cycle Tops. Even worse, the current Lower Highs trend-line has been going on since the March 11 2024 High. If BTC closes a 1W candle below its 1W MA50, it has greater probabilities to confirm the start of the new Bear Cycle as all previous ones did on such break-out.
** If yes, how much can it drop? **
Now, it might not be too relevant at this time yet, but as far as how low the Bear Cycle can go to before it bottoms, there are three potential levels of interest where long-term investors can Dollar Cost Average (DCA).
The January 2015 Bear Cycle bottom was formed on the 1W MA200 (orange trend-line). Then the December 2018 Bear Cycle bottom was formed on the 1W MA200 and the 0.382 Fibonacci retracement level from the previous bottom. The last Bear Cycle has its bottom below the 1W MA200 and on the next Fib in line, the 0.5 level. The decline on each Bear Cycle that followed decelerated and was less than the previous (-86.70% to -84.19% to -77.22%).
If the new Bear Cycle has already started then the first level for a potential bottom is again the 0.382 Fib around $58000 where contact may potentially be made with the 1W MA200 as well. If it follows the previous Bear Cycle and bottoms on the 0.5 Fib, it will also be below the 1W MA200 around $45000. If on the other hand it goes a Fib level further, as the last two Cycles did, we are looking at the 0.618 Fib as a potential strong bottom candidate around $35000. That will also be a -70.76% decline from the Top, which will be -7% less than the previous Bear Cycle, which is also the difference that the 2022 Bear Cycle had from the 2018 one.
So what do you think? Has the Bull Cycle ended already and if yes, how low can the new Bear Cycle go? Feel free to let us know in the comments section below!
-------------------------------------------------------------------------------
** Please LIKE 👍, FOLLOW ✅, SHARE 🙌 and COMMENT ✍ if you enjoy this idea! Also share your ideas and charts in the comments section below! This is best way to keep it relevant, support us, keep the content here free and allow the idea to reach as many people as possible. **
-------------------------------------------------------------------------------
💸💸💸💸💸💸
👇 👇 👇 👇 👇 👇

Lingrid | GOLD Post Rate Decision Market ResponseOANDA:XAUUSD has rebounded from the lower boundary of the upward channel, maintaining structure support above $3,900. Price action shows a higher low forming after a wedge correction, hinting at renewed bullish pressure. A sustained hold above the $3,905–$3,950 zone could pave the way for a move toward $4,135. Momentum remains positive as buyers defend key support within the broader ascending structure.
⚠️ Risks:
Stronger U.S. dollar amid higher Treasury yields.
Unexpected hawkish tone from Federal Reserve policymakers.
Break below $3,900 invalidating short-term bullish outlook.
If this idea resonates with you or you have your own opinion, traders, hit the comments. I’m excited to read your thoughts!

Latest Gold Price Update Today – The Downtrend Isn’t Over Yet👋Hello everyone , great to see you again — let’s take a look at OANDA:XAUUSD !
From a fundamental perspective, gold remains range-bound as the US dollar (USD) shows a strong recovery following remarks from Fed Chair Jerome Powell during Wednesday’s press conference.
On the technical chart, gold has formed a clear Double Top pattern on the 4H timeframe, breaking its previous bullish structure and confirming a Change of Character (CHOCH) from an uptrend to a downtrend. Additionally, the EMA 34 and EMA 89 have crossed downward, reinforcing the short-term bearish signal.
For now, the immediate support zone sits around the psychological level of $3,900. If this level is broken, I expect another Break of Structure (BOS) to follow.
What about you — do you think gold will rebound from this support zone or continue falling in the coming sessions? 💬 I’d love to hear your thoughts in the comments!

DOLLAR INDEX (DXY): Confirmed Bullish ContinuationThe DOLLAR INDEX appears to be showing bullish tendencies from both daily and intraday perspectives.
From a daily timeframe, I observe a confirmed breakout of a resistance line within a symmetrical triangle pattern, indicating a trend violation and continuation.
On an hourly timeframe, we see a breakout of a resistance line of a bullish flag pattern, followed by a strong bullish movement.
I anticipate that the market will continue to grow.
The next resistance level is identified at 99.53.

Fomc Xauuusd quick buy Gold (XAU/USD) is showing bullish momentum after FOMC news, bouncing from support around 3951. Price targets are set near 4153 and the long-term target at 4376. A breakout above resistance could trigger a strong upward move.

EURUSD Bulls Eye 1.16050 for Fresh BounceHey Traders, in today’s trading session we are monitoring EURUSD for a potential buying opportunity around the 1.16050 zone.
The pair remains in a broader uptrend and is currently in a correction phase, approaching a key support and resistance area at 1.16050.
Structurally, EURUSD has been forming higher highs and higher lows, suggesting that the current retracement could offer another continuation setup within the bullish leg.
Next move: Watching how price reacts near 1.16050 — if bullish momentum builds from this area, we could see a renewed push toward recent highs.

$116K Neckline Holds the Key to Bitcoin’s Next Big MoveBitcoin is once again shaping a clean Inverse Head and Shoulders (ISHS) structure — a classical bullish reversal pattern. Price is currently trading within the Buy Back Zone, forming the right shoulder of the setup. As long as the structure holds above the setup invalidation zone, this pattern remains valid.
All eyes are now on the $116K neckline, which represents the critical breakout level. A decisive close above this resistance should confirm the ISHS completion, unlocking a potential measured move target toward $130K.
Until the neckline breaks, expect short-term fluctuations within the shoulder zone but structure wise, bulls still hold the advantage.
What’s your take? Do you think BTC can clear $116K and reach $130K next?
Share your thoughts and views in the comments below!

30.10.25 Morning ForecastPairs on Watch -
FX:XAUUSD
FX:EURCAD
FX:EURAUD
A short overview of the instruments I am looking at for today, multi-timeframe analysis down to what I will be looking at for an entry. Enjoy!

BTC - Bouncing From the Sweet Spot?⚔️Bitcoin is currently sitting at a high-confluence zone , where the daily support perfectly aligns with the lower bound of the ascending wedge. This intersection makes it a prime area to look for potential bullish reactions.
🏹As long as this support holds, I’ll be looking for long opportunities, expecting BTC to push higher within the wedge structure.
The first target for this bullish move lies around the upper bound of the wedge, which conveniently lines up with the supply zone near $122,000, a key resistance to watch.
📉If the support fails, the structure could shift, but for now, bulls still have the technical edge.
⚠️ Disclaimer: This is not financial advice. Always do your own research and manage risk properly.
📊All Strategies Are Good; If Managed Properly!
~Richard Nasr

Euro Finds Support — Correction Phase Targets 1.16340Hello traders! I’d like to share my view on the current EUR/USD market structure. After a strong bullish impulse within the ascending channel, the price faced rejection near the Resistance Level around 1.16600, where sellers stepped in, forming a clear turnaround structure. Following that, the pair entered a descending channel, confirming short-term bearish momentum. A breakout below the Resistance Level pushed the price back toward the Buyer Zone, located near the 1.16000 Support Level, where demand previously triggered a bullish correction. Currently, EUR/USD is trading inside a corrective structure just above support. The market has formed a potential reversal setup, suggesting a possible short-term recovery toward the TP1 target near 1.16340. However, as long as the price remains below the Seller Zone, bearish pressure is likely to persist, keeping the market in a consolidation phase. In my opinion, this movement represents a retracement within the broader range rather than the start of a new bullish trend. If the price successfully bounces from the Support Level and confirms higher lows, we may see renewed buying momentum. Otherwise, a breakdown below 1.16000 could open the way for deeper declines. This setup offers a clear short-term trading plan — bullish correction toward TP1, while monitoring reaction around the support area for a potential continuation or reversal signal. Please share this idea with your friends and click Boost 🚀

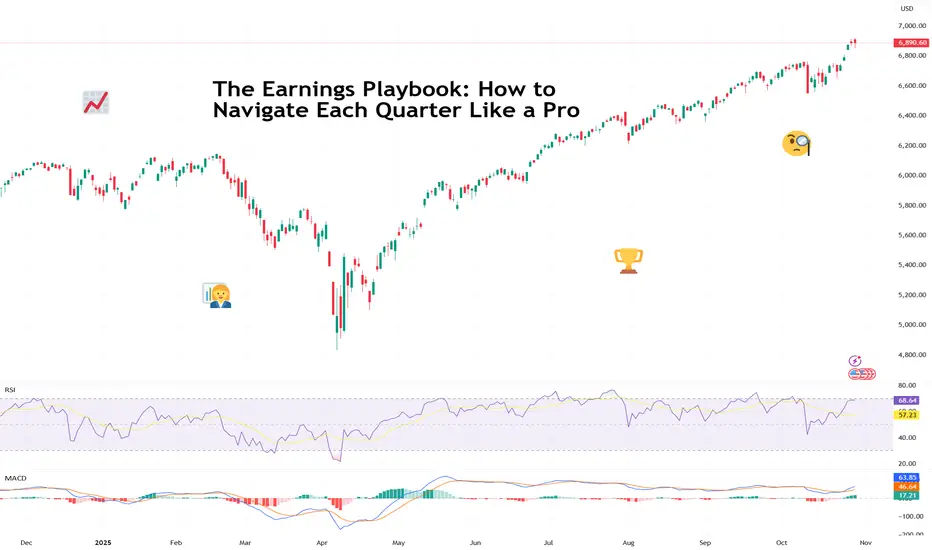
The Earnings Playbook: How to Navigate Each Quarter Like a ProTraders are in the heat of the earnings season and euphoria is sweeping every corner of the market.
The charts twitch, traders stop talking about the Fed for five minutes ( not this week, though ), and online forums turn into a parade of watch-me-trade sessions.
It’s that glorious stretch when companies pop open the books and reveal what’s really been happening behind the scenes.
For professional investors, it’s data heaven. For retail traders, it’s emotional cardio. Stocks can rise 20% on a single upbeat forecast — or plummet before your coffee cools. The trick isn’t just to survive it. It’s to navigate it like a pro.
💼 Know the Seasons (and the Mood Swings)
Earnings season comes four times a year — January, April, July, and October — and each has its own flavor.
Q1 (April): That’s the hangover quarter. Holiday sales meet new-year cost cuts. Traders recalibrate expectations and reality collides with ambition.
Q2 (July): The mid-year checkup. CEOs brag about “momentum,” analysts start sharpening their red pencils. Markets get twitchy.
Q3 (October): The credibility test. Guidance revisions and cautious tones dominate. If the year’s been good, this is where the victory laps start.
Q4 (January): The scoreboard reveal. Everyone tallies their annual wins and losses, and traders begin to bet on who carries the next year’s momentum.
Each cycle has a similar rhythm: hype, reaction, digestion, and speculation. Think of it like a four-act play.
📊 Mind the Gap
One thing to keep in mind whenever you find yourself in the earnings bonanza: the actual numbers matter less than the narrative. ( Looking at you, Oracle NYSE:ORCL )
A company can beat on revenue, miss on profit, and still rally — if the CEO sells a compelling story about the next quarter. Conversely, it can post record earnings and tank because analysts wanted even more.
The pros know to look beyond the headline EPS. They dig into guidance, margins, and segment performance. Is revenue growing because of genuine demand, or just creative accounting? Are margins improving, or did the company quietly cut R&D?
Markets don’t price what’s happened — they price what’s next. That’s especially true for growth stocks like t echnology companies .
🎯 Don’t Chase the Knee-Jerk
Every earnings season has its share of instant overreactions — the “up 10% at open, down 8% by lunch” kind of chaos. That’s when seasoned traders sit back and let volatility do the heavy lifting.
Smart money avoids buying into the frenzy or shorting into despair. Instead, they wait for the second move — when dust settles, algorithms calm down, and humans return to their desks.
🧠 Build Your Own Playbook
To trade earnings season like a pro, you need a plan. Here’s how the veterans prep:
Start early. Check the earnings calendar and mark high-impact names in your portfolio or watchlist.
Study the setup. Look at how the stock’s performed heading into earnings. A big pre-report rally can mean expectations are too high.
Focus on guidance. Earnings beats are old news — future commentary moves markets.
Use position sizing. Never bet the farm on one report. Even the best setups can go sideways.
Don’t forget the macro. Rate cuts, inflation prints, or a stray tweet from the US President can overshadow the best earnings beat.
🕹️ The Big Picture: Earnings as Market GPS
Earnings season is the market’s health check because it tells you which sectors are thriving, which are limping, and how CEOs feel about the future (watch the language: “headwinds” and “volatility” are polite ways of saying buckle up).
Taken together, earnings trends shape the broader narrative — from interest rate expectations to sector rotations. In other words, earnings season is where short-term trading meets long-term investing.
Now go and prepare for the next batch of earnings — Big Tech is on deck this week with Apple NASDAQ:AAPL and Amazon NASDAQ:AMZN reporting today.
Off to you : What’s your strategy this earnings season? Buying the hype or waiting to buy the dip? Share your thoughts in the comments!
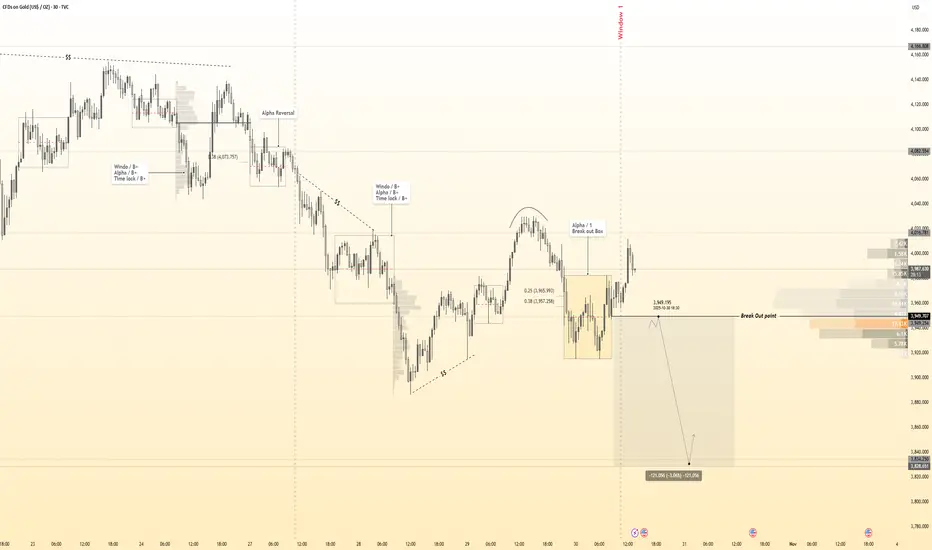
( Gold Protocol ) Bearish After Break Detected( Gold Protocol ) Bearish After Break Detected
Status: Active Reversal Protocol
Symbol: Gold
Session: London–New York Overlap (Smart Exit Window)
Confidence Level: ★★★★★ ( Hanzo Volume Detected )
☄️ Bearish After Break Out 3948
Reasons
1. Alpha Sequence Engaged — Smart flow detected within Hanzo precision range.
2. Volume Window Synced — Session energy aligns with internal volume pulse.
3. Liquidity Cycle Active — Engineered sweep confirms smart money transition.
4. Time Lock Confirmed — Market phase locked with directional intent.
5. Volume Map Aligned — Cluster balance reveals real directional flow.
6. Hanzo Wick Detected — Manipulation wick verified under Alpha filter.
⤵️Every like & comment on our TradingView posts helps us grow. More engagement means more exposure, which benefits everyone in the community!
BTC Analysis 30/10/2025BTC / USDT
Bitcoin is forming a massive ascending wedge pattern, a bearish pattern currently undergoing a bearish retest.
The 200-day EMA is a significant support level and has been tested multiple times in the past few weeks. The more it is retested, the weaker the support becomes.
The sharp drop on October 10th impacted the market's direction.
Bearish targets for this scenario:
First support: 103,000 - 100,000
Major support: 94,000 - 89,000
Summary: The market is currently bearish, and we can revise our analysis if Bitcoin manages to stabilize above 117,000.

THE KOG REPORT - FOMCTHE KOG REPORT – FOMC
This is our view for FOMC, please do your own research and analysis to make an informed decision on the markets. It is not recommended you try to trade the event if you have less than 6 months trading experience and have a trusted risk strategy in place. The markets are extremely volatile, and these events can cause aggressive swings in price.
We’ve done pretty well this week so we’ll only share the levels and potential path but say that it’s really not worth getting involved in the FOMC move itself. We’d rather wait for them to move the price and then look for a set up to get a trade due to the extreme volatility on gold this month.
Below, we have the support level 3965-75 which needs to hold us up in order for this daily candle to close bullish and attempt to target the higher liquidity regions of 4050 and above that 4095. A break above which is very possible will take us into our area or interest which is around the 4150 region. It’s that region we will want to watch, if approached and we get a reaction, an opportunity to short from there may be available to traders.
Because we’re already in long from the swing, there is no point attempting to short it from here, instead, if we do go downside into the lower levels, we will be looking at the 3840-60 regions for a reaction in price to then attempt the scalp long.
RED BOXES:
Break below 3985 for 3955 and 3938 in extension of the move
Break above 4003 for 4020, 4030 and 4061 in extension of the move
Please do support us by hitting the like button, leaving a comment, and giving us a follow. We’ve been doing this for a long time now providing traders with in-depth free analysis on Gold, so your likes and comments are very much appreciated.
As always, trade safe.
KOG

Gold Before the Storm: Calm Silence or a Brewing Wave?Hello everyone,
Gold (XAU/USD) is holding steady around $3,938/oz, as global investors pause ahead of key policy announcements from both the Fed and ECB. After several volatile sessions, the market has entered a phase of quiet consolidation — a tension-filled calm before the next move.
The Fed kept rates unchanged at 4.00%, as widely expected. However, it was the silence that spoke volumes. With no clear timeline for rate cuts and an intentionally neutral stance, the Fed left traders uncertain. This ambiguity has supported the USD, placing mild pressure on gold in the short term.
Across the Atlantic, the ECB’s upcoming rate decision could set the tone for the next directional move. A dovish stance—signaling concern over growth—could strengthen the USD and pull gold toward $3,910–$3,880. Conversely, a hawkish ECB, emphasizing inflation risks, could weaken the dollar and lift gold back toward $4,020–$4,050.
From a technical perspective, the short-term structure remains bearish with a clear series of lower highs. Resistance lies near $3,960–$3,990, overlapping with an unfilled Fair Value Gap (FVG). The Ichimoku Cloud remains above price action, confirming bearish control. However, the $3,910–$3,880 zone has emerged as a potential battleground, where buy-side liquidity could trigger a short-term rebound.
Personally, I believe this calm is strategic — a phase of accumulation before volatility returns. The current range of $3,900–$3,970 resembles a stretched spring, ready to snap once new macro data hit the market. For now, the base case is a test of $3,880, followed by a rebound if the ECB sounds dovish or if the USD weakens.
Is this the calm before the storm—or the start of a new bullish reversal? What’s your take: will gold break lower, or surprise everyone with a rebound?

XAGUSDHello Traders! 👋
What are your thoughts on Silver ?
Silver entered a corrective phase following its recent rally and is now trading below the resistance zone and the broken trendline.
This structure suggests weakening bullish momentum and a potential continuation to the downside once the pullback completes.
We expect price to complete a pullback toward the broken zone and then resume its downward movement toward the identified support levels.
As long as silver remains below the resistance and trendline, the bearish bias stays valid.
A confirmed break and close above resistance would invalidate this scenario.
Don’t forget to like and share your thoughts in the comments! ❤️

Bitcoin - This chart is crumbling!⛔️Bitcoin ( CRYPTO:BTCUSD ) creates a massive top:
🔎Analysis summary:
All the previous cycles on Bitcoin have been lasting about 1,000 days. And exactly three years ago, Bitcoin retested the previous all time high, starting the next bullrun. If we soon see bearish confirmation on Bitcoin, this crypto will lead to another insane bloodbath.
📝Levels to watch:
$100,000 and $50,000
SwingTraderPhil
SwingTrading.Simplified. | Investing.Simplified. | #LONGTERMVISION

Gold Tests Critical Support as Sellers DominateHello everyone, after the sharp decline late last week, gold (XAU/USD) continues to face selling pressure and is currently trading around $3,977, down more than 3% in just two sessions. This is the strongest correction in the past three weeks and has put the market into a defensive phase as price approaches the key psychological support zone at $4,000.
Observing the chart, we can see selling momentum is slowing as price nears the lower Fair Value Gap (FVG) at $3,950 – $3,970. This is an unfinished liquidity zone as well as an important technical support area where buyers may attempt a short-term reaction.
The scenario I favour at the moment is a liquidity sweep toward the $3,950 – $3,970 area before a technical rebound takes place. The nearest resistance to watch lies at $4,100 – $4,200, where multiple FVG clusters and potential selling pressure exist.

#LINKUSDT:minor correction first | major bullish move towards 40The LINKUSDT price is expected to decline to a range between 11.72 and 14.72 before resuming its upward trend. This price range has historically seen significant trading volume, indicating that a drop within this range is likely in the near future.
Once a trading position is initiated, there are three primary targets to consider. The first target is set at 25, which is highly achievable due to its proximity to the current price levels. The second target is at 35, which is also within reach with favourable market conditions.
The final target is at 45, which may require more time to achieve and will depend on strong fundamental support and positive market developments.
Good luck and trade safely.
Team Setupsfx_

XAUUSD – After Powell’s Speech, Gold Is Losing Its Shine!The gold market has entered a tense phase after Fed Chairman Jerome Powell’s remarks on October 29. Although the Fed cut rates by 0.25% as expected, Powell maintained a cautious and slightly hawkish tone, leading investors to doubt the possibility of an aggressive easing cycle ahead. As a result, the USD strengthened while gold lost its upward momentum — a clear signal that the bearish trend is taking control.
On the H2 chart, gold is moving within a well-defined descending channel , consistently forming lower highs and lower lows. Each attempt to retest resistance has been met with strong rejection, confirming that sellers remain in control.
The 3,960,000 zone is acting as a key resistance level where price could bounce slightly before continuing its decline. If this level fails to break, the next bearish targets lie around 3,850,000 and deeper towards 3,790,000, aligning with the lower boundary of the channel.
With the current technical setup and market sentiment favoring the USD, every pullback in gold is merely an opportunity for sellers to take action.
When Powell says “cautious,” the market hears “sell gold!”
