12/01/26 Weekly OutlookLast weeks high: $94,802.73
Last weeks low: $89,312.98
Midpoint: $92,057.85
The first trading week of 2026 continued the same patterns as the end of 2025. With $94,000 still very much the key level that the bears are defending, and defending well. However, the 4H 200 EMA has been reclaimed by the bulls with consistent support bounces when tested indicating a level of strength.
For this week that is what I think is most important for BTC, the bulls are building a base to attempt a rally through $94,000 resistance, should this level be breached with volume $100,000 big even level is the target.
The bears will continue their defense of $94,000 with the objective of pushing price back below the 4H 200 EMA (currently $90,400).
CPI takes place tomorrow and so an increased level of volatility should be expected, especially if the result is different to the 2.7% forecast.
Altcoins have seen a steady rally relative to BTC & ETH, also flipping the 4H 200 EMA with an eye to retest the 1D 200 EMA resistance. If altcoins were to get back above the 1D with acceptance the market would look a lot healthier.
1h

01/12/25 Weekly OutlookLast weeks high: $93,088.10
Last weeks low: $85,279.04
Midpoint: $89,183.57
A brutal start to the week for the bulls here. A -6% move to the downside as soon as the Month of December opens rejecting off the range weekly high. Across the high time frame this confirms a new lower high and a failure to get back within the trend that has stayed consistent throughout this bull market.
All of last weeks recovery bounce has been wiped out in a matter of hours, so now the question is where does the buy side pick up, if at all? FOMC interest rate decision is predicting another rate cut (80% probability) as well as the end of quantitative tightening and the beginning of quantitative easing on paper should bring more liquidity into risk-on markets such as Bitcoin, but that is on a longer timescale.
In the more immediate time frame I think the range broadly $80,000-$100,000 with this weeks range seeing a lot of the noisy PA. Midpoint is a key S/R level to gauge sentiment and conviction, a reclaim of the level may open the door to a stop loss hunt around weekly high but for now the momentum is definitely with the bears.

17/11/25 Weekly OutlookLast weeks high: $107,526.18
Last weeks low: $93,034.53
Midpoint: $100,280.35
Bitcoins downtrend continues as price reaches a 6-month low of $93,000. This price action came as a result of a failed attempt to flip the $107,000-$108,000 level, as this area rejected the bears gained momentum sending BTC sub $100k big even level and the most worrying part of all for the bulls losing the $97,000-$98,000 level. On the Higher timeframes this new lower low sets up for a trend shift. Should any reaction from the bulls fail to flip the weekly high and rollover, I would then have confirmation of a bearish trend and trade accordingly.
Despite the US Government shut down coming to an end, it appears this has not been enough to get the market in a risk-on mood, at least not yet. This compounded with Nvidia earnings in midweek and the larger question mark about the AI industry as a whole has meant buyers are just not will to step in yet. My opinion is that IF Bitcoin trades into the $89,000-$92,000 area that is where support may be found, that's because we have an area of imbalance that broke the previous downtrend in April earlier this year during the tariff war.
This week I expect Wednesday 19th November to be a day of volatility, and some formation of a local bottom in Bitcoin, at least in the short term.
Good luck this week everybody!

20/10/25 Weekly OutlookLast weeks high: $115,965.44
Last weeks low: $103,546.52
Midpoint: $109,755.98
Following the flash crash of two weeks ago, Bitcoin opted for the "fill the wick" pattern last week with a steady continuation of the downtrend printing a low for the week 1.5% shy of completely backfilling the entire wick.
Because of the aggressive nature of the immediate recovery, I would estimate that a large number of stop losses would be placed just under the bottom of the flash crash wick and so as price approached that level, buyers stepped in to move price away from that danger area. I am still not convinced that $98,000-102,000 area is safe from a revisit, but when is a question I do not have an answer for.
This week we've seen an early move by the bulls to flip a very important $108,000 level. I could see BTC conforming to the weeks range quite strongly as both extremities of the range as well as midpoint line up very well with HTF S/R levels. I think any PA between those levels would give clues as to the strength of both sides, bulls and bears but the important moves will happen around the extremes. Of course the trade war news is a factor still in play as well as CPI later in the week.
This CPI release is also taking place during a government shut down, it's the first CPI on a Friday since 2018 and FOMC (rate cut predicted) takes place just 5 days after with massively reduced data releases due to the Government shut down. This to me is a volatility storm waiting to happen and many participants are going into it blind.
Good luck this week everybody!

13/10/25 Weekly OutlookLast weeks high: $126,237.39
Last weeks low: $102,038.44
Midpoint: $114,137.92
Well that was an interesting week... A small reminder that when Trump talks about tariffs the markets move, and move fast!
From All-Time-High at the beginning of the week to a -19.2% move, a single hourly candle had -10.56% drawdown alone!
What can be learnt from this? Despite all the technical analysis in the world, if the President of the United States makes an announcement it can shift the market greatly causing a leverage unwind via liquidations that cascade aggressively. Although these large scale crashes are rare, they are inevitable in this market and this will not be the last of its kind.
This week will be very interesting because generally we do see a lot of backfilling the wick which would mean revisiting the key S/R level at 0.25 ($108,000). The bulls would not want to see price acceptance under this level or IMO this is the beginning of a bearish shift in HTF structure. This potential shift in structure would also line up with the 4 year cycle theory as October marks the end of the bull market.
On the other hand, the bounce from the low has been strong, although still some way off the origin of the dump a lot of ground has been recovered. In the past these liquidation events have marked local lows in the market and serve as a launchpad for the next leg up. I do think it's too early to tell if that is the case this time around, I am in no rush to position either way until at least Mondays range is established.
The altcoin market took a far worse turn, majors sinking as much as 80% in a single move! This week will be important to learn what projects are truly supported/fundamentally sound by how they recover.
Projects such as: ZEC, TAO, ANYONE and BNB have all closed higher than their original price before the crash, other projects may never recover.
Good luck this week everybody!

ETHUSDT 1H - Key Liquidity Zones & Bullish Reversal Potential ETHUSDT 1H Analysis: Price is reacting from a critical support zone between the Fib 0.5 - 0.618 retracement and previous day low, both marked as high-liquidity areas. If current support holds, expect a potential bounce targeting the previous day’s high ($4,530.80), with further upside toward the buy side liquidity at $4,748.04. Watch for confirmation in the highlighted demand zone for low-risk long setups. A break below $4,143.60 would invalidate this scenario and shift focus to lower sell side liquidity.”
This chart setup is useful for traders seeking possible long opportunities, with clearly defined risk and upside targets.

15/09/25 Weekly OutlookLast weeks high: $116,672.39
Last weeks low: $110,615.91
Midpoint: $113,644.15
It's FOMC week and finally the time has come for the FED to cut interest rates, but by how much?
Currently the probability of a cut is 100%. The chance of a 25bps cut is ~90%, a 50bps cut ~12%.
Therefore I believe a 25bps cut is priced in and expected by the majority, a 50bps cut would be bullish and no change would be devastating to the markets in the short term.
Last week BTC continues its move up and flipped the important S/R level of $114,000 in preparation for FOMC. Ultimately the bulls should now target a flip of $117,500 to continue the larger bullrun move. Should the bulls fail to do so the rangebound environment looks to continue with the low being $106,000 (1D 200 EMA).
As I have mentioned in previous post September often gives poor returns, so far this year BTC is up 6% from month open, perhaps in anticipation for the rate cut to come? I don't see many setups presenting themselves until after Thursday so just being patient until then.
Good luck this week everybody!

BTCUSD📊 BTC/USDT Analysis
✅ Update: TP2 successfully hit as per plan. (As in Previously shared plan)
⚠️ Catch: BTC made a new 1H HH around 113,434, but failed to break the 4H resistance at 113,506±.
🔎 Key Observations:
4H structure remains bearish (Lower Highs intact).
1H still holding bullish structure with HLs along the trendline.
Price is currently retesting our buying trendline zone, showing respect to HLs.
🎯 Scenarios:
Long 📌 Plan:1
Aggressive traders:
1️⃣ Bullish Case (Buying Zone Active)-CMP
BTC is at the trendline support zone → early longs possible
Long 📌 Plan:2
Conservative traders: Enter long only if BTC breaks & holds above 113,500±.
Wait for a bullish 4H confirmation candle at the buying zone before entering long.
📌 Short Plan:
Bearish Case (4H Continuation)
If BTC breaks the trendline & last HL of 1H TF , then Short for 4H bearish pattern continuation.
This would invalidate the current buying zone and 1H Bullish Pattern.
📌
Trade with proper risk management.

PALADIUM LONG we can see trend change on 1h.
i expect the market to go up from here.
trade according to strategy you have and trade in this direction.
On daily we can see the consolidation which i belive will play out if we lose prevos HL on daily trend.
On daily we can also see that we are on strong support, e don have daily candels for long direction but i belive we weill se some up movement from here.

doge buy midterm"🌟 Welcome to Golden Candle! 🌟
We're a team of 📈 passionate traders 📉 who love sharing our 🔍 technical analysis insights 🔎 with the TradingView community. 🌎
Our goal is to provide 💡 valuable perspectives 💡 on market trends and patterns, but 🚫 please note that our analyses are not intended as buy or sell recommendations. 🚫
Instead, they reflect our own 💭 personal attitudes and thoughts. 💭
Follow along and 📚 learn 📚 from our analyses! 📊💡"

btc buy midterm"🌟 Welcome to Golden Candle! 🌟
We're a team of 📈 passionate traders 📉 who love sharing our 🔍 technical analysis insights 🔎 with the TradingView community. 🌎
Our goal is to provide 💡 valuable perspectives 💡 on market trends and patterns, but 🚫 please note that our analyses are not intended as buy or sell recommendations. 🚫
Instead, they reflect our own 💭 personal attitudes and thoughts. 💭
Follow along and 📚 learn 📚 from our analyses! 📊💡"

eth sell midterm "🌟 Welcome to Golden Candle! 🌟
We're a team of 📈 passionate traders 📉 who love sharing our 🔍 technical analysis insights 🔎 with the TradingView community. 🌎
Our goal is to provide 💡 valuable perspectives 💡 on market trends and patterns, but 🚫 please note that our analyses are not intended as buy or sell recommendations. 🚫
Instead, they reflect our own 💭 personal attitudes and thoughts. 💭
Follow along and 📚 learn 📚 from our analyses! 📊💡"

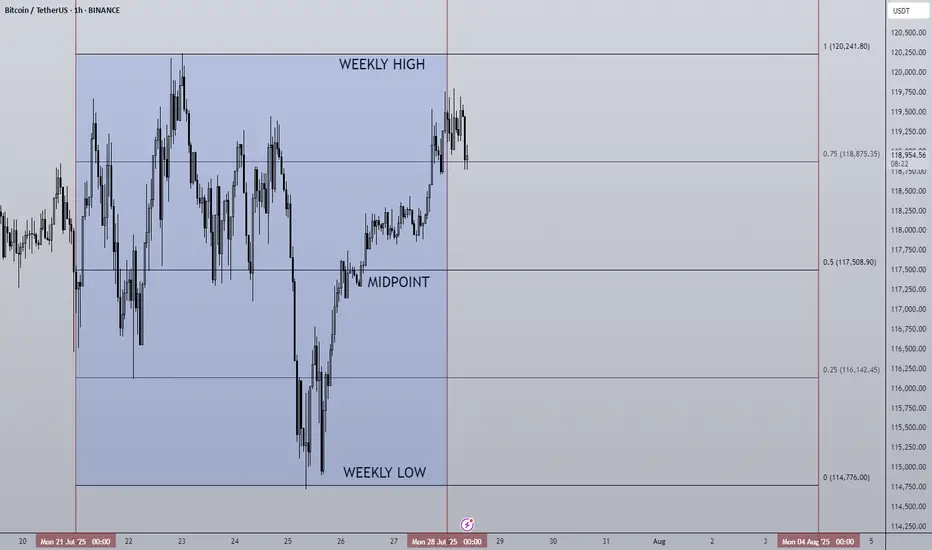
28/07/25 Weekly OutlookLast weeks high: $120,241.80
Last weeks low: $114,776.00
Midpoint: $117,508.90
As we approach the end of the month BTC continues to trade sideways during a cooling off period as altcoins finally take the stage. Last week Bitcoin saw a relatively flat net inflow via ETFs of $72m, ETH on the other hand posted the second largest net inflow week ever at $1.85B! The concentration has certainly shifted...
This IMO is still a very bullish structure for BTC, very shallow pullbacks being bought up/absorbed by still happy to purchase at these levels. As long as this continues altcoins have a strong base to continue growing on, if BTC breaks structure and price accepts below ~$110,000 then the altcoin rally will be over for now I believe.
This week some major altcoins are set to reach HTF resistance areas, ETH has already tagged $4,000 which looks to be a battleground level of major importance.
TOTAL2 which is the combined market cap of all altcoins is currently ~8% from the highs, keeping this in mind for where altcoins may run out of steam...
Good luck this week everybody!
BTC Reloading for Breakout — Watching for 1H MSS Flip
BTC has bounced from local support (green zone) and is challenging the descending trendline.
The price is now testing the red resistance zone and the upper boundary of the 1H MSS (market structure shift) box.
Scenario A (Bullish):
— If BTC cleanly breaks the trendline and flips the 1H MSS box into support (with a strong close above), this is a trigger for a scalp long.
— Target for the move is the upper green box/previous high area near $122,000.
Scenario B (Bearish/Invalidation):
— If price is rejected at the red resistance and falls back below the green support box, risk of deeper pullback toward $116,000 increases.
BTC has shown resilience by quickly reclaiming support after a sweep lower, indicating strong demand. The market looks to be reloading for another push, with liquidity building up just below resistance. The setup favors a breakout if NY Open brings momentum. The flip of the 1H MSS box would confirm bullish intent. However, caution if the breakout fails — structure remains choppy and a failed breakout can trap late buyers.

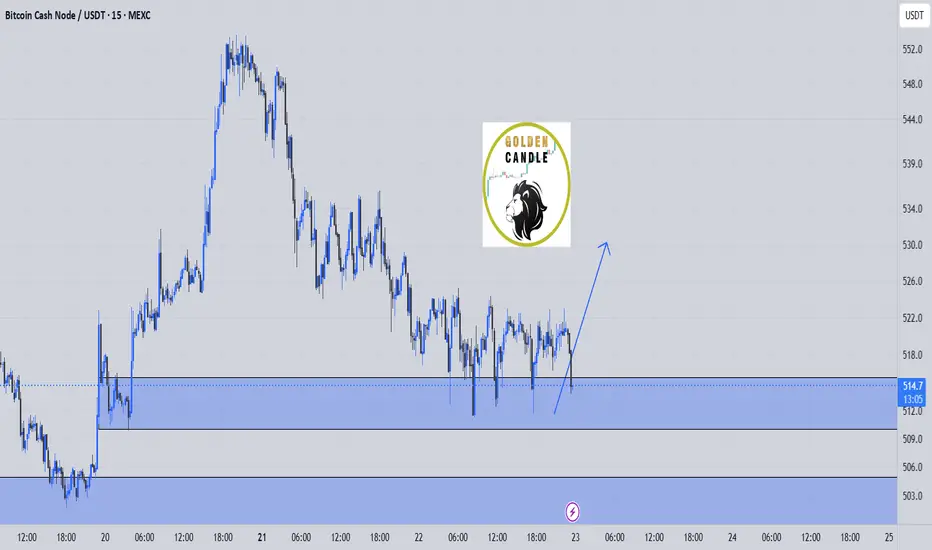
bch buy midterm"🌟 Welcome to Golden Candle! 🌟
We're a team of 📈 passionate traders 📉 who love sharing our 🔍 technical analysis insights 🔎 with the TradingView community. 🌎
Our goal is to provide 💡 valuable perspectives 💡 on market trends and patterns, but 🚫 please note that our analyses are not intended as buy or sell recommendations. 🚫
Instead, they reflect our own 💭 personal attitudes and thoughts. 💭
Follow along and 📚 learn 📚 from our analyses! 📊💡"
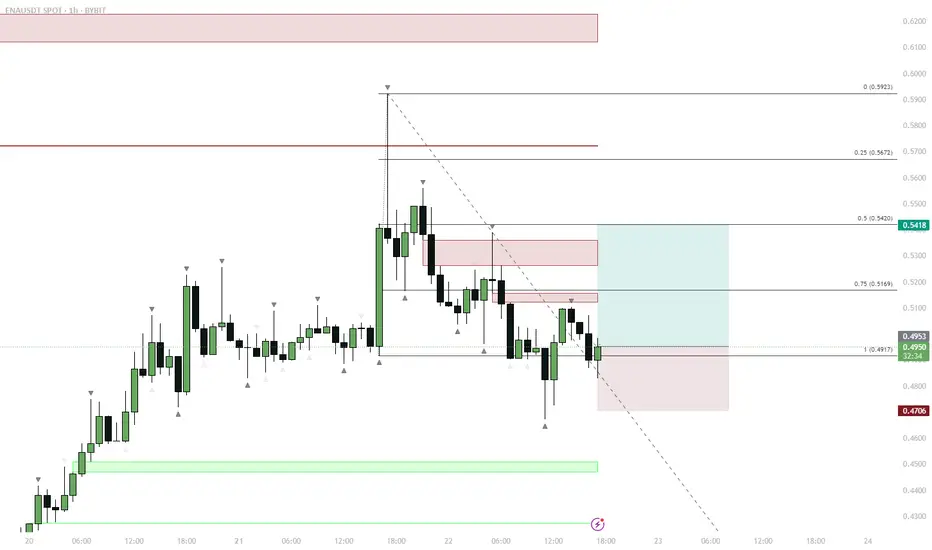
ENA — Range Deviation & Reclaim: LTF Long Setup
ENA traded in a tight LTF range, then deviated below support, forming a sweep/liquidity grab.
Price quickly reclaimed the range low and retested the FVG (Fair Value Gap) below the range.
This reclaim/flip is a classic bullish reversal setup after a sweep.
Entry on the retest of FVG and previous support, targeting a move back to mid-range and then range highs.
Invalidation below the deviation low (stop).
Price action shows a textbook range deviation and reclaim setup. ENA swept liquidity below the range, trapped shorts, and reclaimed support, forming a bullish reversal signal. The retest of the FVG provided a high-probability entry for a move back to the range highs. This play relies on the principle that deviation and reclaim below a range often leads to a reversal as trapped sellers are forced to cover.
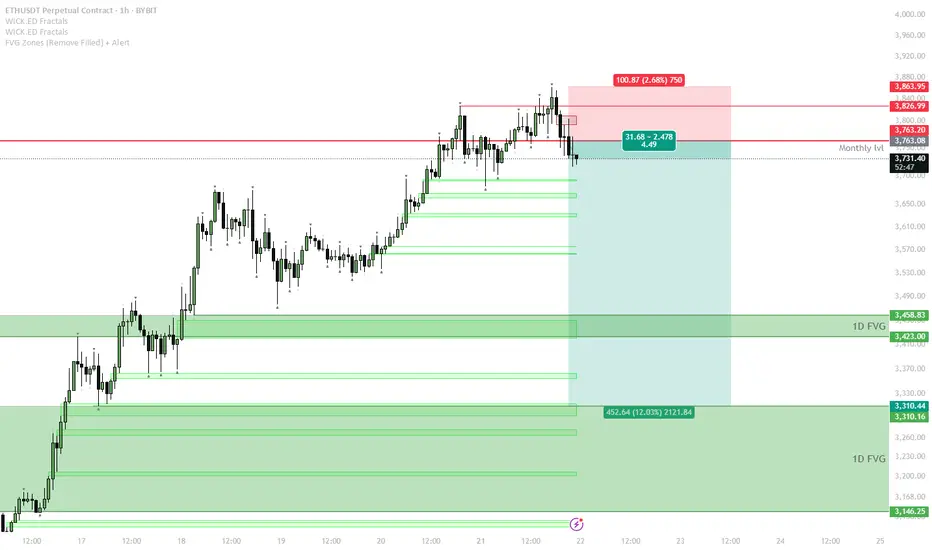
ETH Short Setup — Waiting for Range Formation After Parabolic Mo
The parabolic uptrend has broken, and ETH is testing the previous monthly resistance at $3,763.
If price fails to reclaim the monthly level and continues to range below it, expect a sideways range to form between $3,760–$3,850 (red box) and local support zones.
The short trigger is a sweep of the range high (top of the red box) followed by rejection or failure to hold above $3,850.
If price confirms a failed sweep, a short position can target the 1D FVG zone around $3,460, with the next possible target at $3,310.
Invalidation: A strong reclaim and acceptance above $3,850 invalidates the short idea — switch to neutral or bullish bias in that case.
The setup follows a classic pattern after a parabolic run: momentum stalls, a range forms, and liquidity is swept at the range top before a correction. Sellers are likely to step in if price fails to establish new highs above the red zone. Downside targets align with major FVGs and previous breakout areas, providing logical levels for profit-taking.
PUMP Trend Reversal – Testing 1H Supply FlipStep-by-step Price Scenario:
Price has broken the local downtrend and reclaimed the 1H supply zone, showing LTF strength.
Look for acceptance above 0.00445–0.00452 green zone for confirmation of the reversal.
If price holds above this zone, expect a move toward the next supply levels at 0.0048, then 0.0050, and 0.0054.
If price loses the green zone (close below 0.00436), scenario is invalidated—look for a retest of the previous lows near 0.00394.
Reasoning:
After a strong local downtrend, price has started to show reversal signs with a clear break and reclaim of the 1H supply zone. This area previously acted as resistance and now flipped to support, signaling the potential for a short-term rally. If buyers manage to hold above this new support, it would confirm the strength of the reversal and open up the path to test the next local supply zones above. However, failure to hold the reclaimed level (close below 0.00436) would invalidate this scenario and suggest the downtrend may continue. This setup is based on a classical supply/demand flip and early signs of bullish momentum on lower timeframes.

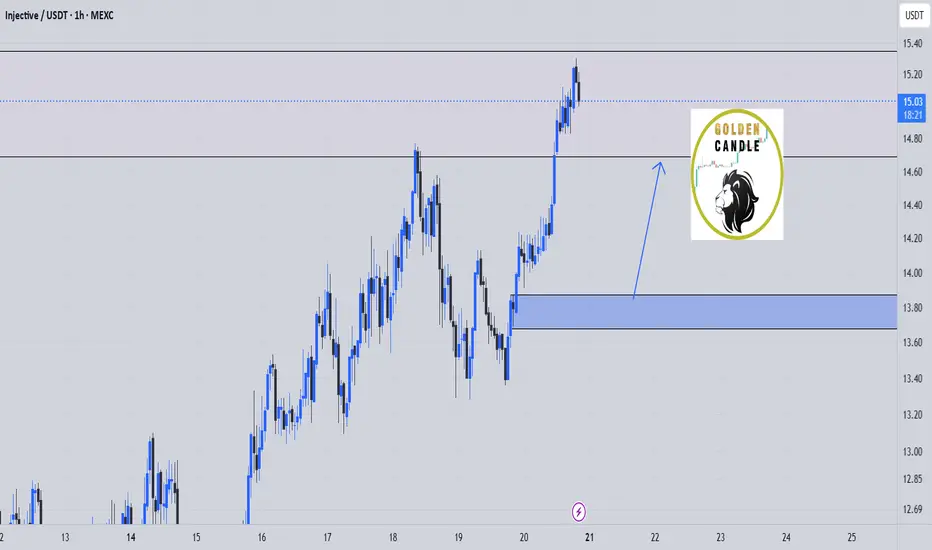
inj buy midterm"🌟 Welcome to Golden Candle! 🌟
We're a team of 📈 passionate traders 📉 who love sharing our 🔍 technical analysis insights 🔎 with the TradingView community. 🌎
Our goal is to provide 💡 valuable perspectives 💡 on market trends and patterns, but 🚫 please note that our analyses are not intended as buy or sell recommendations. 🚫
Instead, they reflect our own 💭 personal attitudes and thoughts. 💭
Follow along and 📚 learn 📚 from our analyses! 📊💡"
BTC — Chop → Range Low Sweep → Range High1. Watch for push to range mids (119.4–121.3)
2. Anticipate move back to range low (115,750) — buy zone
3. Target range high (125,000) after sweep
If no sweep to RL — scenario invalid

30/06/25 Weekly OutlookLast weeks high: $108,531.02
Last weeks low: $99,592.69
Midpoint: $104,061.86
Overall a positive week for BTC in isolation as price moves steadily all week reclaiming the losses made in the week from the 16th-23rd June. This comes after a $2.2B BTC ETF weekly inflow, the 3rd consecutive week of net inflows.
Having now hit the key S/R level of $108,500 it will be interesting to see where BTC goes from here. Jumping up above the level will require a lot from the bulls as ATH is within touching distance and so buying into major resistance is a tough ask. We also have Geo-political uncertainties to add to the situation, one bad tweet is all it takes sometimes to do a lot of damage.
On the other hand the SNP500 hits new ATH in the same conditions and so BTC is more than capable of doing the same.
So far in the first hours of this weeks trading we do have a SFP of the weekly high setup, not ideal for the bulls in any way and so from here the a retest of the range quarters, midpoint being the key area would make sense, invalidation would be a clean break above weekly high with acceptance and strong volume on the move to break the rangebound/choppy environment.
There is also the "window dressing" element to the months &quarter end today. History shows a de-risking going into these events and more money flowing back into risk-on assets in the days following monthly/ quarterly end. For that reason a bullish move (if there were to be one) would come later in the week IMO.
Good luck this week everybody!

BTC Short from H1 FVG + H4 OB Confluence — Risky Setup✅ Price in strong supply confluence (H1 FVG + H4 OB)
✅ SFP & order block add to short case, but context is choppy
⚠️ Trade is low conviction, manage size and stops accordingly
Short Scenario:
Entry: In $107,500–$108,500 zone (confirmation from SFP/OB)
Target: $104,000–$105,000 (D1 FVG zone)
Stop: Above $108,500 or invalidate on strong reclaim
🔔 Triggers & Confirmations:
Look for reaction (SFP, rejection wicks) in FVG/OB zone before adding
Exit quick if invalidated or strong momentum up
🚨 Risk Warning:
Not a high conviction setup; use smaller position size and stay nimble

Bitcoin - Levels of the Range On the hourly time frame it is clear that BTC is within a rangebound environment. Using key levels such as the weekly highs and lows with Mondays highs and lows to to paint a picture of where support and resistance may be.
In the "weekly outlook" post for this week I suggested a retest of the $108,500 area, an orderblock that pushed prices lower and is notorious for protecting Stop losses of the shorts that pushed price lower, nearly instantly as the week starts we get that move to sweep the supply zone and stop hunt the short trades.
After a successful sweep the swing fail pattern typically follows when in a rangebound environment or absent of a trend. This structure plays out and the sell-off follows.
Price breaks through the Monday low with zero fight so momentum is with the bears in the low time frame. Should momentum continue the previous week low is @ $102,500 which is in line with HTF key level too.
RSI is also entering the oversold zone and in a rangebound environment can be when price reverses direction, as seen by the previous Monday High and Previous week low.
With FOMC just over 24 hours away volatility usually follows. No rate cut forecast however many think the interest rate should be brought down in line with inflation as the ECB has already done.
In conclusion, BTC is in a clear rangebound environment on the hourly time frame.
Stop loss hunt/supply zone sweep and then SFP, the LTF momentum is with the bears going into FOMC.
Next point of support at $102,500 (Previous week low) and could be boosted by the oversold RSI.
An FOMC rate cut should be bullish although currently thought to be unlikely.
