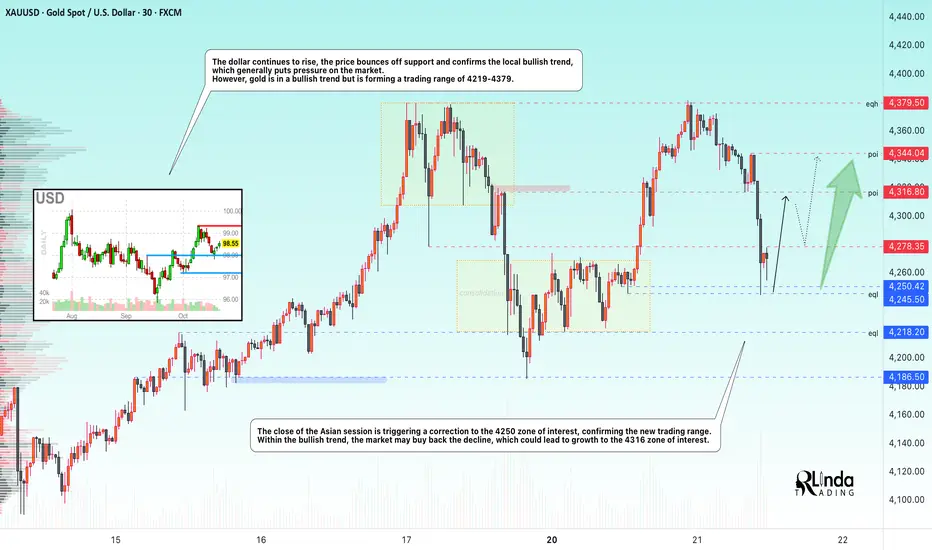
GOLD → The correction forms a trading range. Growth?FX:XAUUSD is adjusting to $4250 after retesting the all-time high of 4380. Short-term pressure is linked to hopes for an easing of the trade war between the US and China, but the bullish trend remains intact.
Key factors: Bentsen's meeting with the Chinese Vice Premier this week has revived optimism for a deal. The reduction in trade risks is temporarily supporting the USD. Hassett's statements about the imminent resumption of government work have reinforced risk-on sentiment.
Support for gold: The threat of tariffs rising to 155% from November 1 reminds us of the risks. Two rate cuts before the end of the year remain in focus. Friday's inflation data release and US corporate earnings reports are keeping demand for hedging alive.
Accordingly, the correction in gold is a temporary pause. The uptrend will remain unchanged as long as macro uncertainty persists.
Support levels: 4250, 4218
Resistance levels: 4278, 4316
Within the bullish trend, the price is forming a trading range. A retest of support could end in a recovery, with the fundamental background favoring the bulls. A retest of 4245 could trigger growth, as could a breakout of 4278 (closing above resistance).
Best regards, R. Linda!
Ascending Triangle
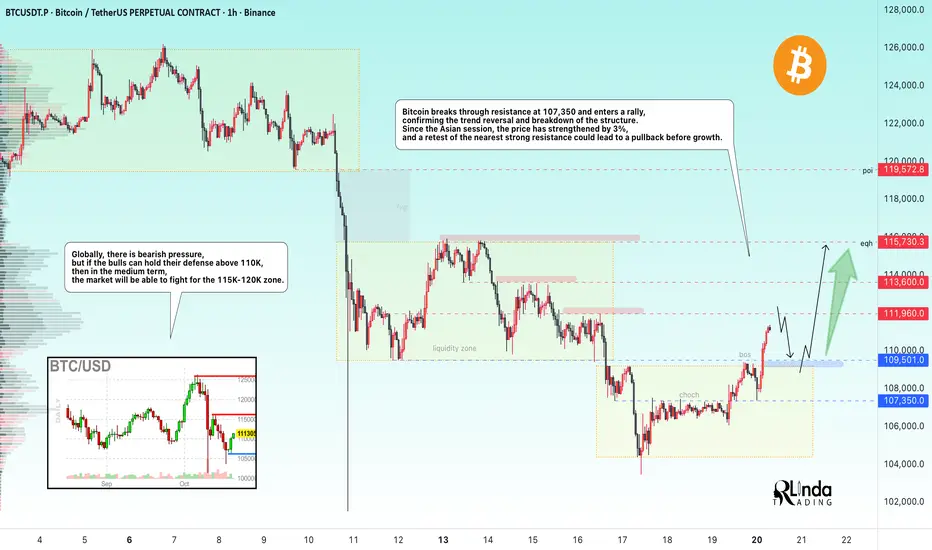
BITCOIN → Trend reversal. Is there a chance for growth?BINANCE:BTCUSDT.P is breaking the trend and local market structure, forming a rally. Giving hope to buyers, we see a strong reaction from the Asian session. Are the bulls returning?
The fundamental background is unstable; if Trump continues to escalate the trade war, the cryptocurrency market may close within the range. However, technically, we have positive signs of a bull market. BTC is breaking through the resistance level of 107,350 and entering a rally, which only confirms the change in trend and the breakdown of the structure. Since the Asian session, the price has strengthened by 3%, and a retest of the nearest strong resistance at 112K-113.6K could lead to a pullback before growth.
Globally, there is bearish pressure, but if the bulls can hold their defense above 110K, then in the medium term, the market will be able to fight for the 115K-120K zone.
Resistance levels: 111960, 113600, 115730
Support levels: 109700, 109200
In the short term, I expect a false breakout of the specified resistance and a correction of 1/2 of the local impulse, i.e., a retest of the 110K - 109200 support zone, which, in turn, could lead to another bullish run to 115K - 120K.
Best regards, R. Linda!

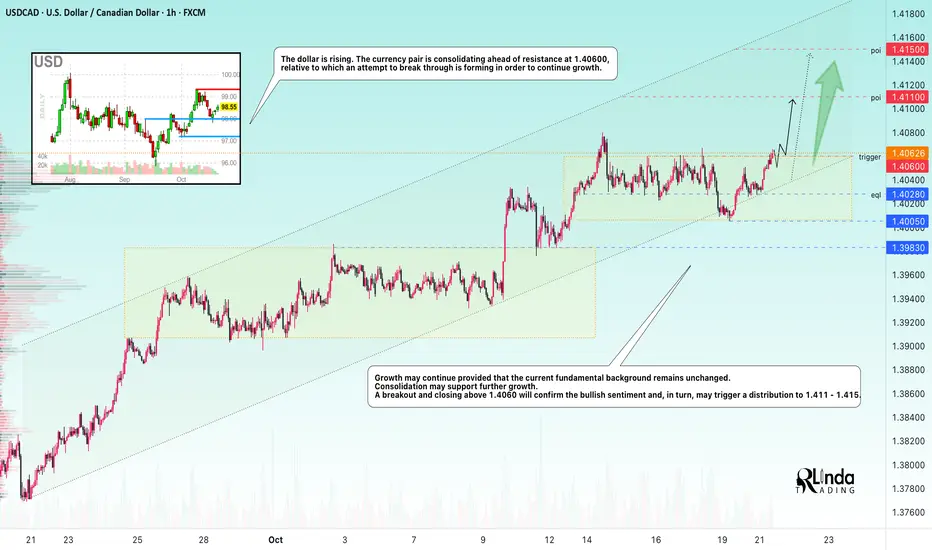
USDCAD → Attempt to break through resistance to continue growth FX:USDCAD is attempting to break through consolidation resistance within an uptrend. Growth in the dollar index may support the current trend.
The dollar is rising. The currency pair is consolidating ahead of resistance at 1.40600, against which it is attempting to break through in order to continue growing.
The growth may continue if the current fundamental background remains unchanged. Consolidation may support further growth. A breakout and closing above 1.4060 will confirm the bullish sentiment and, in turn, may trigger a distribution to 1.411 - 1.415.
Resistance levels: 1.4060
Support levels: 1.4028, 1.4005
The trend is bullish, with virtually no pullback after the growth, only consolidation, which is technically a positive sign. A breakout of the specified consolidation resistance could trigger distribution to areas of interest.
Best regards, R. Linda!
GOLD → Fundamental background boosts interest FX:XAUUSD is recovering after a correction, trading in the range of 4060-4120 amid geopolitical tensions and risks of an escalating trade war.
Key supporting factors: New threats from the US against China, which is responding with additional measures. Trump imposed sanctions against Russian oil companies, accusing Moscow of lack of progress on Ukraine. US inflation data (CPI) on Friday may cause volatility, although the Fed's rate cut next week is likely already priced in.
The meeting between Trump and Xi Jinping next week remains uncertain.
Gold remains a safe haven, but near-term dynamics depend on the balance between dollar strength and geopolitical risks.
Resistance levels: 4116, 4163, 4200
Support levels: 4082, 4060, 4002
A retest of support at 4082-4060, as well as a breakout of resistance at 4116, could trigger a bullish reaction—a rise to the resistance level or imbalance zones. Against the backdrop of the escalating trade war, gold is becoming attractive again.
Best regards, R. Linda!

EURCAD → Retest of liquidity pool before growth FX:EURCAD is forming a correction to the key liquidity zone amid a global and fairly strong bullish trend. Will the bulls enter the game in the 1.6173 zone?
The euro is forming a correction to the strong support zone of 1.16, which is provoking a decline in the currency pair. The key area that the currency pair is striving for is 1.6173. The trend is bullish. A reaction from the bulls is possible...
A false breakout of resistance is forming a correction. However, the price is still within the trading range of 1.64 - 1.6173. The price is heading towards support for a retest, and the indicated zone is likely to stop the correction...
Resistance levels: 1.633, 1.64
Support levels: 1.6173, 1.603
A liquidity pool below 1.62 - 1.617 could change the game in favor of buyers. Remember, the trend is bullish, and this will be a clear advantage for players. A false breakdown of support and the absence of a downward momentum could trigger growth.
Best regards, R. Linda!

Perfect time to get them bollingers tightBands a maker her dance ?
Earnings make her dance?
Whos dancing , us after earnings ?
Lets go sofi!! Here for long since 20-21$ not options trading
Im feeling spicy and i think we see 32.50-35$ upon good earnings next week. Potentially before depending how much volume is FOMOING

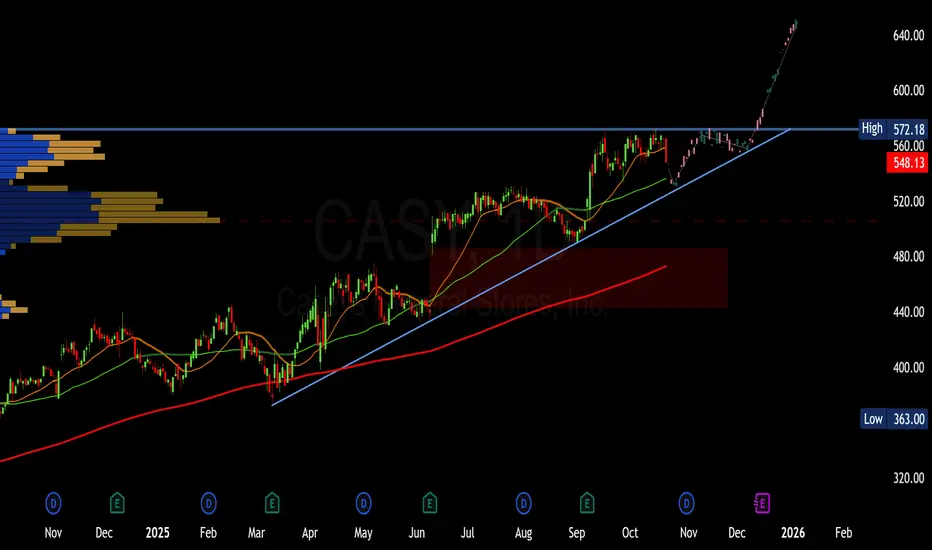
CASY Casey's potential ascending triangleNASDAQ:CASY Casey's is forming a potential ascending triangle, with higher lows (~$540–$550) and resistance at $580–$600. Bullish momentum (RSI ~65, positive MACD) suggests a breakout above $600 could target $620–$650 as Q2 earnings approach in December. A pullback to the $445–$480 gap offers a strong entry point for longs. Watch volume and earnings catalysts! Casey's General Stores, Inc. operates approximately 2,900 convenience stores in 19 states.
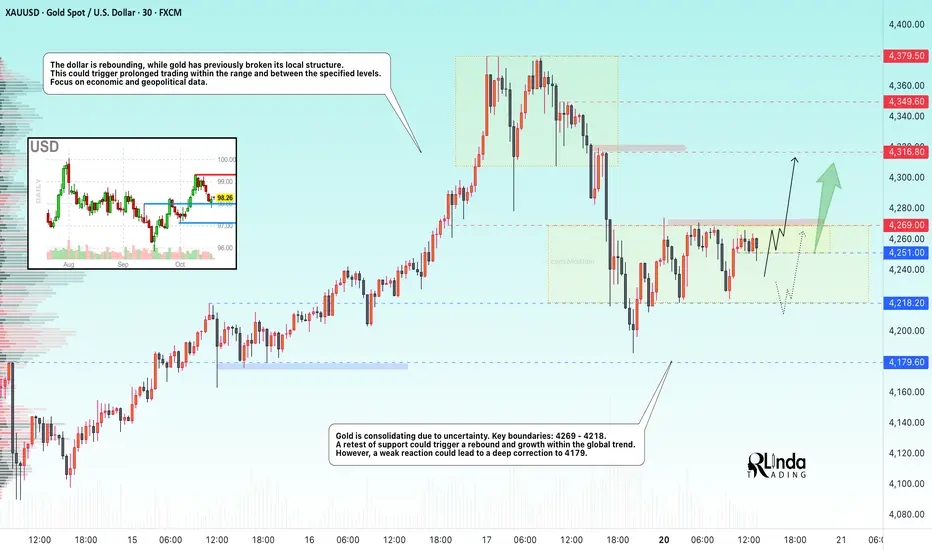
GOLD → Consolidation. 4269 - trigger. Chances for growth?Gold is consolidating due to uncertainty. On Friday, the market broke its local structure, which slightly changed sentiment. Focus on current consolidation.
Key drivers of the week: Trump's threat to impose 100% tariffs on Chinese imports and China's response supported demand for safe havens. Problems with regional banks (Zions, Western Alliance) and the fall in Treasury bond yields below 4% increased the inflow into gold. Powell maintained a neutral tone, but markets are expecting two rate cuts in 2024.
All eyes are on inflation data, US-China negotiations, developments between Russia, the US, and China; any de-escalation of the situation could trigger a correction.
Technically, the upward trend in gold remains relevant. Corrections will be bought up as long as uncertainty surrounding trade policy, the banking sector, and the Fed's monetary policy persists.
Resistance levels: 4269, 4316
Support levels: 4251, 4218
At the moment, a pre-breakout base is forming around 4269. If the structure remains intact and the price continues to attack resistance, the chances of a breakout and growth will be high. Otherwise, a close below 4251 could trigger a retest of 4218.
Best regards, R. Linda!
GOLD → Positive backdrop. Consolidation before growth?FX:XAUUSD is consolidating after a shake-down in the Asian and Pacific sessions. The price hit a new low of 4278, but bulls are aggressively buying up two liquidations (manipulation?). The metal is preparing for its ninth consecutive week in positive territory, with an 8% increase over the week.
Key drivers: Fed members confirmed their readiness to cut rates in October and pointed to risks for the labor market. The situation with the trade war between China and the US is still tense.
However, negotiations between the presidents of three countries on the conflict in Eastern Europe have raised hopes for de-escalation, which has temporarily reduced demand for defensive assets. The shutdown continues, which supports the price of gold.
The correction in gold is a temporary pause, and any decline will be used for purchases.
Technically, the focus is on the global trading range of 4280-4380, with consolidation within 4350-4330. A breakout of the accumulation zone could trigger a move in the direction of the breakout
Resistance levels: 4350, 4380
Support levels: 4320, 4300, 4280
Technically, before rising, the price may test the liquidity zone located below the specified support zones. However, it is also worth watching the 4350 trigger—a breakout of resistance and a close above this level could trigger continued growth within the current bullish trend.
Best regards, R. Linda!

GBPCAD → The hunt for liquidity ahead of growthFX:GBPCAD , after breaking through the resistance of the ascending triangle consolidation pattern and updating its high to 1.8915, is forming a correction to retest the zone of interest before continuing its growth
The British pound is forming an uptrend, which supports the price of the currency pair.
The currency pair is forming a breakout of resistance. After updating the maximum, the price is rolling back to retest the previously broken consolidation border. Liquidity capture relative to 1.8825 - 1.8807 could lead to a shift in the imbalance towards buyers and provoke continued growth.
Resistance levels: 1.8915
Support levels: 1.8825, 1.8808
If, during the retest of support, the bulls keep the price above this zone, then the chances of a reversal and growth will be high. 1.8915 - 1.900 can be considered as a potential target.
Best regards, R. Linda!

GOLD → The aggressive trend continues. Focus on 4240FX:XAUUSD continues to break records, testing the $4,240 level amid a weakening dollar and sustained demand for safe-haven assets. The risks of a correction are growing as economic news releases approach.
Key supporting factors: Statements by US officials about China's “seizure of supply chains” and retaliatory measures are keeping markets on edge. US shutdown: The government shutdown is costing the economy $15 billion a week, increasing uncertainty. The probability of a rate cut in October and December is ~95%, which is putting pressure on the dollar. However, statements by Fed officials may adjust market expectations.
The bullish trend for gold remains unchanged. Any corrections will be seen as a buying opportunity. Key benchmarks are the development of the trade conflict and negotiations on the resumption of the US government.
Support levels: 4212, 4203
Resistance levels: 4234, 4235, 4250
Within the uptrend, it is worth waiting for a correction to support in order to open positions more profitably. There are no reasons for a trend reversal, and the fundamental background is bullish. We expect a retest of support before growth. However, a breakout of the 4234-4239 zone could trigger further growth!
Best regards, R. Linda!

USDJPY → False breakout? Target - gap?FX:USDJPY faces trend resistance during its rally and enters a correction. A retest of the range boundary is forming, the breakdown of which may trigger a sell-off.
The currency pair's growth, linked to the news, is slowing down. The price is testing the range boundary as part of a pullback, and the bullish reaction is weakening. Wednesday's daily candle closed below 151.23, which generally indicates buyer uncertainty.
Accordingly, there is a struggle for the 150.85 - 151.23 area, and the price closing below the key support zone will bring the price into the range. This, in turn, may provoke the closure of the gap (149.0 - 147.55).
Resistance levels: 151.23, 151.73
Support levels: 150.85, 149.93, 149.0
A false breakout and consolidation in the selling zone is a fairly strong signal that indicates the strength of the seller. A decline in the dollar index may trigger a decline in the price of the currency pair.
Best regards, R. Linda!

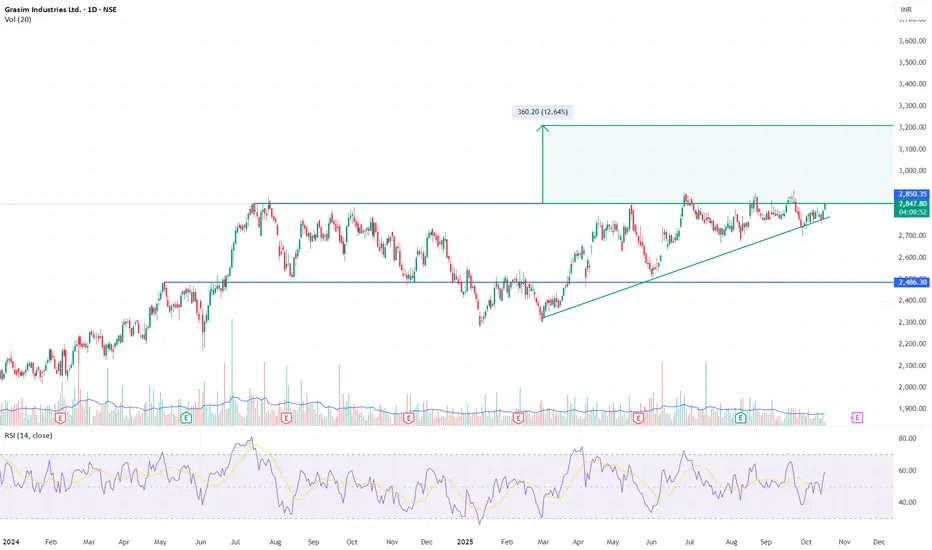
GRASIM – Base Pressure Building for Breakout Above ₹2,850Price has spent almost a year trapped between ₹2,480 and ₹2,850. Each dip since mid-2025 has formed higher lows, compressing against the same horizontal ceiling. Today’s candle closes right at ₹2,850 with RSI rising toward 60 — the structure is tightening for resolution.
A decisive close above ₹2,900 with strong volume will confirm breakout and open the path toward ₹3,200–₹3,250 (~12–13% measured move).
Setup: Ascending Triangle re-attempt
Entry Trigger: ₹2,900+ close with volume confirmation
Target Zone: ₹3,200–₹3,250
Support: ₹2,700
Invalidation: ₹2,680
Price has respected this structure for nearly a year; compression is mature, volatility contraction visible, and the next move should define direction.
Disclaimer: Not a recommendation. For educational purposes only.
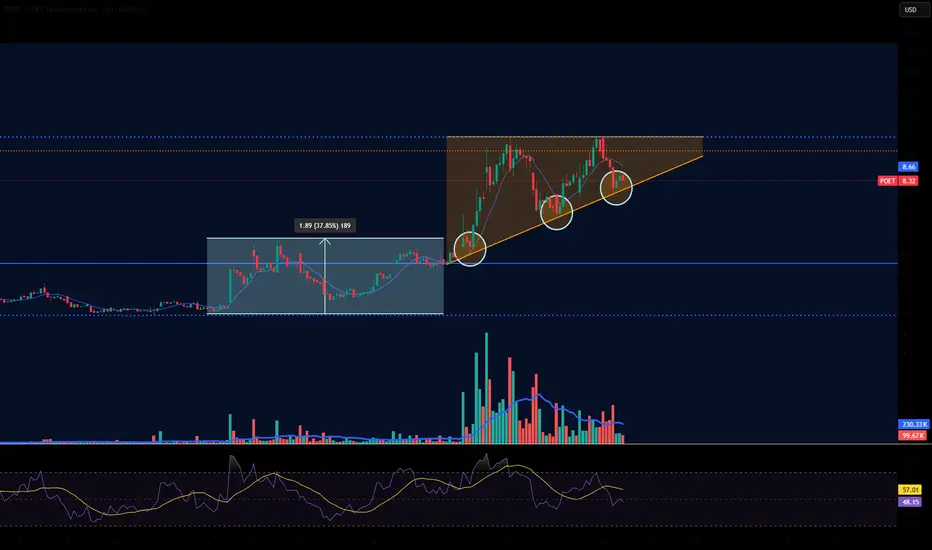
POET: Ascending Triangle Forming – Prime Bullish SetupWe’re seeing a classic ascending triangle pattern taking shape, which is one of the most reliable bullish signals in technical analysis. The pattern features a series of higher lows, showing building buyer support and increasing momentum, while the highs remain flat around the $8.66 resistance level (aligned with the SMA). This compression typically leads to a breakout to the upside once volume picks up and we clear that overhead line – and with the recent price action circling in on it, I’m eyeing a potential move higher soon.
Zooming in on the details: The main chart highlights the triangle with the ascending support trendline connecting those higher lows, and the flat resistance creating the “ceiling.” Volume is holding steady at around 99K-230K, with a spike in the lower pane suggesting interest is brewing. RSI is neutral around 48-57, not overbought yet, leaving room for upside without immediate pullback risk. If we break above $8.66, next targets could be $9.50 or even $10 in the short term, based on the pattern’s measured move.
Fundamentally, POET is firing on all cylinders. They just closed a massive $75 million private investment round to fuel growth in AI connectivity solutions. In an industry that’s notoriously power-hungry (think data centers and AI hardware sucking down energy), POET’s unique photonics tech offers efficient optical interconnects that cut power consumption while boosting speed. This positions them perfectly for the AI boom, and the funding news has already injected fresh momentum – shares are up, but there’s plenty more room to run.
GOLD → After the pullback, growth may continue. 4250 - 4300?FX:XAUUSD continues to break records, approaching the $4,200 level amid escalating trade tensions and expectations of Fed policy easing. A correction is forming before the possible continuation of growth...
Key growth drivers: Trump is considering a ban on Chinese vegetable oil imports, and the parties are imposing reciprocal port fees. The probability of a Fed rate cut in October and December exceeds 90%, despite Powell's cautious comments. The current correction in gold is seen as a buying opportunity.
Growth to $4250+ will continue if trade tensions persist and the Fed maintains its dovish rhetoric.
Resistance levels: 4200, 4218, 4250
Support levels: 4179, 4166, 4155
A pullback is forming. A false breakdown of the specified support zone could support further growth, provided that the bulls hold their defense above the specified levels. The market remains bullish and aggressive, and there are currently no technical or fundamental reasons for a deep correction
Sincerely, R. Linda!

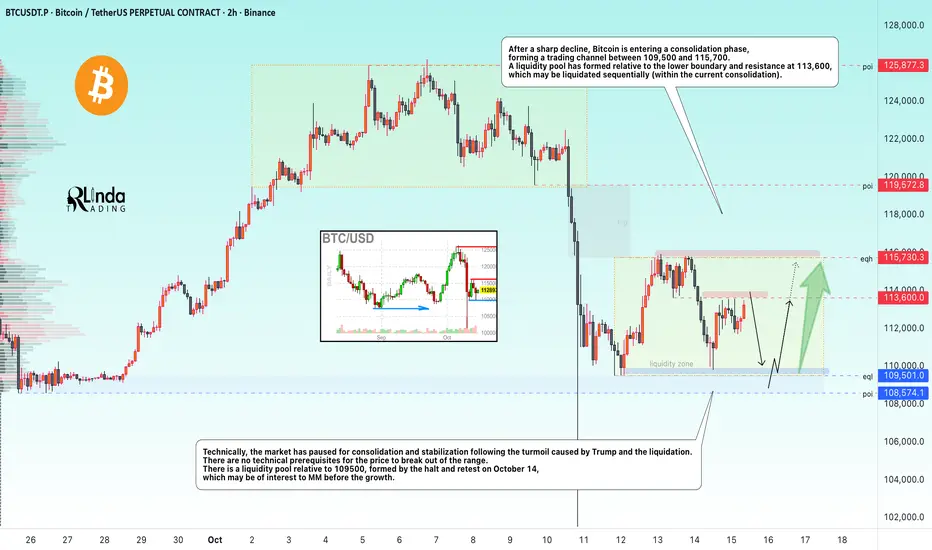
BITCOIN → Consolidation in the medium term. Focus on 109,5KBINANCE:BTCUSDT.P is forming a trading range after a sharp decline. Each distribution is followed by consolidation before the next distribution. Market phases in all their glory
After a sharp decline, Bitcoin is entering a consolidation phase, forming a trading channel of 109,500-115,700. A liquidity pool has formed relative to the lower boundary and resistance at 113600, which can be liquidated in turn (within the current consolidation).
Technically, the market has paused for consolidation and stabilization of the situation provoked by Trump and the liquidation. There are no technical prerequisites for the price to break out of the range. There is a liquidity pool relative to 109500, formed by the halt in the decline on October 11 and the retest on October 14, which may be of interest to MM before the growth.
Support levels: 109500, 108500
Resistance levels: 113,600, 115,730
Classic consolidation, the boundaries of which have not yet been tested. Possible false maneuvers relative to the specified levels to form a large MM position before moving in one direction or another in the medium term. Major players are still uncertain about further movement due to Trump's activism and his tariff strategy, which creates additional risks, and for this reason, I would not expect strong growth beyond the specified boundaries for now.
Sincerely, R. Linda!
GOLD → Correction to 4090. What could this mean?FX:XAUUSD , after updating its high to 4180, formed a correction and descended to the support zone of 4090, forming an intermediate bottom. We have a trading range...
Key drivers: China has introduced controls on rare earth metal exports, and the parties are holding consultations. A meeting between Trump and Xi Jinping is scheduled for the end of October.
Expectations of two rate cuts before the end of the year are strengthening gold's position. The ongoing government shutdown is fueling demand for safe-haven assets.
Today, attention is focused on Powell's speech, which could set the tone for the market.
The bullish trend for gold continues. The absence of bearish factors and ongoing macro risks continue to push the price up. Corrections are seen as an opportunity to buy.
Resistance levels: 4150, 4180
Support levels: 4117, 4090, 4059
The price is testing the 4150 liquidity zone, which could trigger a pullback within the range. A retest of support at 4117-4090 could support the market, and a change in imbalance could lead to another rally to 4180 - 4200
Best regards, R. Linda!

GOLD → Ready for continued growth. Target 4100 - 4125FX:XAUUSD remains above $4,000, starting the week with a record high amid the escalating trade war between the US and China. Traders bought up all of last week's decline.
Key drivers: Trump's new tariffs: Introduction of 100% tariffs on all Chinese goods and export controls on software from November 1. China is not sitting idly by: Restrictions on exports of rare earth metals and technologies.
The ongoing shutdown and trade uncertainty are weakening the dollar.
US inflation data (CPI on October 24) will be the first key release after the shutdown.
Speeches by Fed officials may adjust rate expectations.
Gold remains in an uptrend, but momentum will depend on the progress of trade negotiations. A breakout to new highs is likely if tensions remain high.
Resistance levels: 4078, 4100, 4110
Support levels: 4059
A breakout of 4078 and a close above the key level could trigger a continuation of the growth to 4100. An additional scenario could be a correction to 4059 before further growth to 4100-4125.
Best regards, R. Linda!

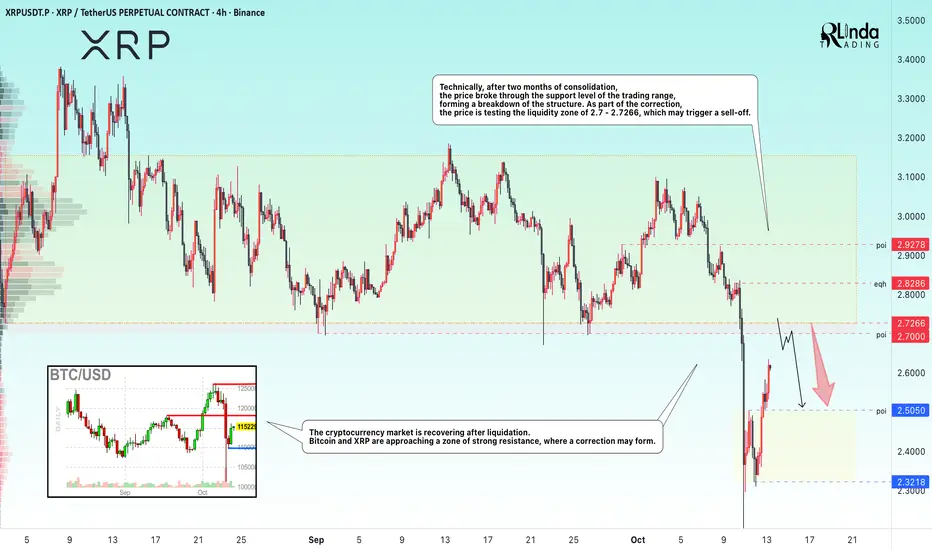
XRPUSDT → Resistance at 2,700 could trigger a correction BINANCE:XRPUSDT is forming a correction after a strong sell-off. It is not yet worth hoping for strong growth without pullbacks, as there is a strong resistance zone ahead.
The cryptocurrency market is recovering after liquidation. Bitcoin and XRP are approaching a strong resistance zone, where a correction may form.
Technically, after two months of consolidation, the price broke through the support of the trading range, forming a breakdown of the structure. As part of the correction, the price is testing the liquidity zone of 2.7 - 2.7266, which may trigger a sell-off.
Resistance levels: 2.7 - 2.7266, 2.8286
Support levels: 2.505
A sharp rise and the lack of technical potential to break through the resistance level of 2.70 may trigger a false breakout and a correction to the support level of 2.5050.
Best regards, R. Linda!
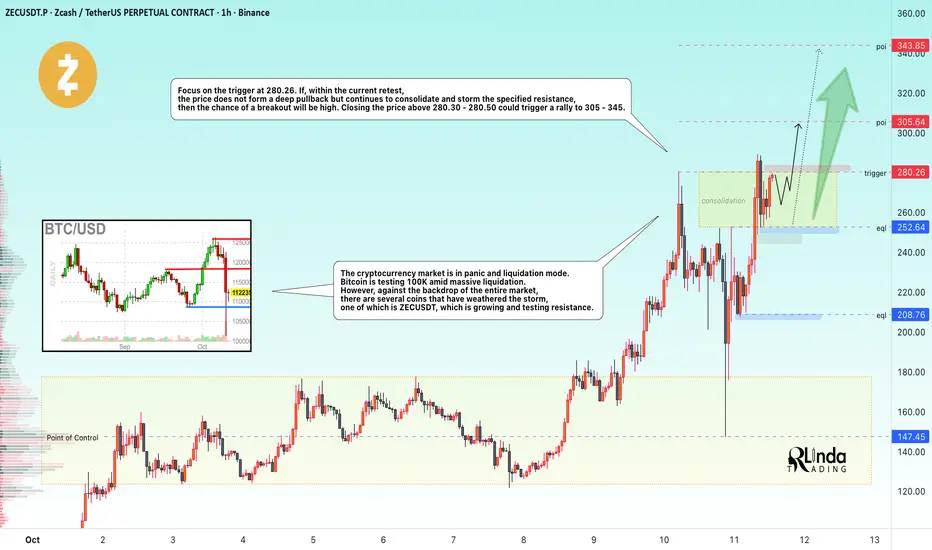
ZECUSD → The altcoin exception that is growingBINANCE:ZECUSDT withstood the blow of the global decline that affected the entire cryptocurrency market, liquidating long positions worth $10 billion. But even in such a situation, there can be exceptions ;)
The cryptocurrency market is in panic and liquidation. Bitcoin is testing 100K amid massive liquidation. However, against the backdrop of the entire market, there are several coins that have withstood the blow, one of which is ZECUSDT, which is growing and testing resistance
ZEC was also hit by the decline, but after testing the control point in the area of maximum volume density 145-155, the market aggressively and quickly bought up the altcoin, indicating bullish strength at the moment.
Resistance levels: 280.30, 305.65
Support levels: 242.64, 208.76
Focus on the trigger at 280.26. If, during the current retest, the price does not form a deep pullback but continues to consolidate and storm the specified resistance, then the chance of a breakout will be high. A closing price above 280.30 - 280.50 could trigger a rally to 305 - 345.
Best regards, R. Linda!
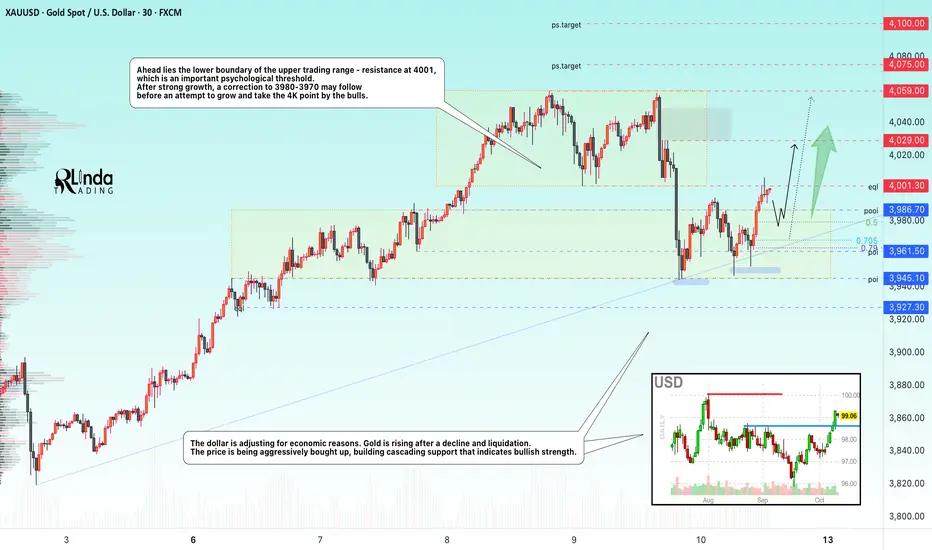
GOLD → Retest 4000. Pullback before a breakout and rise to 4100?FX:XAUUSD , after a sharp sell-off and testing of the 3950 support zone, is aiming to return to the $4000 level on Friday, preparing for its eighth consecutive week in positive territory.
The Senate adjourned for the weekend until Tuesday, postponing a decision on the shutdown. John Williams supported further rate cuts, Mary Daly confirmed her readiness for cuts, despite the fact that Powell did not say anything particularly interesting about policy on Thursday.
The upward trend in gold remains unchanged. The potential for growth to new highs remains, provided the shutdown continues and the Fed maintains its soft policy. The $4000 level remains a key psychological support.
Resistance levels: 4000, 4059, 4075
Support levels: 3986, 3980, 3968
The 4000 zone may prove to be strong resistance, so expect a battle (consolidation or trading range in this zone), during which the price may form a pullback to 3980-3970 before returning to 4K for a breakout attempt.
Best regards, R. Linda!
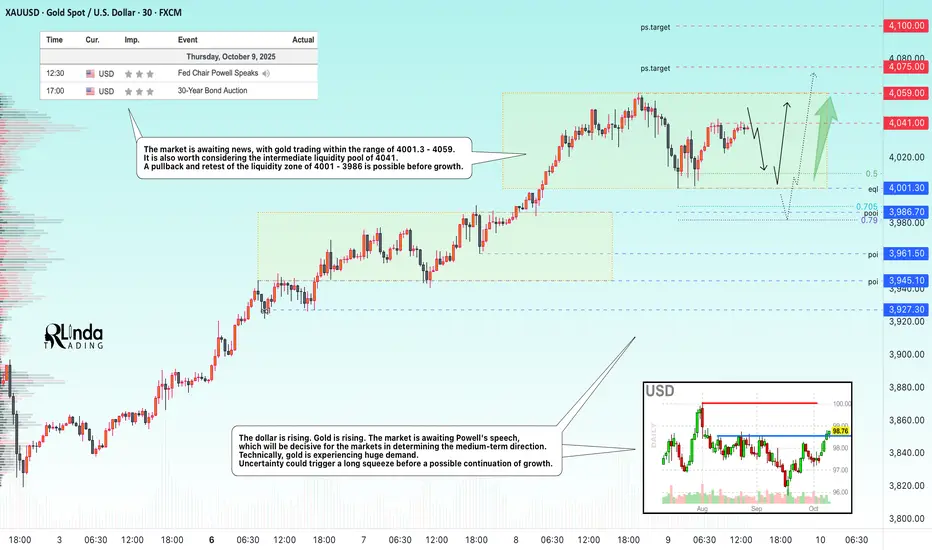
GOLD → The correction will provide a good opportunity for longFX:XAUUSD remains above the psychologically important level of $4,000, having corrected from a record high of $4,059. The market is awaiting Powell's speech, which could set the medium-term tone for the markets...
Key supporting factors: Uncertainty over the shutdown: The phased reopening plan has not yet been approved, which is keeping demand for safe-haven assets high.
Expectations of Fed easing: The probability of a rate cut in October is 100%, and in December is 80%, despite disagreements within the Fed.
As prices rise, the risks of a correction increase, especially against the backdrop of the Fed chair's speech.
Gold remains in a bullish trend. A correction to $4,000 looks like a healthy pause. Further dynamics depend on the Fed's tone and developments with the shutdown — a break below $4,000 is unlikely without new fundamental reasons.
Resistance levels: 4041, 4059, 4100
Support levels: 4001, 3986
Technically, gold has been rising without pullbacks for 35 days. The growth amounted to more than 22%. Accordingly, the market may form corrections, pullbacks, or consolidations within local timeframes. News may provoke such corrective maneuvers before the main movement. I consider the support levels of 4000 - 3986 - 3961 to be areas of interest. A retest or false breakdown could trigger a rebound and growth.
Best regards, R. Linda!