AUDUSD Will Go Down!
HI,Traders !
#AUDUSD already made a
Retest of the horizontal
Level of 0.66145 from where
We are already seeing a
Bearish reaction so we
Will be expecting a
Further bearish move down !
Comment and subscribe to help us grow !
Audusdtrade

AUD/USD Holds Firm, More Upside Moves On The Way?Market Analysis: AUD/USD Holds Firm, More Upside Moves On The Way?
AUD/USD started a fresh increase above 0.6550 and 0.6575.
Important Takeaways for AUD USD Analysis Today
- The Aussie Dollar started a decent increase above 0.6575 against the US Dollar.
- There is a key declining channel forming with resistance at 0.6615 on the hourly chart of AUD/USD.
AUD/USD Technical Analysis
On the hourly chart of AUD/USD the pair started a fresh increase from 0.6520. The Aussie Dollar was able to clear 0.6550 to move into a positive zone against the US Dollar.
There was a close above the 0.6575 resistance and the 50-hour simple moving average. Finally, the pair tested 0.6630. A high was formed near 0.6628 and the pair recently started a consolidation phase. There was a minor decline below 0.6600.
There was a move below the 23.6% Fib retracement level of the upward move from the 0.6520 swing low to the 0.6628 high. On the upside, the AUD/USD chart indicates that the pair is now facing resistance near 0.6615 and a key declining channel.
The first major hurdle for the bulls might be 0.6630. An upside break above 0.6630 might send the pair further higher. The next stop is near 0.6650. Any more gains could clear the path for a move toward the 0.6700 handle.
On the downside, initial support is near the 50% Fib retracement at 0.6575. The next area of interest could be 0.6545. If there is a downside break below 0.6545, the pair could extend its decline toward the 0.6520 zone. Any more losses might signal a move toward 0.6500.
This article represents the opinion of the Companies operating under the FXOpen brand only. It is not to be construed as an offer, solicitation, or recommendation with respect to products and services provided by the Companies operating under the FXOpen brand, nor is it to be considered financial advice.

AUD/USD Price Outlook – Trade Setup📊 Technical Structure
OANDA:AUDUSD AUD/USD is consolidating around the 0.6600 handle, finding interim support near the 0.6572–0.6582 zone. The pair remains in a medium-term uptrend, supported by a rising trendline, and the current pullback appears corrective. A rebound from the support zone could see the pair retest the 0.6669–0.6680 resistance area.
🎯 Trade Setup
Entry: 0.6572 – 0.6582 (near support)
Stop Loss: 0.6564
Take Profit: 0.6680
Risk-to-Reward: ~1 : 5.41
🗝️ Key Technical Levels
Resistance Zone: 0.6669 – 0.6680
Support Zone: 0.6572 – 0.6582
Trendline Support: rising from 0.6500
🌍 Macro Background
The Australian Dollar remains under modest pressure after mixed domestic data: the AiG Industry Index improved but stayed in contraction and the Manufacturing PMI eased to 51.4. The Reserve Bank of Australia (RBA) kept rates at 3.6%, noting inflation remains contained for now, but signalled no clear forward guidance until November. On the US side, the looming government shutdown and expectations of a Fed rate cut in October (97% priced in) keep the US Dollar subdued, limiting AUD downside. If US data disappoints this week, AUD/USD could gain traction toward the resistance area.
📌 Trade Summary
AUD/USD is showing buying potential from the support zone near 0.6582, with upside room toward 0.6680. The setup favours a long position, backed by trendline support and dovish Fed expectations.
⚠️ Disclaimer
This analysis is for reference only and does not constitute trading advice. Trading involves significant risk, and proper risk management is essential.

AUD/USD Technical Roadmap – From TMA Pullback to Resistance Zone🦘 The Aussie Heist: AUD/USD Wealth Strategy Map (Swing/Day Trade) 💰
Asset: AUD/USD ("The Aussie")
Vibe: Bullish breakout with a cheeky thief-style layered entry! 😎
📜 The Master Plan: Stealing Profits with Style!
We’re cooking up a bullish setup on AUD/USD with a thief-inspired swing/day trading strategy. Here’s the blueprint to nab those pips:
✅ Bullish Confirmation: A solid bullish pan formation, backed by a Triangular Moving Average (TMA) pullback.
✅ Heikin Ashi Power: Bullish Heikin Ashi candles screaming, "The trend is your friend!"
✅ Double Bottom Setup: A classic double bottom on the TMA pullback, giving us that extra confidence to strike.
🕵️♂️ Entry: The Thief’s Layered Heist
This is where the Thief Strategy shines! We’re using a layered entry approach with multiple buy limit orders to sneak into the market like a pro. No single entry for us — we’re stacking the odds!
Buy Limit Layers:
🎯 0.65700
🎯 0.65800
🎯 0.65900
🎯 0.66000
Pro Tip: Feel free to add more layers based on your risk appetite — the more, the merrier! Just keep it calculated, you sly fox. 🦊
Note: You can enter at any price level within this range if you spot a good opportunity. The thief’s motto? Strike when the market’s distracted!
🛑 Stop Loss: The Thief’s Escape Plan
Set your Stop Loss at 0.65500 to keep the cops at bay.
Disclaimer: Dear Ladies & Gentlemen (Thief OGs), this SL is my suggestion, but it’s your heist! Adjust it to your risk tolerance and protect your loot. 💼
🎯 Target: Dodging the Police Barricade
Our profit target is set at 0.66800, where we expect a strong resistance zone (aka the police barricade), potential overbought conditions, and a sneaky trap for the bulls.Escape Plan: Lock in profits before the market turns on you!
Note: Thief OGs, this TP is my take, but you’re the boss of your trades. Take profits at your comfort level and run with the cash! 💸
🔍 Related Pairs to Watch
Keep an eye on these correlated forex pairs (all in USD) to spot potential confirmations or divergences:
OANDA:NZDUSD : The Kiwi often moves in tandem with the Aussie due to their economic ties. Watch for similar bullish setups!
OANDA:USDCAD : An inverse correlation — if USD weakens, AUD/USD and NZD/USD may rally.
FX:EURUSD : A broader USD strength/weakness gauge. If EUR/USD is climbing, it could support our bullish AUD/USD bias.
Key Point: AUD/USD is sensitive to commodity prices (gold, iron ore) and risk sentiment. A strong bullish move in NZD/USD or a weakening USD across pairs could supercharge this setup!
⚡ Why This Setup Rocks
TMA Pullback: A reliable signal for trend continuation.
Heikin Ashi Confirmation: Filters out noise and keeps us on the bullish path.
Layered Entries: Spreads risk and maximizes entry opportunities.
Double Bottom: A high-probability reversal pattern for extra confidence.
This setup is designed for swing/day traders who love a calculated, fun approach to the markets. Let’s steal those pips together! 😜
✨ “If you find value in my analysis, a 👍 and 🚀 boost is much appreciated — it helps me share more setups with the community!”
Disclaimer: This is a thief-style trading strategy crafted for fun and educational purposes. Trade at your own risk, and always use proper risk management. No financial advice here — just a playful take on market opportunities!
#TradingView #AUDUSD #ForexTrading #SwingTrading #DayTrading #ThiefStrategy #TechnicalAnalysis

AUDUSD Bearish Breakout!
HI,Traders !
#AUDUSD is going down
Now and the made
A bearish breakout of the
Key horizontal level
Of 0.65628 so we are locally
Bearish biased and we
Will be expecting a
Further bearish move down !
Comment and subscribe to help us grow !

AUD/USD Trims Gains, Will Bears Take Full Control?Market Analysis: AUD/USD Trims Gains, Will Bears Take Full Control?
AUD/USD failed to stay in a positive zone and declined below 0.6650.
Important Takeaways for AUD/USD Analysis Today
- The Aussie Dollar started a fresh decline from well above 0.6680 against the US Dollar.
- There is a connecting bearish trend line forming with resistance at 0.6610 on the hourly chart of AUD/USD.
AUD/USD Technical Analysis
On the hourly chart of AUD/USD, the pair struggled to clear 0.6700. The Aussie Dollar started a fresh decline below 0.6650 against the US Dollar.
The pair even settled below 0.6620 and the 50-hour simple moving average. There was a clear move below 0.6600. A low was formed at 0.6581 and the pair is now consolidating losses below the 23.6% Fib retracement level of the downward move from the 0.6706 swing high to the 0.6581 low.
On the upside, immediate resistance is near a connecting bearish trend line at 0.6610 and the 50-hour simple moving average. The next major hurdle for the bulls could be near 0.6645 and the 50% Fib retracement.
The main selling point could be 0.6660, above which the price could rise toward 0.6690. Any more gains might send the pair toward 0.6700. A close above 0.6700 could start another steady increase in the near term. In the stated case, the next key resistance on the AUD/USD chart could be 0.6750.
On the downside, initial support is near 0.6580. The next area of interest might be 0.6550. If there is a downside break below 0.6550, the pair could extend its decline. The next target for the bears might be 0.6500. Any more losses might send the pair toward 0.6420.
This article represents the opinion of the Companies operating under the FXOpen brand only. It is not to be construed as an offer, solicitation, or recommendation with respect to products and services provided by the Companies operating under the FXOpen brand, nor is it to be considered financial advice.

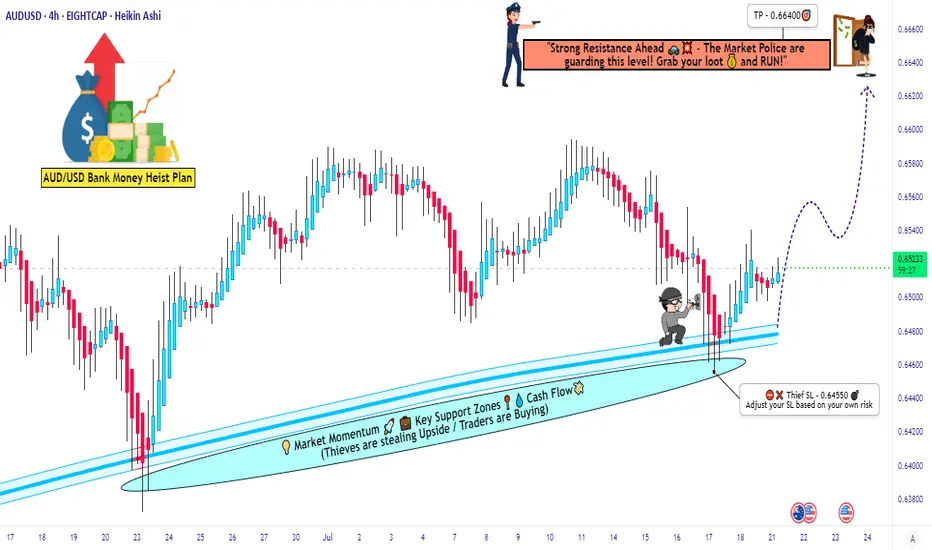
AUD/USD Heist: Bullish Loot Ready for the Taking?💵 AUD/USD "AUSSIE" Forex Bank Heist Plan (Swing/Day Trade) 🐨🔥
🌟Hi! Hola! Ola! Bonjour! Hallo! Marhaba!🌟
Dear Money Makers & Robbers, 🤑💰💸✈️
Based on the 🔥Thief Trading style technical & fundamental analysis🔥, here is our master plan to rob the Aussie Forex vault! 🏦💣
We’re pulling off a Bullish Heist on AUD/USD, and the doors are wide open! 🚪🔓
🎯 Entry (Loot Grab Point)
📈 “Any price level is a chance to rob the vault!”
Thief strategy = Layering multiple limit orders 🧩💎
Buy Limit Layers: 0.65000 / 0.65100 / 0.65200 / 0.65300
You can increase the limit layers based on your arsenal & bankroll 💼💵
🕵️ Remember, Thief OG’s never enter with one bullet – multiple shots, multiple loot bags.
🛑 Stop Loss (Police Patrol Spot)
This is the Thief SL 🚨 @ 0.64600
But… dear Thief OG’s, adjust SL based on your risk appetite & lot sizing strategy. 📉💼
We don’t all escape the same way 😉
🎯 Target (Escape Point)
⚠️ Police barricade spotted @ 0.66600 🚧👮
So we take our loot escape route at 0.66400 🏃💨💰 before they catch us!
📰 Thief Fundamental Reminder
📌 AUD/USD heist depends on Fed whispers, Aussie data releases & risk sentiment.
📌 Avoid new robberies during major news drops (NFP, CPI, RBA statements).
📌 Manage positions smartly: use trailing stops to lock in stolen profits 💼🔐.
💖 Supporting our robbery plan 💥Hit the Boost Button💥 will power up the Thief Crew! 🏆💪🤝❤️🎉🚀
Every day in this market, we rob smart, escape clean, and count profits like legends. 🤑🐱👤
⚠️ Disclaimer: This is a robbery plan, not financial advice. Follow at your own risk.
#AUDUSD #ForexHeist #ThiefTrader #LayeringStrategy #DayTrading #SwingTrading #ForexCommunity #BankHeistPlan #ForexSignals

AUDUSD Local Long!
HI,Traders !
#AUDUSD is trading in an
Uptrend and the pair is
About to retest a horizontal
Support of 0.65628 and as
We are locally bullish biased
We will be expecting a
Local bullish rebound !
Comment and subscribe to help us grow !

AUD/USD Rally Attempts, Will Buyers Stay in Charge?Market Analysis: AUD/USD Rally Attempts, Will Buyers Stay in Charge?
AUD/USD started a decent increase above 0.6580.
Important Takeaways for AUD USD Analysis Today
- The Aussie Dollar started a decent increase above 0.6545 against the US Dollar.
- There was a break above a contracting triangle with resistance at 0.6530 on the hourly chart of AUD/USD.
AUD/USD Technical Analysis
On the hourly chart of AUD/USD at FXOpen, the pair started a fresh increase from 0.6500. The Aussie Dollar was able to clear 0.6520 to move into a positive zone against the US Dollar.
The bulls cleared a contracting triangle with resistance at 0.6530. There was a close above the 0.6550 resistance and the 50-hour simple moving average. Finally, the pair tested 0.6585. A high was formed near 0.6588 and the pair recently started a consolidation phase.
There was a move below the 23.6% Fib retracement level of the upward move from the 0.6501 swing low to the 0.6588 high. On the upside, the AUD/USD chart indicates that the pair is now facing resistance near 0.6585.
An upside break above 0.6585 might send the pair further higher. The next stop is near 0.6640. Any more gains could clear the path for a move toward the 0.6700 handle.
On the downside, initial support is near the 50% Fib retracement at 0.6545. The next area of interest could be near the 50-hour simple moving average at 0.6535.
If there is a downside break below 0.6535, the pair could extend its decline toward the 0.6500 zone. Any more losses might signal a move toward 0.6485.
This article represents the opinion of the Companies operating under the FXOpen brand only. It is not to be construed as an offer, solicitation, or recommendation with respect to products and services provided by the Companies operating under the FXOpen brand, nor is it to be considered financial advice.

Australian Dollar Surges SharplyAustralian Dollar Surges Sharply
As illustrated by the AUD/USD chart, while the pair was trading near a two-month low at the start of Friday, today it has jumped by more than 1.1%.
The primary driver behind this rally is the weakening US dollar, which reflects the market’s reaction to Jerome Powell’s comments at the Jackson Hole Symposium. He stated that the risks of declining employment are rising. And if these risks materialise, it could happen very quickly. According to Reuters, this strengthens the likelihood of a Federal Reserve rate cut at its meeting next month.
At the same time, market participants are preparing for the release of Australia’s CPI data, scheduled for this Wednesday.
Technical Analysis of AUD/USD
On 14 August, we reviewed the dynamics of the Australian dollar and highlighted the following:
→ a descending channel was identified, with the AUD/USD chart signalling prevailing bearish sentiment;
→ the psychological level of 0.6500 was marked as critical.
Since then:
→ the pair broke through the support line S around 0.6500;
→ on Friday it dropped to a two-month low;
→ but today it is showing signs of strength.
What Could Happen Next?
Bearish outlook:
→ the pair remains within the descending channel;
→ low 5 continues the sequence of lower highs and lower lows;
→ the sharp rally in AUD/USD might prove to be an overly emotional reaction to the Fed Chair’s remarks.
Bullish outlook:
→ when forming low 5, the price fell only slightly below low 3. In SMC terminology, this can be interpreted as a bullish Liquidity Grab;
→ the black arrow indicates a long lower shadow – a sign that demand persisted over the weekend.
Price action suggests an attempt to test the resistance area formed by:
→ the 0.6500 level,
→ the QH line dividing the upper half of the channel into two quarters,
→ the bearish candle (marked with a red arrow), where selling pressure was previously aggressive, breaking support at S – meaning supply dominance may still remain to some extent.
If bulls manage to secure a foothold above 0.6500, this mght be interpreted as a significant shift in market sentiment in favour of demand. In the longer term, this could drive AUD/USD towards the upper boundary of the channel (with a possible breakout scenario).
This article represents the opinion of the Companies operating under the FXOpen brand only. It is not to be construed as an offer, solicitation, or recommendation with respect to products and services provided by the Companies operating under the FXOpen brand, nor is it to be considered financial advice.

Market Analysis: AUD/USD Starts Recovery, Key Hurdles AheadMarket Analysis: AUD/USD Starts Recovery, Key Hurdles Ahead
AUD/USD is attempting a fresh increase from 0.6415.
Important Takeaways for AUD/USD Analysis Today
- The Aussie Dollar found support at 0.6415 and moved higher against the US Dollar.
- There was a break above a key bearish trend line with resistance at 0.6440 on the hourly chart of AUD/USD.
AUD/USD Technical Analysis
On the hourly chart of AUD/USD, the pair formed a base above 0.6415. The Aussie Dollar started a significant increase above 0.6425 against the US Dollar to enter a short-term positive zone.
There was a break above a key bearish trend line with resistance at 0.6440 and the 23.6% Fib retracement level of the downward move from the 0.6568 swing high to the 0.6415 low. The pair even surpassed 0.6470 and settled above the 50-hour simple moving average.
On the upside, the AUD/USD chart indicates that the pair is now facing resistance near the 50% Fib retracement level at 0.6490. The first major hurdle for the bulls could be 0.6520.
An upside break above 0.6520 resistance might send the pair further higher. The next major target is near the 0.6540 level. Any more gains could clear the path for a move toward 0.6565. If there is no close above 0.6490, the pair might start a fresh decline.
Immediate support sits near the 0.6470 level. The next area of interest could be 0.6440. If there is a downside break below 0.6440 support, the pair could extend its decline toward 0.6410. Any more losses might signal a move toward 0.6350.
This article represents the opinion of the Companies operating under the FXOpen brand only. It is not to be construed as an offer, solicitation, or recommendation with respect to products and services provided by the Companies operating under the FXOpen brand, nor is it to be considered financial advice.

Australian Dollar Retreats from August HighsAustralian Dollar Retreats from August Highs
This week, forex traders’ attention is firmly on the AUD/USD market following key news releases from Australia:
→ Tuesday: Interest rate decision. According to ForexFactory, analysts’ forecasts were confirmed as the Reserve Bank of Australia (RBA) cut the cash rate from 3.85% to 3.60%.
→ Today: Labour market statistics revealed that the unemployment rate fell from 4.3% to 4.2%.
This dynamic fundamental backdrop has driven a rich technical setup on the AUD/USD chart, where bearish sentiment currently prevails.
Technical Analysis of the AUD/USD Chart
Since last month, AUD/USD price movements have been forming a descending channel (highlighted in red), and this week’s reversal from the August high reinforces its relevance.
Key factors emphasising the market’s bearish bias include:
→ Double top pattern formed by recent highs A and B. Notably, the long upper wicks of the candlesticks reflect increasing selling pressure.
→ The August upward move, marked by purple trendlines, may represent a corrective bear flag within the dominant downtrend.
→ Bearish RSI divergence – present not only between highs A and B, but also relative to the 7 July peak.
Potential Support Levels:
→ Lower purple trendline;
→ Line Q, which divides the upper half of the channel into two quarters;
→ The 0.65 psychological level – previously defended strongly by bulls, as evidenced by the wide bullish candle on 12 August, when price surged easily (a sign of buying imbalance).
These supports collectively form a key demand zone (shaded in purple). Bears will need significant momentum to break through this area and extend the prevailing downtrend in AUD/USD through August 2025.
This article represents the opinion of the Companies operating under the FXOpen brand only. It is not to be construed as an offer, solicitation, or recommendation with respect to products and services provided by the Companies operating under the FXOpen brand, nor is it to be considered financial advice.

Market Analysis: AUD/USD Much Higher—Uptrend Shows StrengthMarket Analysis: AUD/USD Much Higher—Uptrend Shows Strength
AUD/USD started a decent increase above the 0.6480 and 0.6500 levels.
Important Takeaways for AUD/USD Analysis Today
- The Aussie Dollar started a decent increase above the 0.6450 level against the US Dollar.
- There is a connecting bearish trend line forming with resistance at 0.6530 on the hourly chart of AUD/USD.
AUD/USD Technical Analysis
On the hourly chart of AUD/USD, the pair started a fresh increase from the 0.6450 support. The Aussie Dollar was able to clear the 0.6470 resistance to move into a positive zone against the US Dollar.
There was a close above the 0.6500 resistance and the 50-hour simple moving average. Finally, the pair tested the 0.6540 zone. A high was formed near 0.6541 and the pair recently started a consolidation phase.
There was a move below the 23.6% Fib retracement level of the upward move from the 0.6449 swing low to the 0.6541 high. On the downside, initial support is near the 0.6510 level.
The next major support is near the 0.6495 zone or the 50% Fib retracement level. If there is a downside break below 0.6495, the pair could extend its decline toward the 0.6470 level. Any more losses might signal a move toward 0.6450.
On the upside, the AUD/USD chart indicates that the pair is now facing resistance near 0.6530. There is also a connecting bearish trend line forming with resistance at 0.6530.
The first major resistance might be 0.6540. An upside break above it might send the pair further higher. The next major resistance is near the 0.6580 level. Any more gains could clear the path for a move toward the 0.6600 resistance zone.
This article represents the opinion of the Companies operating under the FXOpen brand only. It is not to be construed as an offer, solicitation, or recommendation with respect to products and services provided by the Companies operating under the FXOpen brand, nor is it to be considered financial advice.

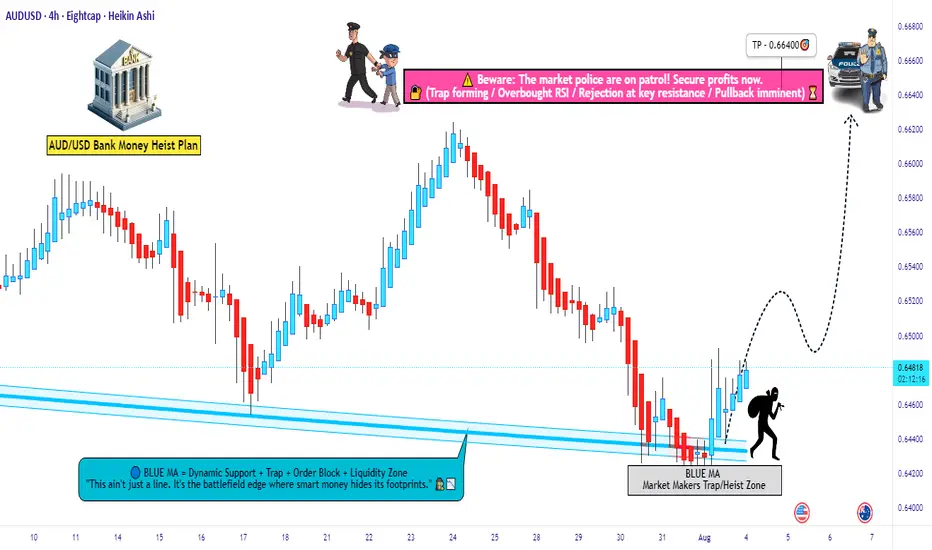
Ready for the Aussie Heist? Is This the Perfect Entry?🚨💰 - "The Aussie Vault Raid: Bullish Robbery in Progress!" 💰🚨
AUD/USD Forex Trade Idea (Thief Style Swing/Day Plan)
📈🔥 Designed for Thief Traders, Market Robbers & Money Makers Worldwide 🤑🐱👤💸
🌍 Hello Global Robbers!
🌟 Hola! Ola! Bonjour! Hallo! Salaam! Konnichiwa! 🌟
Welcome to another bold heist plan from the Thief Trading Crew. This one’s a high-stakes raid on the AUD/USD — "The Aussie" — using our signature Thief Trading Style, combining raw technical setups with real macro/fundamental edge. We're eyeing the Bullish Vault Breakout, so tighten up your gloves — it’s time to rob smart, not hard.
🔓💸 ENTRY PLAN – “The Vault is Unlocked!”
Grab the bullish loot at any valid price zone — but here’s how real thieves move:
📍 Recommended Entry Style:
Use Buy Limit Orders near local swing lows, demand zones, or key pullback entries on the 15m to 30m chart.
Execute DCA (Dollar Cost Averaging) / Layered Orders for more precision.
Align with your MA lines & candle structures for max confirmation.
🛑 STOP LOSS – “Escape Route Secured”
📍 SL hidden beneath recent swing lows below MA (on 4H):
🎯 Suggested Level: 0.64550
💡 Custom-fit your SL based on:
Trade size
Number of active positions
Account risk strategy
🎯 PROFIT TARGET – “Cash Out Before the Cops Show!”
🏴☠️ Take-Profit Zone: 0.66400
This is our bullish breakout reward zone — a high-value zone where profit meets safety.
🔍 MARKET OUTLOOK – "Cops Are Watching, but We're Ahead..."
📈 The AUD/USD market is flashing bullish momentum, supported by:
✅ Risk sentiment flow
✅ US Dollar weakness and rate expectations
✅ Intermarket signals from commodities (Gold/Iron)
✅ Positive macro positioning from smart money (via COT)
✅ Technical demand forming reversal patterns from oversold zones
📎 For a deeper breakdown —
📰 Fundamentals | COT Reports | Sentiment | Intermarket Analysis — Check Klick 🔗
⚠️ THIEF ALERT – “Avoid Sirens. Watch the News.”
Stay out of trouble by following these protocols during major news events:
🚫 Don’t enter trades blindly before/after big news
📍 Use trailing stops to protect gains
🔄 Adjust SL/TP if price nears breakout points during volatility
💥 SUPPORT THE CREW – “Smash That Boost Button!”
Love the plan? Then Boost this chart to show love for the Thief Trading Movement.
Every like, comment, and boost adds power to our robbery network across the globe. 🌍❤️💰
⚖️ DISCLAIMER – “Not Financial Advice, Just Thief Vibes”
📌 This analysis is for educational and entertainment purposes only.
📌 Trade at your own risk and always do your own analysis.
📌 Market moves fast — stay sharp, stay stealthy.
**🎭 See you at the next heist.
Until then, trade rich. Rob wise.
Thief Trader out. 🐱👤💰📉📈**
AUDUSD Bullish Bias!
HI,Traders !
#AUDUSD is trading in a
Local uptrend and the
Pair made a retest of the
Horizontal support of 0.64796
And we are already seeing
A bullish rebound so we
Will be expecting a further
Bullish move up !
Comment and subscribe to help us grow !

Ready for the Aussie Heist? Is This the Perfect Entry?🚨💰 - "The Aussie Vault Raid: Bullish Robbery in Progress!" 💰🚨
AUD/USD Forex Trade Idea (Thief Style Swing/Day Plan)
📈🔥 Designed for Thief Traders, Market Robbers & Money Makers Worldwide 🤑🐱👤💸
🌍 Hello Global Robbers!
🌟 Hola! Ola! Bonjour! Hallo! Salaam! Konnichiwa! 🌟
Welcome to another bold heist plan from the Thief Trading Crew. This one’s a high-stakes raid on the AUD/USD — "The Aussie" — using our signature Thief Trading Style, combining raw technical setups with real macro/fundamental edge. We're eyeing the Bullish Vault Breakout, so tighten up your gloves — it’s time to rob smart, not hard.
🔓💸 ENTRY PLAN – “The Vault is Unlocked!”
Grab the bullish loot at any valid price zone — but here’s how real thieves move:
📍 Recommended Entry Style:
Use Buy Limit Orders near local swing lows, demand zones, or key pullback entries on the 15m to 30m chart.
Execute DCA (Dollar Cost Averaging) / Layered Orders for more precision.
Align with your MA lines & candle structures for max confirmation.
🛑 STOP LOSS – “Escape Route Secured”
📍 SL hidden beneath recent swing lows below MA (on 4H):
🎯 Suggested Level: 0.64170
💡 Custom-fit your SL based on:
Trade size
Number of active positions
Account risk strategy
🎯 PROFIT TARGET – “Cash Out Before the Cops Show!”
🏴☠️ Take-Profit Zone: 0.66400
This is our bullish breakout reward zone — a high-value zone where profit meets safety.
🔍 MARKET OUTLOOK – "Cops Are Watching, but We're Ahead..."
📈 The AUD/USD market is flashing bullish momentum, supported by:
✅ Risk sentiment flow
✅ US Dollar weakness and rate expectations
✅ Intermarket signals from commodities (Gold/Iron)
✅ Positive macro positioning from smart money (via COT)
✅ Technical demand forming reversal patterns from oversold zones
📎 For a deeper breakdown —
📰 Fundamentals | COT Reports | Sentiment | Intermarket Analysis — Check Klick 🔗
⚠️ THIEF ALERT – “Avoid Sirens. Watch the News.”
Stay out of trouble by following these protocols during major news events:
🚫 Don’t enter trades blindly before/after big news
📍 Use trailing stops to protect gains
🔄 Adjust SL/TP if price nears breakout points during volatility
💥 SUPPORT THE CREW – “Smash That Boost Button!”
Love the plan? Then Boost this chart to show love for the Thief Trading Movement.
Every like, comment, and boost adds power to our robbery network across the globe. 🌍❤️💰
⚖️ DISCLAIMER – “Not Financial Advice, Just Thief Vibes”
📌 This analysis is for educational and entertainment purposes only.
📌 Trade at your own risk and always do your own analysis.
📌 Market moves fast — stay sharp, stay stealthy.
**🎭 See you at the next heist.
Until then, trade rich. Rob wise.
Thief Trader out. 🐱👤💰📉📈**
AUDUSD Will Keep Falling!
HI,Traders !
#AUDUSD keeps falling down
And the pair made a strong
Bearish breakout of the key
Horizontal key level of 0.64796
And the breakout is confirmed
So we are bearish biased and
We will be expecting a further
Bearish move down !
Comment and subscribe to help us grow !

AUDUSD Bullish Breakout!
HI,Traders !
#AUDUSD is trading in a strong
Uptrend and the price made a
Bullish breakout of the key
Horizontal level of 0.65829
So we are bullish biased
And we will be expecting a
Further bullish move up !
Comment and subscribe to help us grow !

Market Analysis: AUD/USD Climbs as Dollar WeakensMarket Analysis: AUD/USD Climbs as Dollar Weakens
AUD/USD started a decent increase above the 0.6520 level.
Important Takeaways for AUD/USD Analysis Today
- The Aussie Dollar rebounded after forming a base above the 0.6450 level against the US Dollar.
- There is a connecting bullish trend line forming with support at 0.6540 on the hourly chart of AUD/USD.
AUD/USD Technical Analysis
On the hourly chart of AUD/USD at FXOpen, the pair started a fresh increase from the 0.6450 support. The Aussie Dollar was able to clear the 0.6500 resistance to move into a positive zone against the US Dollar.
There was a close above the 0.6550 resistance and the 50-hour simple moving average. Finally, the pair tested the 0.6565 zone. A high was formed near 0.6564 and the pair recently started a consolidation phase.
On the downside, initial support is near the 0.6540 level. There is also a connecting bullish trend line forming with support at 0.6540. It is close to the 23.6% Fib retracement level of the upward move from the 0.6454 swing low to the 0.6564 high.
The next major support is near the 0.6495 zone. If there is a downside break below it, the pair could extend its decline toward the 0.6480 level. It is close to the 76.4% Fib retracement level.
Any more losses might signal a move toward 0.6450. On the upside, the AUD/USD chart indicates that the pair is now facing resistance near 0.6565. The first major resistance might be 0.6575. An upside break above the 0.6575 resistance might send the pair further higher.
The next major resistance is near the 0.6600 level. Any more gains could clear the path for a move toward the 0.6650 resistance zone.
This article represents the opinion of the Companies operating under the FXOpen brand only. It is not to be construed as an offer, solicitation, or recommendation with respect to products and services provided by the Companies operating under the FXOpen brand, nor is it to be considered financial advice.

AUDUSD Bearish Breakout!
HI,Traders !
AUD-USD is trading in a sideways trend
and the pair
Made a breakout of the
Key horizontal level
Of 0.8149 which is now
A resistance and the pair
Is now making a retest
Of the level so as we are
Bearish biased we will
Be expecting a pullback
And a further bearish
Move down !
Comment and subscribe to help us grow !

#AUDUSD: +1100 Pips Possible Swing Bullish Move! AUDUSD a strong sign of bullish behaviour has appeared alongside bullish momentum. As we have NFP tomorrow, we expect market to remain volatile; what we think now is to have market settled down before we can have any confirmation. We recommend to remain extra cautious tomorrow, once market get settled we can then enter with accurate risk management.
Like, comment and Share for more!
Team Setupsfx_
Market Analysis: AUD/USD Attempts Fresh ClimbMarket Analysis: AUD/USD Attempts Fresh Climb
AUD/USD is attempting a fresh increase from the 0.6485 support.
Important Takeaways for AUD/USD Analysis Today
- The Aussie Dollar found support at 0.6485 and recovered against the US Dollar.
- There is a key bearish trend line forming with resistance at 0.6535 on the hourly chart of AUD/USD at FXOpen.
AUD/USD Technical Analysis
On the hourly chart of AUD/USD at FXOpen, the pair started a fresh increase above 0.6550. The Aussie Dollar tested the 0.6585 zone before the bears appeared and pushed it lower against the US Dollar.
The pair declined below the 0.6560 and 0.6550 support levels. The recent low was formed at 0.6485 and the pair is rising again. The bulls pushed it above the 50% Fib retracement level of the downward move from the 0.6588 swing high to the 0.6485 low.
The pair is now consolidating above the 50-hour simple moving average. On the upside, the AUD/USD chart indicates that the resistance is near the 0.6535 zone. There is also a key bearish trend line forming at 0.6535.
The first major resistance might be 0.6550 and the 61.8% Fib retracement level. An upside break above it might send the pair further higher. The next major resistance is near the 0.6560 level. Any more gains could clear the path for a move toward the 0.6585 resistance zone.
If not, the pair might correct lower. Immediate support sits near the 0.6510 level. The next support could be 0.6485. If there is a downside break below 0.6485, the pair could extend its decline toward the 0.6440 zone. Any more losses might signal a move toward 0.6420.
This article represents the opinion of the Companies operating under the FXOpen brand only. It is not to be construed as an offer, solicitation, or recommendation with respect to products and services provided by the Companies operating under the FXOpen brand, nor is it to be considered financial advice.
Australian Dollar Strengthens Following RBA DecisionAustralian Dollar Strengthens Following RBA Decision
Today, the AUD/USD pair experienced a spike in volatility. According to ForexFactory, analysts had forecast that the Reserve Bank of Australia (RBA) would cut interest rates from 3.85% to 3.60%. However, the market was caught off guard as the central bank opted to keep rates unchanged.
The RBA stated the following:
→ It remains cautious in its inflation outlook and awaits further evidence confirming that inflation is on track to return to the 2.5% target.
→ The decision to hold the rate was made by a vote of six to three — a rare instance of a split opinion among committee members.
The initial market reaction to the RBA’s unexpected move was a sharp appreciation of the Australian dollar. However, this was followed by a quick pullback in the minutes that followed (as indicated by the arrows).
Technical Analysis of the AUD/USD Chart
Since early July, price action in AUD/USD has been forming a descending channel (marked in red). In this context:
→ Today’s sharp rally and subsequent retracement underscored the significance of the upper boundary of the channel;
→ The pair tested a previously broken ascending trendline (the lower line of the blue channel);
→ Although the price briefly rose above the 0.65450 level, this area may now act as resistance going forward.
There is a possibility that, as forex trading unfolds throughout the day, AUD/USD could retreat towards the median line of the descending channel. Such a move could be interpreted as follows:
→ The initial reaction to the RBA decision may have been premature;
→ Selling pressure persists, which might trigger a move towards the support zone near 0.64850.
Looking ahead, the trajectory of AUD/USD in July 2025 will be largely influenced by developments surrounding a potential trade agreement between the United States and other countries, including Australia.
This article represents the opinion of the Companies operating under the FXOpen brand only. It is not to be construed as an offer, solicitation, or recommendation with respect to products and services provided by the Companies operating under the FXOpen brand, nor is it to be considered financial advice.
