ZECUSD - Oh no are we in bear market since 2 weeks ? want to finish on a good working idea before stoping publishing hehe
this double bottom formation has been seen too much time lately
I entered now
SL : 340 for now, will update lower at 310 when white trendline broke down
Also depends on BTC reaction but i think daddy is going to see 100k or sub 100k first before going a bit up (last rejection made me switch bear for some days)
first TP : 155
second TP : 60/70
Cheers not advice
Bearish Patterns

AUD/NZD SELLERS WILL DOMINATE THE MARKET|SHORT
Hello, Friends!
It makes sense for us to go short on AUD/NZD right now from the resistance line above with the target of 1.127 because of the confluence of the two strong factors which are the general downtrend on the previous 1W candle and the overbought situation on the lower TF determined by it’s proximity to the upper BB band.
Disclosure: I am part of Trade Nation's Influencer program and receive a monthly fee for using their TradingView charts in my analysis.
✅LIKE AND COMMENT MY IDEAS✅

GOLD BEARS WILL DOMINATE THE MARKET|SHORT
GOLD SIGNAL
Trade Direction: short
Entry Level: 4,107.17
Target Level: 3,579.84
Stop Loss: 4,459.30
RISK PROFILE
Risk level: medium
Suggested risk: 1%
Timeframe: 1D
Disclosure: I am part of Trade Nation's Influencer program and receive a monthly fee for using their TradingView charts in my analysis.
✅LIKE AND COMMENT MY IDEAS✅

GBP/NZD SHORT FROM RESISTANCE
Hello, Friends!
We are now examining the GBP/NZD pair and we can see that the pair is going up locally while also being in a uptrend on the 1W TF. But there is also a powerful signal from the BB upper band being nearby, indicating that the pair is overbought so we can go short from the resistance line above and a target at 2.320 level.
Disclosure: I am part of Trade Nation's Influencer program and receive a monthly fee for using their TradingView charts in my analysis.
✅LIKE AND COMMENT MY IDEAS✅

AUD/CHF SENDS CLEAR BEARISH SIGNALS|SHORT
AUD/CHF SIGNAL
Trade Direction: short
Entry Level: 0.519
Target Level: 0.514
Stop Loss: 0.522
RISK PROFILE
Risk level: medium
Suggested risk: 1%
Timeframe: 6h
Disclosure: I am part of Trade Nation's Influencer program and receive a monthly fee for using their TradingView charts in my analysis.
✅LIKE AND COMMENT MY IDEAS✅

NZD/CHF BEARS ARE GAINING STRENGTH|SHORT
Hello, Friends!
NZD/CHF is making a bullish rebound on the 2H TF and is nearing the resistance line above while we are generally bearish biased on the pair due to our previous 1W candle analysis, thus making a trend-following short a good option for us with the target being the 0.456 level.
Disclosure: I am part of Trade Nation's Influencer program and receive a monthly fee for using their TradingView charts in my analysis.
✅LIKE AND COMMENT MY IDEAS✅

USOIL BEARISH BIAS RIGHT NOW| SHORT
USOIL SIGNAL
Trade Direction: short
Entry Level: 58.02
Target Level: 57.01
Stop Loss: 58.69
RISK PROFILE
Risk level: medium
Suggested risk: 1%
Timeframe: 2h
Disclosure: I am part of Trade Nation's Influencer program and receive a monthly fee for using their TradingView charts in my analysis.
✅LIKE AND COMMENT MY IDEAS✅

CAD/CHF BEST PLACE TO SELL FROM|SHORT
CAD/CHF SIGNAL
Trade Direction: short
Entry Level: 0.568
Target Level: 0.564
Stop Loss: 0.570
RISK PROFILE
Risk level: medium
Suggested risk: 1%
Timeframe: 5h
Disclosure: I am part of Trade Nation's Influencer program and receive a monthly fee for using their TradingView charts in my analysis.
✅LIKE AND COMMENT MY IDEAS✅

NZD/CAD BEARS ARE STRONG HERE|SHORT
Hello, Friends!
Bearish trend on NZD/CAD, defined by the red colour of the last week candle combined with the fact the pair is overbought based on the BB upper band proximity, makes me expect a bearish rebound from the resistance line above and a retest of the local target below at 0.801.
Disclosure: I am part of Trade Nation's Influencer program and receive a monthly fee for using their TradingView charts in my analysis.
✅LIKE AND COMMENT MY IDEAS✅

CHF/JPY SHORT FROM RESISTANCE
Hello, Friends!
CHF-JPY uptrend evident from the last 1W green candle makes short trades more risky, but the current set-up targeting 188.106 area still presents a good opportunity for us to sell the pair because the resistance line is nearby and the BB upper band is close which indicates the overbought state of the CHF/JPY pair.
Disclosure: I am part of Trade Nation's Influencer program and receive a monthly fee for using their TradingView charts in my analysis.
✅LIKE AND COMMENT MY IDEAS✅

GBP/CAD BEST PLACE TO SELL FROM|SHORT
GBP/CAD SIGNAL
Trade Direction: short
Entry Level: 1.883
Target Level: 1.871
Stop Loss: 1.891
RISK PROFILE
Risk level: medium
Suggested risk: 1%
Timeframe: 12h
Disclosure: I am part of Trade Nation's Influencer program and receive a monthly fee for using their TradingView charts in my analysis.
✅LIKE AND COMMENT MY IDEAS✅

$BTC about to collapse?Hey traders,
I Hope you are doing good!
As a continuation of my last CRYPTOCAP:BTC analysis ( ) I bring you a new fresh Bitcoin scenario.
In this case, my thoughts have changed. In my opinion what we saw last Friday was just the beginning of an early bearish movement.
The price tried to rebound and show some strenght but it failed and is falling to new lows.
Of course, momentum changes so fast and my setup could be invalid if we head to 116.000 USD and close above this week. However, in my opinion thats not likely to happen.
Im not talking about a short bearish movement but an actual 3 -6 months bear market.
My targets? Hard to say. But I see some interesting zones at 60 - 80K where I will start to buy some Bitcoin.
This scenario obviously applies to SP500 and Nasdaq.

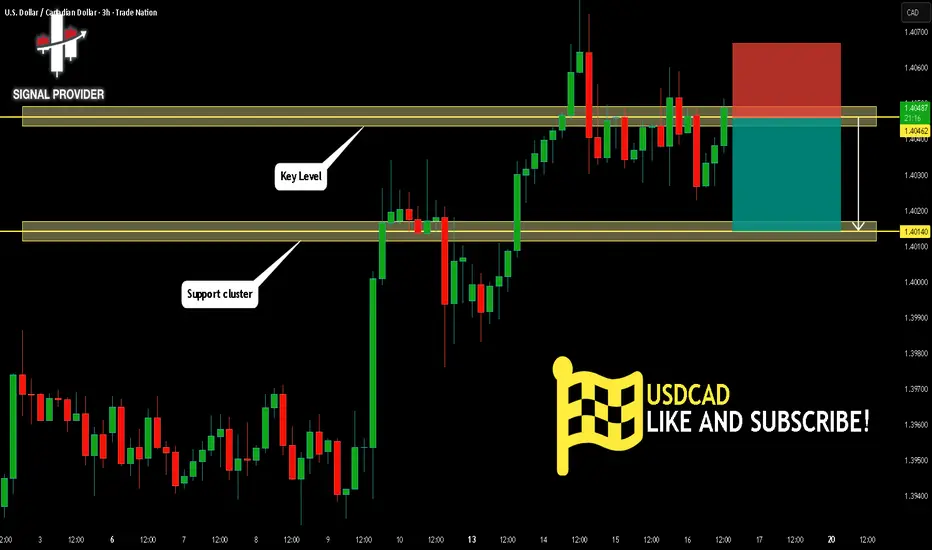
USDCAD Will Go Lower! Short!
Here is our detailed technical review for USDCAD.
Time Frame: 3h
Current Trend: Bearish
Sentiment: Overbought (based on 7-period RSI)
Forecast: Bearish
The market is on a crucial zone of supply 1.404.
The above-mentioned technicals clearly indicate the dominance of sellers on the market. I recommend shorting the instrument, aiming at 1.401 level.
P.S
Overbought describes a period of time where there has been a significant and consistent upward move in price over a period of time without much pullback.
Like and subscribe and comment my ideas if you enjoy them!
NZD/JPY SENDS CLEAR BEARISH SIGNALS|SHORT
NZD/JPY SIGNAL
Trade Direction: short
Entry Level: 86.714
Target Level: 86.288
Stop Loss: 86.998
RISK PROFILE
Risk level: medium
Suggested risk: 1%
Timeframe: 2h
Disclosure: I am part of Trade Nation's Influencer program and receive a monthly fee for using their TradingView charts in my analysis.
✅LIKE AND COMMENT MY IDEAS✅

CAD/JPY BEARS ARE GAINING STRENGTH|SHORT
Hello, Friends!
CAD/JPY pair is in the downtrend because previous week’s candle is red, while the price is obviously rising on the 4H timeframe. And after the retest of the resistance line above I believe we will see a move down towards the target below at 106.478 because the pair is overbought due to its proximity to the upper BB band and a bearish correction is likely.
Disclosure: I am part of Trade Nation's Influencer program and receive a monthly fee for using their TradingView charts in my analysis.
✅LIKE AND COMMENT MY IDEAS✅

AUD/JPY SELLERS WILL DOMINATE THE MARKET|SHORT
Hello, Friends!
AUD/JPY pair is trading in a local downtrend which know by looking at the previous 1W candle which is red. On the 1H timeframe the pair is going up. The pair is overbought because the price is close to the upper band of the BB indicator. So we are looking to sell the pair with the upper BB line acting as resistance. The next target is 97.676 area.
Disclosure: I am part of Trade Nation's Influencer program and receive a monthly fee for using their TradingView charts in my analysis.
✅LIKE AND COMMENT MY IDEAS✅

USD/JPY - Outlook🧭 USD/JPY – Outlook
🕰️ Top-Down Bias
HTF still shows bearish structure 🐻 from the upper channel resistance near 152.00, rejecting a major zone after that last liquidity grab up top.
STF is ranging, trying to hold above the 150.00 mark — but momentum’s fading and sellers might be warming up.
🧱 Technical Breakdown
Weekly : Price tagged major resistance and failed to break higher. Room for continuation lower toward the 144–142 zone (confluence of weekly demand + SSL).
Daily : Still in a broad ascending channel. Any push below 149.50 could open the path to 145 and deeper demand below 140.
8H : Clear rejection from upper MTF trendline → expecting pullback to Target 1 (149), Target 2 (147), and possibly Target 3 (145) if momentum picks up.
Structure note: HTF still bearish, STF neutral/ranging = watch for break of short-term support to confirm the shift.
🎯 Trade Zones
Sell Zone: 151.50–152.00 (liquidity sweep area)
Targets : 149.00 🥇 | 147.00 🥈 | 145.00 🥉 | 140.00 (final HTF demand)
Invalidation : 152.50 clean break & hold
⚙️ Risk Management
Keep stops above structure highs — price may sweep liquidity before reversing.
Watch DXY for extra confirmation before committing size 💡
🔖 Summary
HTF supports bearish price action, while STF is still ranging with unclear direction. Expect HTF momentum to take over soon — eyes on 149.00 breakdown for the next big leg down.

Bears Looking To "Correct" Price Gap on EJHere we can see OANDA:EURJPY after many attempts of testing the Rising Support as Support, has broken down below it suggesting not much Support may come from it!!
This comes after Price had made a series of events that would seem a Correction is at hand.
Once Price made the Low (Point A) @ 174.812, Bulls were unable to make a Higher High and settled for a Lower High (Point B) at the 50% Retracement Level @ 176.384.
With the Low being the Confirmation Point for the potential Correction, once Price is able to Break Down below, this will Validate the Set-Up and will generate Short Opportunities to take Price down to the next Support Level which happens to be at the 1.236 Extension of 172.508!

GBPJPY Eyes 202.900 Resistance as Correction Meets Downtrend!Hey Traders, in tomorrow’s trading session we are monitoring GBPJPY for a potential selling opportunity around the 202.900 zone. The pair remains within a broader downtrend and is currently in a corrective phase, approaching a key resistance area near 202.900 that aligns with the descending trend structure.
Structure:
Price has been forming lower highs and lower lows, maintaining bearish momentum. The current retracement toward 202.900 could provide an attractive area for sellers to re-enter the market in line with the dominant trend.
Key level in focus:
202.900 — a strong resistance confluence area, combining structural and technical significance.
Fundamentals:
Ongoing concerns over global risk sentiment and the potential for renewed JPY strength amid rising geopolitical tensions could further support downside pressure on GBPJPY.
Next move:
Monitoring price action closely around 202.900 — a rejection or bearish confirmation at this level could trigger the next leg lower within the prevailing downtrend.
Trade safe,
Joe.

EUR/USD - Outlook (LTF ranging market)🔥 EUR/USD Outlook Breakdown 🔥
Let’s decode this clean structure — multi-time-frame style with a punch of trader slang 👇
🧭 Weekly Timeframe
We’re chilling just under a long-term bearish resistance trend, and the last few weeks show clear compression beneath that line.
The weekly breakout candle couldn’t sustain upside, hinting sellers are still lurking.
Price holds under 1.1800, keeping HTF (higher-time-frame) structure bearish.
➡️ Eyes on the 1.1500–1.1450 zone as next liquidity grab if momentum kicks in.
📆 Daily Timeframe
Daily shows a ranging market between 1.1750 resistance and 1.1550 support.
We saw a BOS earlier in the structure, but bulls couldn’t follow through.
Multiple rejections from the supply block confirm short-term hesitation.
The support trendline is hanging on — but if it snaps, expect the cascade to begin.
Targets line up clean:
🎯 Target 1: 1.1400
🎯 Target 2: 1.1150
🎯 Target 3: 1.1000
⏰ 8H Timeframe
On the 8H, we’re playing ping-pong inside that same range.
Price grabbed the BSL (Buy-side Liquidity) up top and retraced to the mid-range demand.
Both BH zones are acting as intraday traps — classic indecision setup.
Until we break out clean, expect chop.
➡️ However… here’s the key line:
“HTF supports bearish price action although STF is currently ranging giving unclear direction. HTF will take control.”
That means we’re likely setting up for a fake bullish pop before a strong bearish drive, once HTF order flow dominates.
🎯 Trade Idea
Bias : Bearish (waiting for HTF dominance)
Setup : Sell the fake-out above range highs or on break & retest of 1.1550 support
Targets : 1.1400 → 1.1150 → 1.1000
Invalidation : Daily close above 1.1750
Gameplan : Stay patient — HTF flow will win.
⚡ Summary
EUR/USD is stuck in a rangey mess, but the bigger picture screams bearish.
When HTF takes back control, expect a breakdown toward 1.1400+ zones.
Shorts will be the move once that range floor cracks.

USD/CHF - Outlook Breakdown🔥 USD/CHF Outlook Breakdown 🔥
Let’s unpack this setup across the timeframes — clean and simple trader talk 👇
🧭 Wee kly Timeframe
Price is squeezing tight within a descending channel, holding under that key 0.8050–0.8100 supply zone.
We’ve seen multiple rejections there, confirming strong seller control.
Structure-wise, it’s still bearish — last week’s BOS (Break of Structure) sealed the lower bias.
➡️ Expect continuation lower unless we see a weekly candle close above 0.8050.
📆 Daily Timeframe
Price had a reaction from the second wave of supply, tapping into the daily zone around 0.8050 before rejecting.
The move broke minor daily structure to the downside, confirming bearish order flow.
We’re now hovering near a support shelf ~0.7920, but the context still favors shorts while below that daily zone.
➡️ Next clean liquidity pocket sits near 0.7820–0.7850.
⏰ 8H Timeframe
Here’s where the detail shines.
We’ve got a nice 5-wave internal structure forming:
(1) BOS confirming shift to bearish flow
(2) Pullback into 8H BH zone (premium area)
(3) Sweep of local SSL (liquidity grab)
(4) Retest of 71% fib zone (perfect premium fill)
(5) Targeting external HTF SSL (around 0.7820)
Currently retesting that mini 8H supply (0.7940–0.7960).
If it holds — 💣 expect the drop to continue towards 0.7820.
🎯 Trade Idea
Bias: Bearish
Sell Zone: 0.7940–0.7960 (retest of 8H supply / 71% fib)
Targets : 0.7850 → 0.7820
Invalidation: 0.8000 (clean break & close above)
Bonus Tip: Watch for a lower-TF liquidity sweep before short entries for cleaner confirmation.
⚠️ Summary
USD/CHF still sits in a tight bearish squeeze under strong higher-timeframe supply.
Until bulls reclaim 0.8050, the path of least resistance = downside.
Next major magnet: 0.7820 liquidity pool.

GOLD BEARISH BIAS RIGHT NOW| SHORT
GOLD SIGNAL
Trade Direction: short
Entry Level: 4,250.59
Target Level: 4,039.91
Stop Loss: 4,389.04
RISK PROFILE
Risk level: medium
Suggested risk: 1%
Timeframe: 12h
Disclosure: I am part of Trade Nation's Influencer program and receive a monthly fee for using their TradingView charts in my analysis.
✅LIKE AND COMMENT MY IDEAS✅

GBP/JPY BEARS ARE STRONG HERE|SHORT
Hello, Friends!
We are targeting the 200.306 level area with our short trade on GBP/JPY which is based on the fact that the pair is overbought on the BB band scale and is also approaching a resistance line above thus going us a good entry option.
Disclosure: I am part of Trade Nation's Influencer program and receive a monthly fee for using their TradingView charts in my analysis.
✅LIKE AND COMMENT MY IDEAS✅
