BITCOIN : First Drop Then Shoot Up To $150,000Overview🧠
Bitcoin is in a bearish trend since it reversed from our previous trading zone. We expect the price to continue declining between 60,000 and 70,000. This is a suitable time to consider buying Bitcoin. Once the trade is activated, there are three potential targets: 90,000, 120,000 and 150,000.
Please use appropriate risk management when trading Bitcoin as it is a more volatile asset.
We wish you the best of luck.
Team Setupsfx_❤️🏆
Bitcoinprice

Bitcoin (BTCUSDT) – Short-Term Bearish StructureHi!
The chart shows BTC moving inside a descending channel, with consistent lower highs and lower lows confirming a controlled downtrend. Recent price action attempted to push back into the QML (Quasimodo Level) area, but the reaction there shows clear rejection, suggesting supply remains in control.
Price is now falling toward the lower boundary of the channel, where a short-term bounce is possible. However, unless BTC breaks above the QML zone and the descending trendline, the broader expectation remains bearish.
The projected path suggests:
A drop into the channel low,
A corrective pullback,
And then a continuation lower toward the next major support zone around 89,700 – 89,800.
Overall, momentum and structure both support a bearish continuation unless buyers manage to reclaim the supply zone above.

Liquidity Basics: Equal Highs/Lows, Inefficiencies & POIsPrice doesn’t move randomly, it is always attracted towards liquidity.
Every wick, breakout, and fake-out tells a story of orders being filled.
If you can read where those orders are hiding, you stop trading noise and start trading intention.
Equal Highs & Lows — The Obvious Targets
Retail traders love to mark equal highs and lows as “strong support/resistance.”
Smart money sees them as fuel.
Above equal highs = cluster of buy stops.
Below equal lows = cluster of sell stops.
When price reaches them, it’s a collection of accumulated liquidity as a main driver behind that move.
Inefficiencies — Fair Value Gaps
Also known as Fair Value Gaps (FVGs) or imbalances, these occur when price moves too quickly, leaving unfilled orders behind.
Price often revisits these zones later to rebalance.
Spot them between large candles with no overlap, they often mark where institutions filled partial orders.
Points of Interest (POIs)
POIs are areas where liquidity and inefficiency converge , the zones of intent.
Look for:
Liquidity sweep of equal highs/lows
Return to imbalance or order block
Shift in market structure
That’s where high-probability setups occur.
Note:
Stop chasing every candle.
Start mapping why price moves.
Equal highs and inefficiencies are magnets, with proper plan and confluence this can represent your strong side of trading.

When Crypto Actually MovesCrypto trades around the clock, but the market doesn’t behave the same way at every hour. Volume, liquidity, and volatility cluster around predictable windows, and those windows shape how setups form and how price reacts. When you understand these shifts, you stop taking trades randomly and start aligning execution with the moments when the market truly moves.
Why Sessions Matter
Even though crypto never sleeps, human traders and institutional desks still operate in cycles. Liquidity providers adjust during business hours. Market makers re-balance at session opens. Macro news is released on a fixed schedule. These patterns create recurring volatility signatures.
Ignoring sessions means you treat every candle as equal. Understanding sessions means you add a layer of context that improves timing, risk control, and win rate.
Asia Session (00:00–06:00 UTC)
The Asia window tends to be slower and more range-bound.
Characteristics include:
– Moderate liquidity
– Clean consolidations
– Accumulation before Europe
– Fewer impulsive moves unless driven by news from Asia-Pacific regions
This period often sets the initial range of the day. Liquidity begins to cluster above highs and below lows, creating the conditions for later sweeps.
Europe Session (07:00–12:00 UTC)
Liquidity expands significantly as London opens. You often see the first engineered move of the day.
Key behaviors:
– Early sweeps of the Asia range
– Strong breakouts from overnight compression
– Directional push before New York volatility
This session frequently defines the directional bias into US hours. It’s a prime window for structured setups because market participation rises sharply.
US Session (13:00–20:00 UTC)
This is the most active window. The highest liquidity and most decisive moves occur here.
Typical features:
– Strong continuation or full reversal of the London move
– Reaction to economic news
– Trend acceleration during peak overlap hours
This is where major breakouts, deep liquidity hunts, and high-powered moves happen. If you trade momentum or breakout strategies, this session offers the cleanest conditions.
Weekend Behavior
Weekends operate on thin liquidity. Order books are lighter, market makers are less active, and volatility behaves differently.
Common outcomes:
– Sharp wicks that violate structure
– Sudden spikes without follow-through
– False breakouts with immediate reversals
Weekend moves often distort technicals. They can be useful for narrative-driven positions but carry higher risk for intraday traders.
How to Integrate Sessions Into Your Trading
Use sessions to filter when you participate and when you avoid noise.
Practical adjustments:
– Execute momentum setups during Europe or US hours.
– Treat Asia session as a range-building phase suitable for scouting zones.
– Avoid taking aggressive positions during weekend chop.
– Use session opens as key decision points for liquidity grabs.
When you layer session timing on top of structure, you refine entries and eliminate trades that lack the environment for follow-through.
The Strategic Advantage of Session Awareness
Session timing gives you clarity. You start anticipating where liquidity is likely to be engineered, where volume will enter, and when the market is likely to trend or stall.
This transforms your approach.
Instead of reacting to candles, you plan around expected volatility cycles.
Instead of forcing trades, you wait for session transitions that historically produce reliable movement.

BTC Weekly View !BTC / USD
Bitcoin (BTC) followed my previous analysis on October 30th, dropping from $110,000 to its current price of $96,000. check here
What's Next?
Take a Look at the weekly chart:
Bitcoin is currently at a "do or die" support level (trend line + 50-week moving average).
This moving average has been a turning point in previous cycles.
If the price breaks below this level, it will confirm a mid-term bear trend with minimal target around 74k so keep an eye on this chart.

BITCOIN: Deadlines and CommitmentsPRIMARY LONG-TERM SELL SIGNAL PENDING: (upper panel)
According to my primary long-term trading signal, BITCOIN has a two week deadline to stage a rocket launch rally to negate a long-term SELL confirmation at the close of November trade.
EARLY RSI BUY SIGNAL for 2026? (lower panel)
My custom weekly RSI is rapidly heading toward the oversold 30 level. The good news going forward, insofar as this RSI is concerned, is that in the past, upon closing beneath 30 on a monthly basis, and then closing back above 30 in similar fashion, it has produced sustainable long-term rallies of significance.
WEEKLY MOMENTUM: (bottom panel)
Long-term momentum has moved into bearish territory with readings below zero. If the big cycle top is in with the November 126,272 print high, it is then likely that momentum will continue to test its lower bound before consolidating and registering some bullish momentum divergences as it did in the last move down to the 15,479 print low.
ELLIOTT WAVE COUNT:
Despite the growing possibility that the big cycle top is already in place, I am giving BITCOIN bulls the benefit of the doubt in labeling the current move down as that of a 4th wave of primary degree, with another move higher to fresh all time highs to mark the larger Cycle Degree 3 wave terminal.
In this most bullish case, it is essential that Bitcoin maintain trade above the 69,000 Cycle Degree wave 1 high. Any print beneath that level going forward, and it might be lights out for Bitcoin, at least in terms of Elliott Wave Tenets.
If you are sitting on substantial profits and do not want to see them wither away any further, it may be wise to get a lot smaller on any rallies going forward.


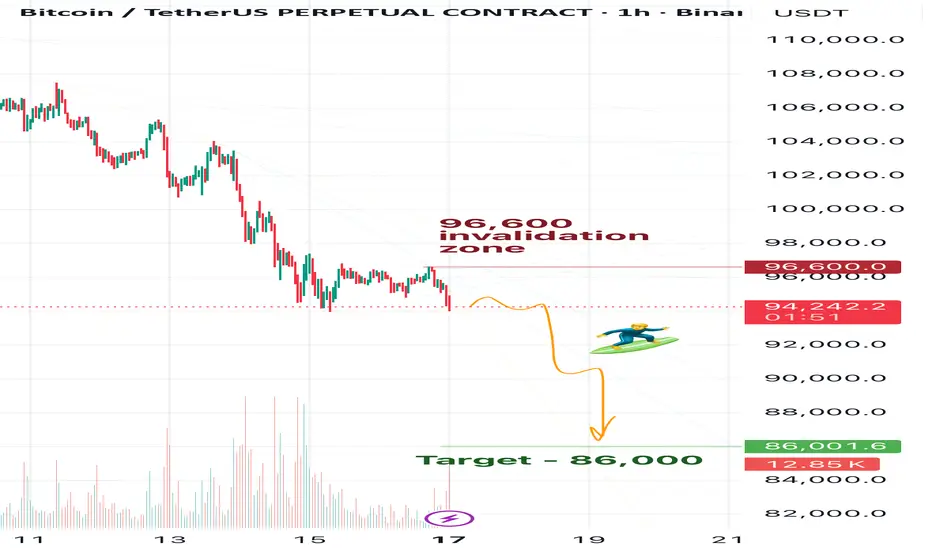
BTC Daily View 17.11Friends, as you may remember from my previous Bitcoin updates, I’m expecting BTC to reach 83k. At the moment, in my view, Bitcoin is already preparing for this move down.
However, for now my main target is 86k — I think BTC currently has enough momentum only to drop to that level. Before we see 83k, it will likely need to build more energy.
So after hitting 86k, I expect a correction — probably a prolonged one. But let’s see what the market gives us.
🎯For now, my target remains 86k.
❌Invalidation zone: 96,600
⚠️Disclaimer:
This is not financial advice. Please make your own decisions according to your own trading rules, and never trade without stop-losses.
🗯️If you find my ideas helpful, please leave a reaction and write a comment — your support really matters to me
Bitcoin - This chart is crumbling!⛔️Bitcoin ( CRYPTO:BTCUSD ) creates a massive top:
🔎Analysis summary:
All the previous cycles on Bitcoin have been lasting about 1,000 days. And exactly three years ago, Bitcoin retested the previous all time high, starting the next bullrun. If we soon see bearish confirmation on Bitcoin, this crypto will lead to another insane bloodbath.
📝Levels to watch:
$100,000 and $50,000
SwingTraderPhil
SwingTrading.Simplified. | Investing.Simplified. | #LONGTERMVISION

Bitcoin Downtrend UpdateAlright friends, Bitcoin has confirmed its intention to move toward 86,000 and lower.
My previous forecast with the invalidation zone at 96,600 is still valid, but I decided to make a fresh post.
At the moment, my new invalidation level is 96,012.5.
From a broader perspective, I’m still expecting Bitcoin to reach 83,000.
But as I mentioned earlier, we first need to see 86,000 tested — because once that level is hit, Bitcoin may go into a correction before continuing toward 83,000 and below.
Yes-yes, I do expect it even lower, but more on that in the upcoming updates.
Make sure to follow so you don’t miss them

BTC/USDT | Bitcoin Drops Hard – Key Demand Zones Now in Play!By analyzing the #Bitcoin chart on the daily timeframe, we can see that BTC failed to hold above $104,700, and as expected, this led to a heavy sell-off. First, the price dropped to $94,000, and then a second strong wave pushed it down to $89,000. Bitcoin is now trading around $91,000.
Key supply zones and demand zones are marked on the chart. Important demand levels sit at $88,000, $84,000, and the larger zone at $74,000–$78,000. Watch how the price reacts to these areas.
If Bitcoin wants to recover, it must first hold above these key zones. But if BTC breaks below $74,000, it could open the door for a deeper drop toward $50,000. For now, focus on price reactions at the marked demand levels.
Please support me with your likes and comments to motivate me to share more analysis with you and share your opinion about the possible trend of this chart with me !
Best Regards , Arman Shaban

BTCUSD – Summary of the Higher-Timeframe Buy ScenarioBitcoin has already printed a major Break of Structure (BOS) to the upside, establishing a long-term bullish trend. The current sell-off is a corrective leg, unwinding inefficiencies created during the prior expansion phase.
Price is now gravitating toward a key daily demand zone, which is the origin of the BOS and the zone that previously launched the strong bullish impulse. This area remains unmitigated and holds institutional order-flow significance.
If price retraces into this zone, a reaction is highly probable. The expectation is for consolidation, a shift in short-term structure, and then a new bullish leg that continues the higher-timeframe trend—targeting new highs once the market rebalances.
This setup frames the demand zone as the strategic value area for long-term buyers, aligning with structural bias and discounted pricing.

Is BITCOIN in a DIP OF DOOM or Are the Bears having Fun ?
This is a Crunch time for Bitcoin and Many people Are running scared.
Me, I am sitting tight, NOT selling.
In Fact, I am BUYING
Why ?
Because we are Still in Channel and Above a long Term line of support.
Lets have a Look.
There are two major lines we need to pay attention to...The BLUE ARC that has rejected Every Bitcoin ATH since the beginning and the Line of support that was created in 2011.
And the problem we have right now, is that PA is getting Squeezed between the Two.
PA MUST React.
You can see how tight it is getting and PA is nearly on the lower trendline.
Lets look closer
Same chart as a Weekly chart
See how that Blue Arc has rejected PA and how the White long term support has supported PA>
And it is THIS image of this chart that Give me Hope.
A number of things to note here.
Most importantly is that the Bulls DID break over that Blue Arc once. This shows intent to do so. That was the First time that line of resistance has ever been broken.
And PA was Overbought when it did so and so we did not have the strength to remain above.
PA has retreated and as a consequence, PA is now Oversold.....and with in striking distance.
PA has the strength to attack that Blue Arc again and WIN
PA is currently on the 0.5 Fib Retracement
Should this support fail, we will Visit 89700 on the 0.618 retrancement. But that will only happen if we fall through a line of Support that HAS NEVER BEEN CROSSED
For Me, I remain VERY BULLISH
This is a Dip of Doom and has scared people but we are near the end....So long as we remain above that line of support, I remain positive.
As I mentioned at the beginning of the month, I am expecting this month to close RED but then we Rise....Have a look at the Month Candle Colout chart post.....all will be explained.
Stay safe

Bitcoin Can reach 93000 Bitcoin could reach the price level of $93,000 in the coming weeks.
There is a possibility that after breaking the midline of its long-term weekly channel, it may move up to the indicated FVG level to fill the remaining unfilled orders.
After that, it could start a new bullish rally aiming for the upper boundary of the channel.
This is purely an analysis and should not be considered as financial advice.
Buying or selling is at the trader’s own risk.

$BTC up from hereOn 27 Oct, when BTC was $115k, I said it is going lower to possibly $100k or even overshoot to $90k before a buy ().
We are now at $89.9k. Looking for an up for here to $97k. If it breaks above the trendline, we are looking at a move to $107k before a possible next move lower.

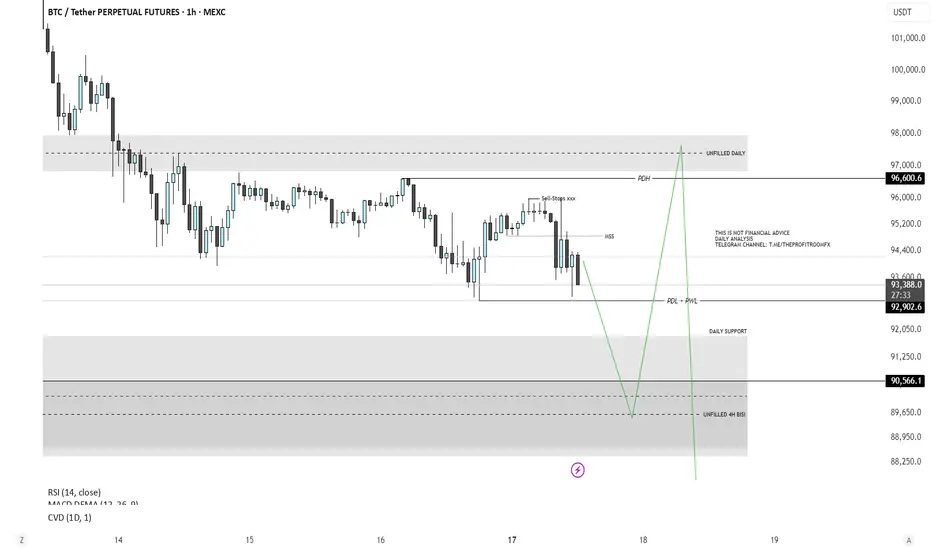
Bitcoin Analysis - Short & LongPrice is anticipated to sweep the previous day’s low (PDL) and previous week’s low (PWL), while also mitigating the unfilled H4 imbalance.
This aligns with a potential retest of the daily FVG support zone before initiating a move to the upside.
There is a clear draw on liquidity toward the buy-side, with both the previous day’s high (PDH) and an unfilled daily FVG serving as objective targets.
After filling this daily FVG imbalance, price is expected to continue delivering lower to address remaining inefficiencies on the sell-side, specifically around the 87,000 level, where another unfilled daily FVG is present.
A Revivisit to the 2017 ATH BITCOIN Fractal and current PA.
With the possibility that we HAVE Topped this cycle, I thought I would go back to an old chart I was posting for most of 2023, 2024 and early parts of 2025
The way Bitcoin was following the 2013 - 2017 ATH Fractal was uncanny.
True that PA dived deeper than the Fractal in 2022 but it still followed the same angle of decent, despite pressure from Institutional banking systems to crash it.
And in Early 2025, Bitcoin PA decoupled from the Trajectory of the Fractal and has pretty well Ranged horizontal in a Range of 80K to 120K ever since.
But what I just saw was this.
The Current ATH was set on the same week as the projected Fractal ATH Date
THAT is very interesting to me.
What does it signify ?
No idea but it may be worth knowing this.
One other thing to add to this is simply how PA has dropped below the 50 week SMA ( RED ) for the first time this run and it has usually been support.
This week is not over and we may see PA push higher and make this push down just a Wick on a weekly candle But I feel this is not going to happen.
For now, I am remaining neutral as to the next steps to take.
I am remaining Bullish that Bitcoin Will push a lot higher in December and January because I currently believe the traditional cycles are broken
BUT this may be just wishful thinking.
Statistically, We HAVE past the date for Cycle Top on many charts using day counts
But it just does not feel right
So I wait. Time Will Always tell

Bitcoin $BTC price analysis we need your vote !💥 Final “dip” of November?
💰 Will CRYPTOCAP:BTC drop to $91,600
to close that old GAP on the chart? 🤔
🟢 Bullish case: $100K holds → next rally begins.
🔴 Bearish case: gap fills near $91,600 → possible reversal after.
What do you think — final washout or just a pause before the next move?, vote at comments
______________
◆ Follow us ❤️ for daily crypto insights & updates!
🚀 Don’t miss out on important market moves
🧠 DYOR | This is not financial advice, just thinking out loud.

BTC: Careful out there.Bitcoin has lost it's momentum, also evident in GOLD/BTCUSD graph (meaning, gold has stole the show from btc). Lower Lows in this graph would mean bear market or a deeper correction Imo.
Other bad sign is SOXX/SPX lower highs, underperforming. Could be a sign for market top but lets see.

BTC TO $150KWith liquidity being broken, we can finally see sellers getting more strength. I expect price to still fall further before a new leg of bulls comes into position

BTC DOWN TO 80K? Based on what we are seeing here if BTC breaks through 100K then the next level down is 80K marker and if that does not hold then 70-72K marker makes sense
However If we can make new highs and break 107K then it is possible to continue upwards
If you want a deeper dive on BTC or any other crypto or stock or commodity you have been watching comment below the stock or asset and I will send you personally an analysis of that asset.
Happy Trading
Trade Smarter Live Better
Mindbloome Exchange

Bitcoin: Oversold !It was a tough week on the crypto market, where the majority of coins significantly slipped in value. BTC was the leader of this drop. It occurred due to the combination of several reasons, which in combination, dragged the BTC toward the lowest, $94,7K level. Persistently high inflation in the US raised doubts that the Federal Reserve will cut interest rates in December, which reduced the demand for risk assets, like BTC. On the other hand, the broader market entered into a risk-off mode, where tech stocks and crypto-companies experienced significant declines. In addition, large liquidations of leveraged long positions in the crypto market, and whale-sales amplified the downward move in BTC price.
The price of BTC was holding solid grounds at $100K support, however, Thursday's risk-off sentiment pushed the price of BTC lower, till the level of $94,7K. During Saturday's trading session, BTC modestly moved to the level of $96K. The RSI indicator reached the level of 30, indicating a clear oversold market side. The MA50 is very close to the MA200, indicating a “dead cross” formation in technical analysis in a near term period.
Although BTCs move toward the $94K for some market participants might be perceived as painful, still, it was a necessary move for BTC. Now it marks a fresh, new start for BTC for a move toward higher grounds, and even new ATH sometime in 2026. It should be also considered that some lower grounds are possible before this final switch to the upside. Namely, some analysts are mentioning some probability that BTC might go even lower, toward the $76K, which was market low in April 2025. However, at this moment charts are pointing to some probability of $90K for the week ahead. Still, in case that dip buyers enter the scene, the next resistance at $100K, might be an easy target for BTC for the week ahead.
