BTCUSD – Downside Pressure Remains in ControlAfter a period of strong volatility, Bitcoin is entering a phase of “catching its breath” as market sentiment shifts toward a defensive stance . Short-term capital has become more cautious, while macro factors and interest-rate expectations remain unclear, failing to trigger a fresh risk-on wave. As a result, BTC is struggling to sustain meaningful rebounds.
From a technical perspective, the outlook is tilted toward a bearish trend . Price has been repeatedly rejected at the descending trendline and is currently trading below the Ichimoku cloud, confirming that sellers remain in control of the primary trend. The 88,300 zone is acting as near-term resistance, where rebounds are likely to face profit-taking and renewed selling pressure.
On the downside, 84,300 stands out as a key support level. Given the current structure, upward moves are more likely to be technical pullbacks rather than genuine reversals. If price fails to break and hold above 88,300, BTC is likely to remain under pressure and retest the 84,300 zone, or even move lower should selling momentum accelerate.
In summary, the short-term bias remains bearish. The more prudent approach is to patiently wait for pullbacks to align with the trend, rather than rushing to catch a falling knife. Bitcoin is at a critical juncture, and price reaction at key resistance levels will determine the market’s next move.
Bitcointrading

Elise |BTCUSD | 15M – Bearish Structure With Corrective PullbackBITSTAMP:BTCUSD
After strong rejection from the 92,500–93,200 resistance, BTC continued lower, breaking structure and forming new lows. The current price action shows a technical pullback from demand, supported by a minor rising channel. However, this move lacks impulsive strength and remains corrective unless price reclaims key resistance.
Key Scenarios
❌ Bearish Continuation 📉 (High Probability)
As long as price stays below 90,041:
🎯 Target 1: 88,800
🎯 Target 2: 87,690
🎯 Target 3: 86,200
✅ Bullish Recovery 🚀 (Low Probability)
Only if price breaks and holds above 90,041:
🎯 Target 1: 91,200
🎯 Target 2: 92,500
Current Levels to Watch
Resistance 🔴: 90,041 – 92,549
Support 🟢: 87,690 – 85,169
⚠️ Disclaimer: This analysis is for educational and informational purposes only. It is not financial advice. Please conduct your own research before trading.

Bitcoin - Long idea1 target is $90,500.
2 target: $92,600
3 target: $94,000
4 target: $95,200
5 target: $96,000
Final target: $98,000.
After reaching the first target, I move the stop to break even.
BINANCE:BTCUSDT.P

BTCUSDT Under Seller Control — Rallies Are for SELLBTCUSDT is entering a clear corrective phas e, with sellers firmly in control . In a market environment that remains risk-averse, recent news shows that risk capital is not yet ready to return to crypto , while macro pressure and defensive sentiment continue to dominate. As a result, Bitcoin lacks bullish momentum and is vulnerable to selling pressure at resistance levels.
On the H4 timeframe, the technical structure confirms that a bearish trend is forming and strengthening . Price has been rejected multiple times at overhead resistance and has broken below the Ichimoku cloud, signaling a clear loss of momentum. The descending trendline remains heavy above price, causing each bounce to be purely technical and quickly sold into.
In the short term, 86,500 acts as a key resistance zone. As long as BTCUSDT remains below this level, the preferred scenario is a continuation lower toward 82,000, where stronger support may trigger a reaction. Any upside pullbacks during this phase should be viewed as SELL opportunities within the trend , rather than early signs of a reversal.

Bitcoin Pauses, Bears Take the LeadIn a week packed with major economic data releases, Bitcoin is clearly shifting into a defensive mode . A cautious tone dominates the market as investors limit new positions, waiting for clearer signals from inflation data, U.S. labor reports, and central bank policy guidance . BTC slipping below the 90,000 USD mark reflects this hesitation rather than a panic-driven sell-off.
From a technical perspective, the price structure is leaning toward a short-term bearish bias . BTC has been repeatedly rejected at the descending trendline and has failed to sustain higher highs. Price is currently trading below the Ichimoku cloud, signaling that bullish momentum has weakened significantly; recent rebounds are largely technical in nature and quickly sold into, typical behavior of a market that is waiting for confirmation.
The 90,700 USD area now acts as a near-term resistance. As long as price remains capped below this level, the more probable scenario is a continuation lower toward the 86,500 USD zone—an area of key technical support where a short-term reaction may occur. In this environment, the preferred approach is to prioritize selling on pullbacks and avoid chasing long positions while the market lacks a strong catalyst.
Thank you for taking the time to consider my perspective, and I wish you successful and disciplined trading ahead.

BITCOIN - Time To Buy BTCUSD nowBITCOIN (BTC/USD) has recently been stuck inside a triangle channel pattern and has struggled to break out for a few weeks. However, the price has recently broken a strong resistance level (the white trend line shown on the chart) - The price is currently above the trend line which acted as a strong resistance level and is now very likely to hit the next resistance zone which is labeled as the take profit level. time to buy BTCUSD now!

SOL Quietly Accumulates, Waiting for the 140 BreakoutSOLUSDT currently shows the exact “signature” of a mild bullish move: not noisy, but advancing on a solid price base with clear accumulation . From a news perspective, SOL remains highly influenced by overall crypto market sentiment. As long as BTC stays stable and risk-on conditions remain moderate , Solana typically trends into a gradual recovery. That said, short-term pullback risk should still be respected , as altcoins often experience shakeouts before committing to a direction.
On the chart, price is currently compressed within a well-defined range: support around 130 and resistance near 140. Ichimoku indicates price is sitting in a short-term equilibrium zone, suggesting the market is in a force-building accumulation phase. When volatility tightens like this, the common scenario is a brief liquidity sweep to the downside, followed by a rebound to retest the upper boundary.
The most reasonable mild bullish scenario is to prioritize BUY setups on pullbacks toward 130–132, provided price shows clean holding behavior. From there, SOL is expected to push back toward 140 to test resistance. A clear break above 140 could allow the uptrend to extend further in a step-by-step advance rather than a vertical spike.
In summary, SOLUSDT is in an “accumulate to grind higher” phase . The 130 zone is the key anchor for maintaining the mild bullish outlook, while 140 is the gate that must open for further upside. The real question now is: will SOL bounce cleanly from 130 as expected, or will it need one more sweep before the move begins?

My idea on how Bitcoin can move the coming months!I will let the chart tell the story!
If we break the rising wedge top line we are set to visit the "bubble could fill zone"
Fingers crossed we break up instead of down, because that looks terrible if we do!

BTC Isn’t FOMO — But It’s Not Ready to Drop EitherIf we look at BTC right now as a tug-of-war, the buyers are winning slightly — and consistently . Recent news continues to support a moderate risk-on environment , institutional capital has not exited Bitcoin , and the market lacks a shock strong enough to trigger a deep sell-off. As a result, the most reasonable scenario over the next 1–2 days is a gradual, controlled upside rather than a sharp vertical breakout.
From a technical perspective, the overall trend still leans bullish . Price is holding above a rising trendline and continues to find support on pullbacks. The 90,000 level stands out as a key psychological support and has repeatedly acted as a reliable base for rebounds. Ichimoku analysis shows price hovering around short-term equilibrium, suggesting the current move is more about accumulation and slow continuation than an aggressive rally.
The plan for a mild bullish bias is clear: prioritize BUY setups on pullbacks toward the 90,000–90,300 zone, especially if price shows strong holding behavior. If BTC regains momentum and stabilizes above this area, the next upside target sits near 94,000 as the upper resistance zone. Conversely, a clean break below 90,000 would weaken the bullish-light scenario and increase the likelihood of a deeper pullback for renewed accumulation.
In short, BTCUSDT is in a healthy, moderate bullish phase — not euphoric , but structurally supported. The real question now isn’t “will it go up?”, but rather: will you wait for a clean pullback to 90,000 for a safer entry, or step in as price starts pushing higher?

How Investment Funds Really Make Money From Bitcoin📰 After years of closely following financial markets, one conclusion has become impossible for me to ignore:
most people fundamentally misunderstand how professional funds make money from Bitcoin.
Retail traders often assume funds operate the same way they do — buying low, selling high, and betting on direction.
If price goes up, they win.
If price goes down, they lose.
That assumption is overly simplistic — and largely incorrect.
🔍 For institutional funds, Bitcoin is not a directional gamble.
From what I’ve observed, large funds are not emotionally attached to whether Bitcoin rises tomorrow or drops next week.
Price direction is not their primary concern.
What truly matters is structure.
Funds are not rewarded for guessing the market correctly.
They are rewarded for controlling risk and systematically converting volatility into measurable returns.
🎯 Their real objective is volatility, not conviction.
When a fund allocates capital to Bitcoin, it is rarely driven by belief in a narrative or excitement around headlines.
They don’t follow influencers.
They don’t react to social media hype.
What they care about is quantifiable price movement.
Volatility is the raw input.
Mathematical models are the engine.
Decisions are driven by numbers, not emotions.
🧠 Buying Bitcoin does not automatically mean being bullish.
One of the most common misconceptions I encounter is the idea that institutional buying signals an expectation of higher prices.
In reality, a fund can purchase Bitcoin while remaining entirely neutral.
They can be delta-neutral, fully hedged, detached from market direction, and protected against both upside and downside moves.
This is why buying BTC is not a bet for them.
It is simply the first layer in a multi-stage trading structure.
📊 So how do funds actually profit from price movement?
By combining spot exposure with derivatives, funds build positions that benefit from movement itself rather than predicting direction.
When price rises, positions are adjusted and partial exposure is sold at higher levels to rebalance risk and lock in gains.
When price falls, exposure is rebuilt at lower prices to restore balance.
🔁 Price moves higher → exposure is reduced at better levels
🔁 Price moves lower → exposure is increased at cheaper levels
🔁 The process repeats with discipline and precision, free from emotion
This systematic process is known as gamma scalping — the quiet, continuous profit mechanism behind institutional trading.
💰 Where do their real profits come from?
Not from news headlines.
Not from influencers.
Not from ETF narratives.
Profits are generated through continuous hedge adjustments, realized volatility exceeding expectations, direction-neutral structures, and strict mathematical discipline.
⛔ The only environment that truly challenges these strategies is when the market stops moving altogether.
🧭 Let me be direct with you, speaking as a market professional.
You are not BlackRock.
You do not have their infrastructure.
You do not have their capital, execution speed, or risk frameworks.
Attempting to interpret or replicate their actions without understanding the underlying structure will not improve your trading — it will only increase confusion.
✍️ My conclusion is straightforward:
Funds do not profit from predicting the future.
They profit from engineering outcomes.
They do not trade stories.
They do not trade emotions.
They do not trade social media noise.
🎯 They trade structure.
And you?
Stop obsessing over what institutions are doing.
Start focusing on what you should be doing.
That is the line between surviving in the market
and being quietly pushed out of it.

How Funds Actually Make Money From BitcoinIf you spend more than five minutes on Crypto TikTok (YouTube or X are not much different), you’d think the entire market depends on:
- who “bought the dip,”
- who “sold the top,”
- and which whale “decided” to pump or dump.
The screamers with flashy thumbnails and zero understanding yell:
- “BlackRock is buying—BULLISH!”
- “Whales are selling—CRASH INCOMING!”
- “Institutions are entering the market!!!”
- No nuance.
- No structure.
- No clue.
Because here’s the truth:
What BlackRock buys or sells is almost irrelevant to you.
Funds do not make money the way TikTok believes.
They don’t need Bitcoin to go up.
They don’t need Bitcoin to go down.
They need one thing:
Movement. Volatility. Math.
Let’s destroy the hype and show how funds actually make money.
1. Why “BlackRock is buying BTC” tells you absolutely nothing
Retail sees a headline:
“ETF inflows: +5,000 BTC today!”
And jumps to conclusions:
“They know something!”
“Price HAS to go up!”
“Institutions are bullish!”
No.
A fund can buy BTC and still be:
- 100% hedged
- delta-neutral
- directionally flat
- risk-neutral
- fully protected against price movement
The purchase is not a bet.
It’s a component of a structured position.
Buying BTC is just Step 1.
What matters is Step 2, 3, 4, 5…—all the parts TikTok doesn’t even know exist.
2. Why TikTok “analysts” have no idea what they’re talking about
If someone:
- screams in every video,
- says “bullish” or “bearish” 40 times a minute,
- thinks “institutions pump price,”
- doesn’t know what delta, gamma, basis, hedging, ATM straddles are…
…then they are not explaining institutional flow.
They are farming views and likes, not teaching markets.
Let’s be blunt:
If you can’t explain a delta-neutral hedge, your opinion about what BlackRock “plans to do” or "is doing" is worthless.
So let’s walk through how a real fund uses BTC to print money without caring if price goes up or down.
3. How a real fund makes money from volatility (step-by-step, using $100,000 BTC)
Assume:
- BTC price = $100,000
- A fund wants exposure to volatility, not direction
- They buy a BTC ATM straddle (call + put at 100k)
- Delta ≈ 0
- Gamma > 0 → the part that generates money
- They also own BTC spot for hedging.
- Let’s say the fund holds 1 BTC worth $100,000 as inventory for hedge adjustments.
At the start:
Delta-neutral. No directional risk.
Now let’s see how they profit.
Step 2 – BTC goes up 10% → $110,000
Straddle delta becomes +0.5 BTC.
The fund is unintentionally long 0.5 BTC.
To go back to neutral:
The fund sells 0.5 BTC at $110,000.
Cash received:
0.5 × 110,000 = $55,000
Theoretical cost basis (100k):
0.5 × 100,000 = $50,000
👉 Profit from hedge = $55,000 – $50,000 = $5,000
Plus, the straddle increased in value due to volatility.
Step 3 – BTC drops 10% → $90,000
Now straddle delta flips negative: –0.5 BTC
To get back to neutral:
The fund buys 0.5 BTC at $90,000.
Cash paid:
0.5 × 90,000 = $45,000
If they later sell that BTC at the baseline of 100k:
👉 Profit = $50,000 – $45,000 = $5,000
Again, without needing BTC to go up or down, “as predicted.”
This is called:
Gamma scalping — the quiet, relentless engine behind institutional P&L.
Up move → sell high.
Down move → buy low.
Repeat. Print. Sleep.
4. Where does the REAL profit come from?
A fund earns from:
- hedge adjustments (buy low, sell high, but mathematically—not emotionally)
- straddle appreciation as realized volatility exceeds implied volatility
- basis differences between spot and futures
- neutrality to direction, allowing consistent compounding
They make money even if Bitcoin swings between 95k–105k for weeks.
The only time they lose?
When BTC does NOT move.
Because then the straddle premium decays.
That's it.
Nothing to do with faith, predictions, narratives, influencers, or ETF flows.
5. So why should YOU ignore what BlackRock is doing?
Because:
- You are not BlackRock.
- You do not run a delta-neutral book.
- You do not make money from gamma exposure.
- You do not scalp intraday hedges on $100M positions.
- You do not capture basis spreads across spot and derivatives.
- You do not have a trading desk rebalancing risk every hour.
But the TikTok screamers will still tell you:
“Institutional buying = bullish!”
“Institutional selling = bearish!”
“Whales know something!”
They don’t know anything.
Especially not about institutional structure.
So here’s the punchline:
Watching what funds do—without understanding why they do it—is the fastest path to confusion in the best case and destruction in the worst.
You don’t have their:
- tools,
- capital,
- execution speed,
- risk models,
- mandate,
- or mathematical framework.
So trying to mimic them is not just pointless —it’s dangerous.
Final Lesson: Ignore the noise, ignore the hype, ignore the TikTok parade.
BlackRock doesn’t care about bull markets or bear markets.
BlackRock doesn’t need Bitcoin to moon.
BlackRock doesn’t panic when Bitcoin drops.
Because BlackRock doesn’t trade the story.
They trade the structure.
And unless you operate like a fund — stop pretending their moves matter to your trading.
You’re not them.
You don’t have their machinery.
You don’t have their volatility book.
So:
Stop watching what institutions do.
Start understanding what you should do.
That’s the difference between surviving and blowing up.
P.S: BlackRock and TikTok are used just as an example:)

Bitcoin chart analysisBitcoin chart analysis. Its simple and easy analysis, you can easily understand
lines and boxes are support / resistance.

BITCOIN - Buy nowBITCOIN (BTC/USD) has recently been stuck inside a triangle channel pattern and has struggled to break out for a few weeks. However, the price has recently broken a strong resistance level (the white trend line shown on the chart) - The price is currently above the trend line which acted as a strong resistance level and is now very likely to hit the next resistance zone which is labeled as the take profit level. buy bitcoin!

Elise | BTC/USD — 30M | Demand Reaction → Re-Accumulation SetupBITSTAMP:BTCUSD
Current positioning favors a short-term bullish retracement as long as price holds above the demand block & ascending trendline. Structure shows strength in demand, but momentum upside needs confirmation via break above 91.000. Liquidity above 92.275 remains unfilled — a magnet for price.
Key Scenarios
🟢 Bullish Case — Primary Setup 🚀
Holding above Demand Block (87.8k–88.8k) →
🎯 Target 1: 91.000 micro-breakout
🎯 Target 2: 92.275 liquidity fill
🎯 Extended Target: 94.110 HTF liquidation zone
❌ Bearish Invalidation
Break below demand block →
🎯 87.000 → Deeper sweep & redistribution possible
Current Levels to Watch
Resistance 🔴: 91.000 → 92.275
Support 🟢: 88.800 → 87.800 demand base
⚠️ Disclaimer: This analysis is for educational purposes only. Not financial advice.

Funds Are Coming Back – Will BTC Surge?Hello traders, wishing you a great day! Let’s take a look at BTCUSDT together.
If we had to name one asset that is recovering after a storm and starting to attract capital again, Bitcoin is definitely the leading candidate right now. Expectations that the Fed will soon cut interest rates are bringing risk appetite back , the USD is cooling down, and part of the capital flow is returning to crypto – therefore BTC has a solid chance to recover after the sharp drop at the end of November.
On the 12H chart, BTC remains inside a downward channel , but is moving steadily above the short-term support around 85,700, which is marked as Immediate support . The current pullback is mainly a pause to regain momentum after the first rebound, without breaking the latest lows , and is showing signs of forming a higher low.
If price continues to hold above 85,700 and forms an accumulation pattern as projected, the resistance zone 93,900 near the upper boundary of the channel and the Ichimoku cloud will be the next natural target.
Given that macro news is gradually supporting risk assets and technical signals show weakening selling pressure, I personally prefer the scenario where BTC continues to recover toward 93–94k , rather than breaking support immediately.

BITCOIN - Time to buyBITCOIN (BTC/USD) has recently been stuck inside a triangle channel pattern and has struggled to break out for a few weeks. However, the price has recently broken a strong resistance level (the white trend line shown on the chart) - The price is currently above the trend line which acted as a strong resistance level and is now very likely to hit the next resistance zone which is labeled as the take profit level. Time to buy bitcoin!

Silent Waves Before the Surge The current BTCUSD structure shows the market completing a major impulsive wave, followed by a corrective phase that is still unfolding. The correction has taken the form of overlapping subwaves, suggesting consolidation rather than a sharp reversal.
Within this corrective movement, smaller waves are building a base that could serve as the foundation for the next impulsive leg. The pattern indicates that the market is preparing for renewed momentum once the corrective sequence is fully exhausted.
The overall wave count continues to favor a bullish continuation scenario, provided the corrective structure resolves in alignment with classical Elliott principles. Traders should watch for the transition from consolidation to impulse as the next defining move.

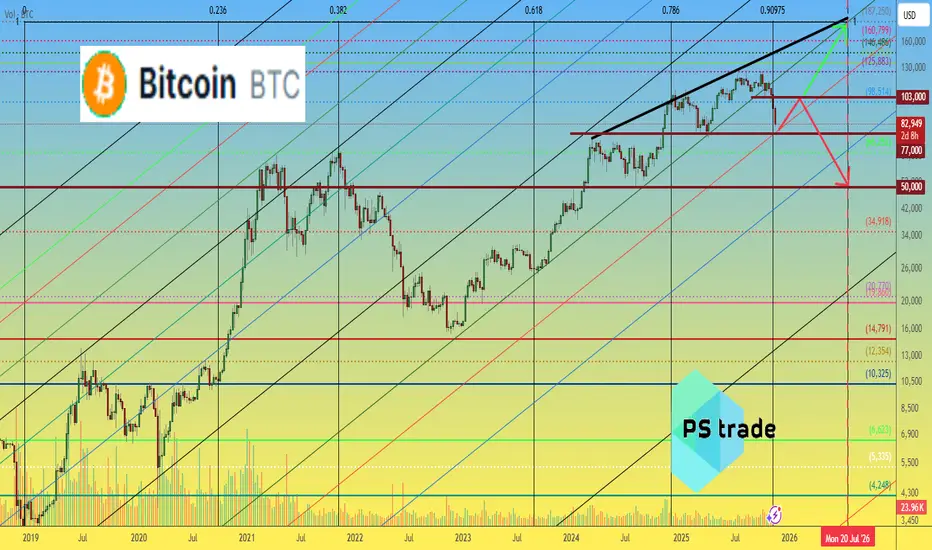
Bitcoin BTC price analysis until mid-2026The long-term CRYPTOCAP:BTC trend (2023 → Nov 2025) has either broken its structure or expanded into a wider channel.
The next few weeks will be critical for determining the macro direction for OKX:BTCUSDT price
Key zones:
• 🔻 Support: $75,000–$77,000
• 🔺 Resistance: $103,000–$105,000
A breakout of one of these ranges is likely to define Bitcoin’s trajectory into mid-2026 — either toward $190K or a deeper pullback toward $50K.
🤔 What’s the more probable scenario on your chart — bullish expansion or a structural breakdown?
______________
◆ Follow us ❤️ for daily crypto insights & updates!
🚀 Don’t miss out on important market moves
🧠 DYOR | This is not financial advice, just thinking out loud
BTCUSD 30m — Trend Continuation Sell Setup | Smart Money FlowBITSTAMP:BTCUSD
After a strong liquidity grab at 93,900, price distributed inside the range and then broke structure to the downside.
BTC formed a lower high and respected the bearish trendline, confirming sellers in full control.
Market is now retesting the 89,800 – 90,200 flip zone which aligns with bearish continuation.
🔻 Bearish Case (Primary Setup)
Entry Zone: 89,800 – 90,200
🎯 Target 1: 88,261
🎯 Target 2: 83,880 (Sell-side Liquidity wipe)
❌ Invalidation: Break above 91,800 (range re-entry)
Market Structure Notes:
Liquidity swept at range high
Break of demand → resistance flip
Trendline guiding continuation lower
⚠️ Disclaimer: Educational analysis only — not financial advice

Big Money Is Pouring Into SOL – Is a Breakout Coming?When large capital starts flowing into Solana , SOLUSDT is no longer just another altcoin — it’s becoming a new safe haven for risk-on liquidity. Forward Industries recently announced that it now holds over 6.9 million SOL , making it one of the largest Solana treasuries in the world — a clear sign that institutional players are not just talking, but actually deploying capital.
On the technical side, the chart shows that SOL has broken away from its bottom structure and is now holding beautifully above the Ichimoku cloud. The area around 138 USDT has emerged as a new support zone: price has retested it multiple times without breaking, turning it into a solid base for accumulation. The current structure of higher lows confirms that buyers are still in control of the trend.
The most bullish scenario: SOLUSDT continues to consolidate above 138, compressing like a spring, before making a push toward the 153 USDT resistance area — exactly as projected on the chart. As long as price stays above 138 and the Ichimoku cloud remains below, the priority remains to buy dips, not to fight the trend.
In short, institutional inflows combined with a strong technical structure suggest that SOLUSDT is in a healthy, sustainable uptrend , and the current pullback looks more like an opportunity to enter, rather than a sign of weakness.

Bitcoin Comes Back to Life! Buyers Return With Full PowerIf I had to name a “warrior rising from the storm” , it would be BTCUSDT right now. After plunging to the 84k region, Bitcoin has just staged an almost 7% rebound back toward 93k, accompanied by news that big money from Wall Street is flowing back into crypto and overall fear in the market is calming down. The USD is no longer overly strong, and Bitcoin is once again being mentioned as a key gauge of market risk appetite .
Looking at the 12H chart, BTC has broken back above the bottom of the long-term descending channel and is now pushing into the Ichimoku cloud. This rebound isn’t a “spike and die” pattern — it’s a sequence of steady bullish candles with shallow pullbacks , showing that buyers are firmly in control. The scenario is becoming clearer: price may pull back to around 90,500 to gather liquidity and retest the cloud edge, before potentially bouncing toward the higher resistance region around 107,300 — the next equilibrium zone of the trend.
With the supportive news flow (institutional money re-entering, market accepting a new price base after the drop) and a technical structure showing BTC has temporarily escaped the free-fall phase , I remain biased toward buy-the-dip setups . The plan is to wait for short pullbacks for entries rather than trying to sell against a recovering bullish wave that’s clearly being “revived”.

Bitcoin's Next Move: What 4 Timeframes Reveal Right NowWeekly
A sustained move through the key resistance on this timeframe at105,000 to 110,000, could confirm a reversal. For now, the weekly outlook shows a potential market in correction rather than reversal.
Daily
After dropping nearly 5% yesterday, Bitcoin has rebounded sharply today with a gain of about 6.7%. The price is currently up $5775 at $92,060. Today’s low at $86,190 followed yesterday’s deeper dip to $83,814. The daily chart may suggest further upside potential.
4H
Momentum on RSI has turned higher on the 4-hour chart, lifting from oversold conditions and breaking back above the midline. This suggests improving intraday demand and provides a base for further upside if price continues to hold above the recent breakout level. The next resistance sits around 96,500, the prior swing high on this timeframe.
1H
The hourly timeframe shows the price bouncing back above the 50, 100 and 200-hour moving averages, which are currently clustered around $87,500 and $89,320. If the price stays above these converged moving averages, it can signal continued buying pressure in the near term.

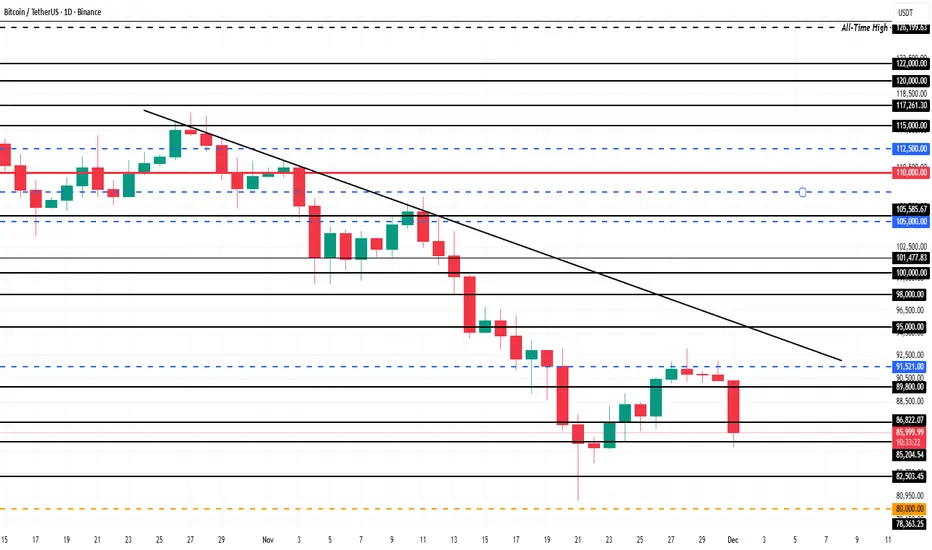
Bitcoin Price Falls To $86,000; Will It Shake Out Weak Hands?Bitcoin is trading at $86,005, holding just above the $85,204 support level. The asset remains trapped under a persistent downtrend that has lasted more than a month. This would preventing any sustained recovery attempts.
If market conditions worsen or short-term holder selling accelerates, Bitcoin could break below $85,204. A drop through this support would expose the price to $82,503 and potentially deepen losses as fear rises across the market.
However, if buyers step in and support strengthens, Bitcoin could reclaim upward momentum. A bounce from current levels could send BTC toward $89,800. A decisive move above that resistance would be essential for Bitcoin to retest $90,000 and invalidate the bearish thesis.