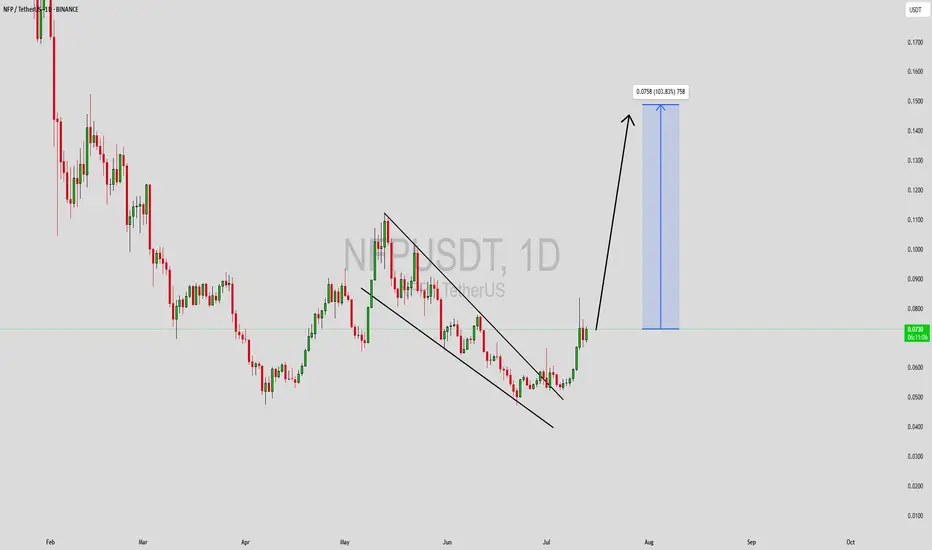
NFPUSDT Forming Descending ChannelNFPUSDT is starting to attract significant attention as it shows signs of reversing its downward trend with a promising technical setup. This crypto pair has recently broken out of a descending channel, indicating that selling pressure might be subsiding while buyers are stepping in. The price structure suggests a clear path for a potential bullish continuation, and the projected target hints at a strong gain of around 90% to 100%+. Technical traders are closely watching this level for a confirmed breakout and a sustained rally.
The volume on NFPUSDT remains good, showing that liquidity is healthy and there’s active participation from traders and investors. This is a critical factor in validating the breakout — when volume aligns with price action, the odds of a strong move increase. Many crypto traders rely on these confirmation signals to enter early positions, capturing the momentum as it picks up. With the market sentiment slowly shifting, NFPUSDT could see an influx of new interest in the coming weeks.
Investors are increasingly taking interest in this project, not just from a technical perspective but also due to its fundamentals and community engagement. As the crypto market looks for solid setups in a sea of volatility, pairs like NFPUSDT stand out for their clear patterns and realistic upside potential. Keep an eye on support levels holding firm and whether the breakout candle closes above resistance with strength.
✅ Show your support by hitting the like button and
✅ Leaving a comment below! (What is You opinion about this Coin)
Your feedback and engagement keep me inspired to share more insightful market analysis with you!
Bitcointrading
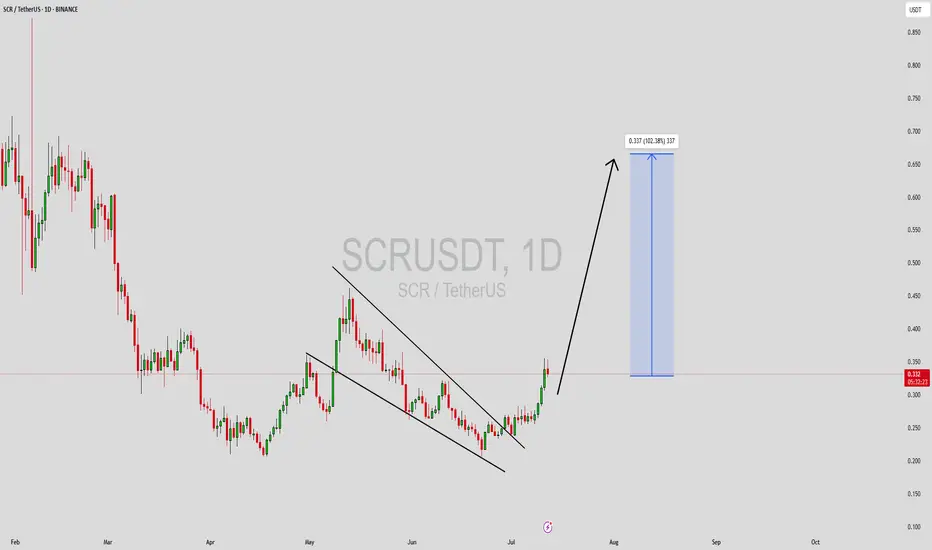
SCRUSDT Forming Descending TriangleSCRUSDT is catching the attention of smart traders as it shows signs of a strong bullish setup supported by increasing trading volume. This pair has recently seen consistent accumulation phases, which often precede significant price moves. With expectations for a potential 90% to 100%+ gain, SCRUSDT could deliver impressive returns for investors who position themselves early. Traders who are tracking fresh breakout opportunities should keep this crypto on their watchlist as buying interest grows across key support levels.
The underlying fundamentals of the SCR project are also becoming more appealing, helping fuel this recent investor interest. As the team behind SCR continues to develop its ecosystem, more market participants are gaining confidence in its long-term growth potential. The robust on-chain activity and positive community sentiment further add to the bullish outlook. It’s encouraging to see that the volume profile supports the price action, indicating that this isn’t just a speculative pump but rather a move backed by solid participation.
Technically, SCRUSDT is forming a reliable base that could launch the next leg up once a breakout above the recent resistance levels is confirmed. Traders should watch for strong bullish candles and increasing volume near breakout points to validate the move. Risk management remains key—placing stop-losses under nearby swing lows can help manage downside risk while targeting the anticipated upside potential.
✅ Show your support by hitting the like button and
✅ Leaving a comment below! (What is You opinion about this Coin)
Your feedback and engagement keep me inspired to share mo
HUMAUSDT Forming Falling WedgeHUMAUSDT is displaying a promising falling wedge pattern, which is widely recognized by traders as a powerful bullish reversal setup. This pattern suggests that the coin may be nearing the end of its consolidation phase, setting the stage for a potential breakout with significant upside. Backed by good trading volume, this scenario looks increasingly likely, with price targets pointing to an impressive gain potential of 140% to 150% in the medium term.
The Huma project is steadily gaining traction among crypto investors due to its innovative use cases and expanding community. As the DeFi ecosystem evolves, projects like Huma that focus on human-centric decentralized solutions are getting more recognition. With growing investor confidence, HUMAUSDT could become one of the standout performers in the altcoin market, especially if the current technical structure plays out as expected.
From a technical perspective, the falling wedge pattern is characterized by descending resistance and support lines converging towards a breakout point. When price finally breaches the upper trendline with convincing volume, it often sparks a rapid upward move as short positions get squeezed and new buyers jump in. Traders should watch for a daily close above resistance and monitor volume levels to validate the breakout.
✅ Show your support by hitting the like button and
✅ Leaving a comment below! (What is You opinion about this Coin)
Your feedback and engagement keep me inspired to share more insightful market analysis with you!

#BTC Update #6 – July 11, 2025🟠 #BTC Update #6 – July 11, 2025
Bitcoin has surged nearly 9% from the supply zone and is currently trading around the $119,000 level. However, looking at the current volume, the momentum seems to be fading.
If a correction takes place, the potential support zones are:
✨First stop: $114,000
✨Second stop: $113,000
✨Third stop: $111,500
After a pullback, the next target may be around $122,000. However, macroeconomic risks are rising. The U.S. is considering a 500% tariff on Russia imports, and in the past, even a 100% tariff triggered a sharp drop in Bitcoin.
Since BTC has already made a significant move up, I don’t think opening a Long or Short position is wise at the moment. Just observing for now.

REIUSDT Forming Falling WedgeREIUSDT is showing an encouraging technical setup that could pave the way for a potential price breakout. The pair has recently formed a classic falling wedge pattern, which historically signals a bullish reversal. Backed by healthy trading volume, this setup suggests that investors are positioning themselves early for what could be a significant upside move. With an expected gain of 60% to 70%+, REIUSDT is attracting the attention of traders who look for hidden gems in the altcoin market.
The REI Network project continues to gain recognition for its focus on creating a lightweight and high-performance blockchain, appealing to developers and users who value efficiency. This growing ecosystem and its active community are contributing to increased buying interest and renewed confidence in its long-term potential. Such fundamentals, combined with supportive technical signals, make this pair a strong candidate for swing trades in the coming weeks.
Technically, traders should watch for a decisive breakout above the wedge resistance line, which could trigger rapid price action towards the projected targets. Monitoring volume spikes and daily closes will be crucial in validating the strength of this breakout. As momentum builds, REIUSDT could deliver solid gains for traders who are prepared and patient with their entries.
✅ Show your support by hitting the like button and
✅ Leaving a comment below! (What is You opinion about this Coin)
Your feedback and engagement keep me inspired to share more insightful market analysis with you!

MDTUSDT Forming Bullish ReversalMDTUSDT is currently capturing the attention of crypto traders who are searching for high-risk, high-reward setups in the altcoin market. The chart shows MDTUSDT forming a clear falling wedge pattern that has now been broken to the upside, indicating a strong bullish reversal signal. With good volume supporting this breakout, the technical structure suggests that a massive price move could be on the horizon if momentum continues to build.
What’s particularly interesting about MDTUSDT is the significant upside potential traders are targeting, with an expected gain in the range of 190% to 200%+. This aligns with the measured move from the wedge pattern, giving bulls confidence that the current breakout could translate into sustained upward price action. As more traders recognize this setup, we could see increased buying pressure pushing MDTUSDT higher.
Investors are also showing renewed interest in the MDT project, adding a layer of fundamental support to the technical outlook. This blend of solid technicals and growing investor confidence makes MDTUSDT a compelling pick for anyone looking to catch a strong altcoin rally. Keep a close eye on follow-through volume and key resistance levels to confirm the strength of this breakout move.
✅ Show your support by hitting the like button and
✅ Leaving a comment below! (What is You opinion about this Coin)
Your feedback and engagement keep me inspired to share more insightful market analysis with you!

WIFUSDT Forming Breakout Descending ChannelWIFUSDT is showing an exciting technical setup as it breaks free from a prolonged downward channel and consolidates near a strong support zone. This breakout pattern signals that the coin could be on the verge of a significant trend reversal, supported by healthy trading volume and renewed investor confidence. With buyers defending key levels and pushing the price above resistance, WIF is capturing the attention of traders looking for high-momentum plays.
Looking at the chart, WIFUSDT’s recent price action suggests that the base has formed well within the highlighted demand zone, providing a solid foundation for a sharp upward move. The breakout from the descending channel is a classic sign of trend change, and this technical shift is further reinforced by steady volume and bullish sentiment across social platforms. Traders should keep an eye on retests of the breakout zone for potential entry opportunities, as these could offer excellent risk-to-reward setups.
The potential gain of 140% to 150%+ makes WIFUSDT a top pick for those scanning the market for trending coins with breakout potential. The meme coin community remains highly active around WIF, and this fresh surge in interest could propel the coin to test its next major resistance levels in the coming weeks. As always, risk management and closely monitoring price action will be key to riding this bullish wave successfully.
✅ Show your support by hitting the like button and
✅ Leaving a comment below! (What is You opinion about this Coin)
Your feedback and engagement keep me inspired to share more insightful market analysis with you!

TOKENUSDT Forming Bullish WaveTOKENUSDT is currently displaying a promising bullish wave pattern that is catching the attention of traders looking for steady and reliable gains in the crypto market. The pair has shown consistent volume, indicating strong market participation and growing investor interest. While the expected gain of 10% to 20% may seem modest compared to some high-flying altcoins, this setup offers a more stable opportunity for those who prefer lower-risk trades with a clear technical structure.
The current price action suggests that TOKENUSDT is forming higher highs and higher lows, which is a classic sign of a bullish wave continuation. Many traders appreciate this pattern for its clear entry and exit levels, making it easier to manage risk and lock in profits. As the crypto market remains volatile, having a well-structured pair like TOKENUSDT in your watchlist can help diversify your trading portfolio and balance out more aggressive plays.
With a healthy support zone and steady upward momentum, TOKENUSDT has the potential to break through minor resistance levels and deliver the projected gains in the near term. Investors should watch for confirmation candles and spikes in buying volume to validate this bullish scenario. This crypto pair’s relative stability and clear pattern make it an appealing choice for swing traders and trend followers alike.
✅ Show your support by hitting the like button and
✅ Leaving a comment below! (What is You opinion about this Coin)
Your feedback and engagement keep me inspired to share more insightful market analysis with you!

Something for the weekend? Bitcoin Daily-last for 2 weeks
PA has finally risen above that Fib circle ( falling diagonal arc) that has rejected us since Early June.
PA is currently retesting this as support now and we will hopefully manage to remain above.
Should this fail, we have the lower trendline of the newly formed rising channel to use as support.
Should that fail, we have the 236 Fib circle (Red) and the next rising support line around 102k, depending on sharp the drop is.
If we find support where we are now, we have a good run back to the current ATH line ( Blue Dash line)
The real test is that 236 Fib circle that is dropping form around 114K
99% of the Time, a 236 Fib circle is resistance and if it rejects PA, the Current ATH line is very close below.
This will either create a bounce or a sharp drop. If we get stuck between the 2, we have that APEX around 25 July..PA always reacts BEFORE the Apex
And I am back on the 19th Jully, just in time I hope ;-)
So, The MACD is currently above neutral on the Daily (Below)
The weekly is much the same but on the 4 hour, we are currently dropping towards Neutral and Tomorrow ( sunday) will tell us if it bounces or not.
We are early in July, As mentioned in the monthly report I posted earlier this week, we could see a larger Green candle by month end, though is is not a promise obviously.
But the MACD could support this idea
We just have to wait and, for me, that is what we will do until around Q4
We could still see smaller gains over the summer period but the Bigger moves are in Q4
That is what I am waiting for....and yet, at the same time, I am ready if it comes earlier
stay safe

SANDUSDT Forming Bullish ReversalSANDUSDT is showing a promising technical setup that could attract more attention in the coming days. The chart clearly highlights a well-defined downward channel which many traders recognize as a potential bullish reversal zone, similar to a falling wedge pattern. The good trading volume adds more conviction to this setup, indicating that larger market participants may already be accumulating positions before a breakout. A projected gain of 70% to 80%+ could be realistic if this breakout plays out as expected, making it an exciting watch for swing traders and investors.
The Sandbox (SAND) project has been a popular topic in the crypto community thanks to its role in the metaverse and NFT ecosystems. With the broader market showing signs of recovery and investors regaining confidence, altcoins with strong fundamentals and favorable technical structures like SANDUSDT could outperform. Traders will want to monitor key resistance levels along the descending trendline for confirmation of a breakout, while also keeping an eye on rising volume to validate momentum.
Community sentiment and on-chain data suggest that interest in SAND is steadily picking up again. This aligns perfectly with the technical picture, offering a solid blend of narrative and chart strength. As more traders and investors look for the next big mover, SANDUSDT could easily become a standout performer if this pattern confirms. Always manage risk properly and watch for any signs of rejection to adjust your strategy accordingly.
✅ Show your support by hitting the like button and
✅ Leaving a comment below! (What is You opinion about this Coin)
Your feedback and engagement keep me inspired to share more insightful market analysis with you!

ORDIUSDT Forming Falling WedgeORDIUSDT is shaping up to be one of the more compelling opportunities on the crypto charts right now. The pair is forming a classic falling wedge pattern, which is widely regarded as a strong bullish reversal setup when spotted after a prolonged downtrend. This pattern often signals that selling pressure is fading and buyers are preparing to take control. With good volume building up, it’s clear that investors and traders are taking renewed interest in this project as it nears a potential breakout zone.
What makes ORDIUSDT even more interesting is the promising upside it could deliver if this falling wedge pattern confirms as expected. A projected gain of 70% to 80%+ makes this setup especially attractive for swing traders looking for medium-term positions with solid reward-to-risk ratios. The broader market sentiment is shifting, and coins with technically strong reversal setups like ORDIUSDT often outperform during such phases.
The community buzz and on-chain activity surrounding ORDI is also gaining traction, which adds further confidence to this bullish scenario. Many traders see the confluence of technical signals and increasing investor interest as a sign that this pair could soon break above its descending resistance line and rally aggressively. Keeping an eye on key resistance levels and volume spikes will be crucial to spot the right entry point.
✅ Show your support by hitting the like button and
✅ Leaving a comment below! (What is You opinion about this Coin)
Your feedback and engagement keep me inspired to share more insightful market analysis with you!

BONKUSDT Forming Bullish BreakoutBONKUSDT is showing some exciting bullish signs as it pushes out of a prolonged downtrend with a clear breakout setup. The chart you see highlights how this pair has been consolidating within a tight range and now seems ready to surge higher. With good volume supporting the current move, BONK is catching the eyes of traders looking for undervalued coins that have the potential for rapid upside. The price action shows a textbook breakout above resistance levels, which is often the first step for a sustained rally in the crypto market.
This pair has already attracted attention due to its unique community-driven nature and meme coin appeal, which tends to create sudden spikes when momentum builds up. As BONKUSDT attempts to deliver an expected gain of 90% to 100%+, it becomes an appealing choice for short-term swing traders and high-risk, high-reward portfolios. Many investors are betting on its potential to break through key price levels, which could trigger a wave of fresh buying volume.
As the crypto market continues to reward coins that demonstrate both technical strength and community hype, BONKUSDT stands out as one of those trending assets that could surprise to the upside. With a clear breakout from its falling wedge structure and the market sentiment turning positive, traders should keep a close eye on how it behaves around its current levels. Any strong candle closures above resistance could pave the way for an accelerated move.
✅ Show your support by hitting the like button and
✅ Leaving a comment below! (What is You opinion about this Coin)
Your feedback and engagement keep me inspired to share more insightful market analysis with you!

AWEUSDT Forming Bullish TrendAWEUSDT is gaining momentum among traders as it shows signs of a promising breakout from its recent consolidation zone. The chart highlights how the price has tested a key support zone multiple times and has now begun to push upward with increasing volume, suggesting that accumulation is taking place. This healthy volume is often the first sign that smart money is entering the market, laying the groundwork for a sustained rally.
Currently, technical indicators point towards a short-term bullish trend with a potential gain of 30% to 35%+. Such a move could be fueled by the break above the highlighted accumulation area, which has acted as a solid base for this possible upside. Traders looking for opportunities in altcoins with clear risk-to-reward setups will find AWEUSDT’s structure attractive as it shows a balance of stability and momentum.
Adding to the optimism is the fact that more investors are showing interest in this project, hinting at improving sentiment and stronger fundamentals. As the market sentiment improves, coins like AWEUSDT with good liquidity and technical patterns often lead the way for short but impactful moves. It’s a setup worth monitoring closely for swing traders who thrive on these breakout opportunities.
✅ Show your support by hitting the like button and
✅ Leaving a comment below! (What is You opinion about this Coin)
Your feedback and engagement keep me inspired to share more insightful market analysis with you!

ARPAUSDT Forming Falling WedgeARPAUSDT is drawing fresh attention from crypto traders as it forms a classic falling wedge pattern on the daily timeframe. This technical pattern is widely recognized as a strong bullish reversal signal when backed by healthy volume and growing investor interest. The falling wedge indicates that the downtrend is losing momentum, and a breakout to the upside could trigger a significant move. With current market dynamics, ARPAUSDT is showing promising signs that it could deliver an expected gain of 80% to 90% or more once this pattern resolves.
Good volume levels in recent sessions confirm that accumulation is happening quietly, which is often the case before a breakout from a wedge pattern. Traders looking for high-probability setups should keep an eye on the breakout zone around the wedge’s upper trendline. A confirmed close above this resistance with increased volume could be the catalyst for a strong rally. ARPA’s fundamentals, coupled with positive sentiment from investors taking interest in the project, add extra fuel to the potential upside.
As more altcoins regain momentum, ARPAUSDT stands out as one of the most interesting pairs to watch for short- to mid-term gains. Technical traders and pattern-based investors often target these setups to capture explosive price action. Staying patient for a clean breakout and using proper risk management will be crucial to maximize the reward potential in this setup.
✅ Show your support by hitting the like button and
✅ Leaving a comment below! (What is You opinion about this Coin)
Your feedback and engagement keep me inspired to share more insightful market analysis with you!

BTC: Price to 134,500$ , FVG, Fib 0.5 and 0.618 ratio ?Price to 134,500$:
Bitcoin is now moving in a triangle pattern, which is getting smaller. The price is around $107,758. Here is possible move is a breakout to the downside first, where the price may drop to fill the "Fair Value Gap" area, which is marked in purple. This area is between the Fibonacci levels of 0.5 and 0.618. After that, Bitcoin could go up again and reach the price of $134,000.
Trade Ideas:
I marked 2 areas with arrow let the price reach here and wait for confirmation in both areas. Specially in Fair Value Gap area.
Trade Signal:
I will provide both trade signal here so follow my account and you can check my previous analysis regarding BITCOIN. So don't miss trade opportunity so follow must.
BINANCE:BTCUSDT BITSTAMP:BTCUSD COINBASE:BTCUSD COINBASE:BTCUSD BINANCE:BTCUSDT.P CRYPTO:BTCUSD BYBIT:BTCUSDT.P BINANCE:BTCUSD

Bitcoin Faces Impending Drop to Mid-30,000sAs of July 02, 2025, Bitcoin’s price chart, crafted by "RoadToAMillionClub" on TradingView, paints a concerning picture. Currently hovering at $107,831, the cryptocurrency appears to be teetering at the edge of its upper channel, signaling potential trouble ahead. The recent 0.51% dip may be just the beginning of a more significant decline.
The long-term upward trend, marked by a supportive orange line since 2018, has been a beacon for bulls. However, the green trend line projecting a drop toward the mid-30,000s range, around $37,932, suggests a looming correction. This level, a historical support zone, could become the next battleground as selling pressure mounts.
Market indicators point to overextension, with the price hitting a 4-day and 14-day high of $107,831 before the recent pullback. The speculative fervor that drove Bitcoin to these heights seems to be waning, increasing the likelihood of a bearish turn. Investors should brace for volatility, as the cryptocurrency may struggle to maintain its current altitude, potentially sliding toward the mid-30,000s in the coming months.

BTCUSD: $150,000 on a repetitive pattern.Bitcoin is neutral on its 1D technical outlook (RSI = 54.823, MACD = 486.400, ADX = 23.402) possibly going through the last consolidation before the next breakout to a new ATH. The whole 2023-2025 Bull Cycle has been on a repetitive pattern, bottoming on the HL Zone and peaking on the HH trendline, while forming clear wave structures. According to this, the next HH should be around 150,000 (TP).
## If you like our free content follow our profile to get more daily ideas. ##
## Comments and likes are greatly appreciated. ##

HFTUSDT Forming Falling WedgeHFTUSDT is currently displaying a textbook Falling Wedge Pattern, a classic signal that often points to an upcoming bullish reversal. This pattern is one of the most reliable in technical analysis, as it indicates that sellers are gradually losing momentum and buyers could soon step in to push prices higher. With good volume backing up this setup, traders are growing more confident that a breakout is on the horizon, which could fuel a strong upward rally.
The potential gain for HFTUSDT based on this pattern is estimated between 90% to 100%+, making it an attractive opportunity for swing traders and investors looking for high-risk, high-reward plays. The steady uptick in volume suggests that smart money is already accumulating positions before the anticipated breakout. When combined with the bullish pattern, this sets the stage for a price surge once the resistance line of the wedge is convincingly broken.
This setup comes at a time when the crypto market sentiment is gradually improving, with traders seeking altcoins that can outperform in the next bullish wave. HFTUSDT’s clear technical structure and growing investor interest place it among the top coins to watch closely. A confirmed breakout with strong daily closes above the wedge resistance could open the door to quick gains, rewarding early entrants who position themselves strategically.
It’s always wise to monitor volume and price action carefully when trading a Falling Wedge Pattern like this. Waiting for a confirmed breakout with increased volume can help reduce the risk of false signals and maximize profit potential. Keep HFTUSDT on your radar if you’re aiming to catch a move with solid technical backing and high potential upside.
✅ Show your support by hitting the like button and
✅ Leaving a comment below! (What is You opinion about this Coin)
Your feedback and engagement keep me inspired to share more insightful market analysis with you!

LEVERUSDT Forming Falling WedgeLEVERUSDT is showing a highly promising setup that’s generating buzz among traders and investors alike. The crypto pair is forming a classic Falling Wedge Pattern, which is widely recognized as a bullish reversal signal in technical analysis. This pattern often indicates that selling pressure is weakening and a breakout to the upside could be imminent. With volume picking up steadily, there is growing optimism that LEVERUSDT could deliver a significant price surge once it confirms a clean breakout above the wedge’s resistance line.
Many traders are particularly excited about LEVERUSDT because the expected gain for this setup is an impressive 160% to 170%+. This projection, combined with the clear technical pattern and rising investor interest, suggests that LEVERUSDT may soon become one of the standout performers in the altcoin market. The recent accumulation phase, reflected in steady volume inflows, hints that savvy traders are positioning themselves early ahead of a larger move.
Another important factor supporting this bullish outlook is the broader sentiment in the crypto market. As traders look for undervalued opportunities with high breakout potential, coins like LEVERUSDT that show strong bullish patterns and healthy trading activity become attractive bets. If the breakout confirms on the daily or 4H timeframe with sustained volume, it could trigger momentum-driven buying and push prices towards the projected targets.
For traders looking to diversify their crypto portfolio with high-potential setups, keeping a close watch on LEVERUSDT is definitely worthwhile. Remember to wait for a clear breakout confirmation before entering and manage your risk accordingly to make the most of this potential reversal.
✅ Show your support by hitting the like button and
✅ Leaving a comment below! (What is You opinion about this Coin)
Your feedback and engagement keep me inspired to share more insightful market analysis with you!

BTC Is Replaying a Bullish Fractal >>> Are You Watching?Hello guys!
I see a deja vu here! Let’s look at the historical daily chart (Jan–May 2025):
What happened?
Initial Drop (Yellow Oval): Bitcoin approached a key S&D zone but didn't touch it, triggering a short-lived bounce before dropping again.
Second Drop (Red Ovals): This time, price precisely touched the demand zone, triggering a clean bullish reversal.
What followed was a strong trend breakout, sustained higher lows, and an eventual surge past prior resistance levels.
Current 4H Chart Setup: A Mirror Image?
Yellow Highlight: Once again, we saw a bounce that didn't quite touch the key demand zone ($98K–$100K).
Red Zone Prediction: If this mirrors the historical move, the price is likely to return and touch this S&D area before launching a bullish leg.
Blue Path Projection: A sharp reversal is expected post-touch, aiming toward $111K–$113K as the next key resistance zone.
The descending trendline adds confluence
___________________
History Doesn’t Repeat, But It Often Rhymes
Based on this fractal analysis, Bitcoin is likely forming the same bullish base seen earlier in 2025. The setup hinges on one key event: a return to the $99K–$100K zone, where demand is likely to step in aggressively.
If the pattern repeats, the current market may offer one last high-reward long opportunity before a parabolic rally.

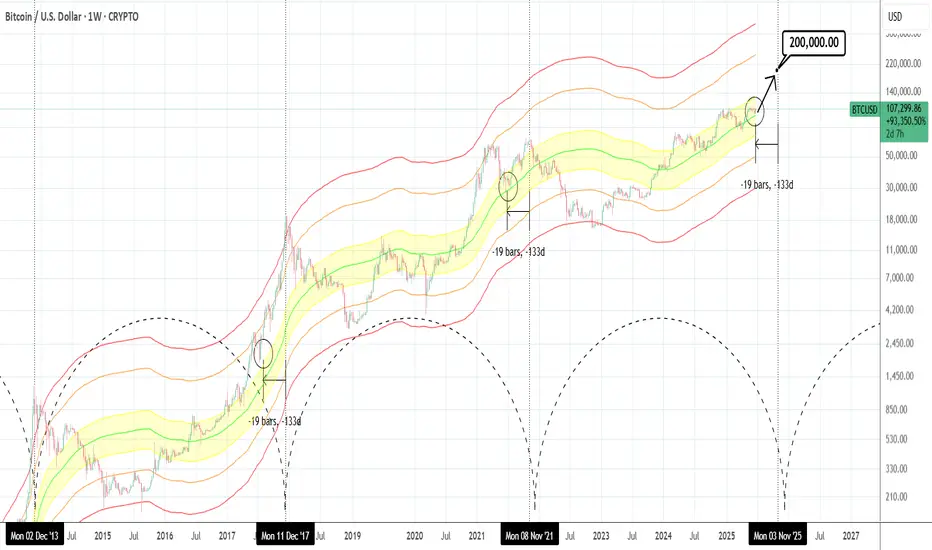
BTCUSD: Hasn't gone parabolic yet.Bitcoin is just now re-entering the bullish state on its 1D technical outlook (RSI = 55.820, MACD = 291.960, ADX = 15.180), being correcting/consolidating in the past 30 days. According to the Mayer Multiple Bands, it's stil inside the range (upper band) of the 1 Stdev Below-Mean-1 Stdev Above (yellow range). This suggest significant upside potential as being roughly 19 weeks before the Cycle tops, it matches the late June 2021 bottom inside that zone as well as the July 2017 bottom just over the top of that zone. The orange trendline has been the minimum target on every Cycle but looks unlikely to hit it by the end of the year. If however it goes parabolic as all Cycles had at this stage, $200,000 isn't at all far fetched before the Cycle tops.
## If you like our free content follow our profile to get more daily ideas. ##
## Comments and likes are greatly appreciated. ##
BSWUSDT Forming Falling WedgeBSWUSDT is currently showcasing a classic falling wedge pattern, a bullish reversal signal often associated with a sharp move to the upside once the pattern resolves. This technical structure forms when price action consolidates with lower highs and lower lows, while volume typically decreases — setting the stage for a breakout. In BSWUSDT’s case, the falling wedge has matured, and bullish interest is beginning to surface with improving volume levels, suggesting that accumulation is underway.
The technical breakout from this pattern could unlock strong upside potential, and current projections indicate a possible 90% to 100% gain in the coming sessions. This aligns well with historical performance of similar wedge formations in the crypto market, where the price often surges after breaking the upper resistance trendline. Traders are closely monitoring key resistance zones for confirmation and volume spikes that can validate the trend shift.
Investor sentiment toward the (BSW) ecosystem is growing steadily due to its utility in DeFi services and low trading fees. The increase in volume also indicates that smart money could be positioning ahead of a major move. Coupled with market-wide bullishness, BSWUSDT may soon experience a strong rally, driven by both technical and fundamental catalysts.
This setup offers a high-reward opportunity for swing traders and technical analysts who are focused on breakout trades and pattern-based strategies. The falling wedge combined with rising investor engagement makes BSWUSDT a potential breakout star to watch closely.
✅ Show your support by hitting the like button and
✅ Leaving a comment below! (What is You opinion about this Coin)
Your feedback and engagement keep me inspired to share more insightful market analysis with you!

BNBUSDT Forming Bullish Wave BNBUSDT is forming a promising bullish wave pattern that suggests a potential continuation of the upward trend in the short to mid-term. The structure is supported by consistent volume, indicating strong participation and interest from traders and investors. The price action reflects healthy higher lows and higher highs, which typically signal growing bullish momentum. Given the current setup, we can expect a conservative gain of around 10% to 20%+ as the price targets upper resistance zones.
Binance Coin (BNB), being one of the top-tier cryptocurrencies with strong utility across the Binance ecosystem, often benefits from broader market recoveries and exchange-driven demand. With overall crypto sentiment showing resilience, BNB is well-positioned to attract further inflows. The bullish wave pattern being observed could serve as a foundation for the next impulsive move upward, especially if volume continues to support the breakout structure.
The project continues to demonstrate its dominance in both fundamental and technical metrics. As market confidence in leading assets returns, BNB’s role as a utility token and its deflationary mechanisms make it particularly attractive. Technical traders will be watching for a breakout above recent highs to confirm trend continuation, ideally backed by a surge in volume and RSI strength.
BNBUSDT remains a strong candidate for traders looking for stability with upside potential. The confluence of bullish wave formation, increasing interest, and fundamental strength positions it well for a steady rise in price in the coming days or weeks.
✅ Show your support by hitting the like button and
✅ Leaving a comment below! (What is You opinion about this Coin)
Your feedback and engagement keep me inspired to share more insightful market analysis with you!
