ZEC - From Exhaustion to Expansion!!!📉ZEC spent days trapped in a clear bearish phase on the left side of the chart, forming lower lows and lower highs. But everything changed once price tapped the major swing low, where buyers stepped in aggressively.
📈Since then, ZEC has been respecting a new rising channel , shifting the market structure from bearish to bullish. As long as price remains inside this channel, the bulls remain in control.
We will be looking for longs around the intersection of:
- the lower blue trendline, and
- the most recent higher-low zone
🏹This is where buyers have consistently reacted before, and where the next bullish impulse could start.
If this structure holds, ZEC may push toward the upper boundary of the channel once again.
Do you think ZEC is gearing up for another leg up? Let me know below 👇
⚠️ Disclaimer: This is not financial advice. Always do your own research and manage risk properly.
📚 Stick to your trading plan regarding entries, risk, and management.
Good luck! 🍀
All Strategies Are Good; If Managed Properly!
~Richard Nasr
Blockchain

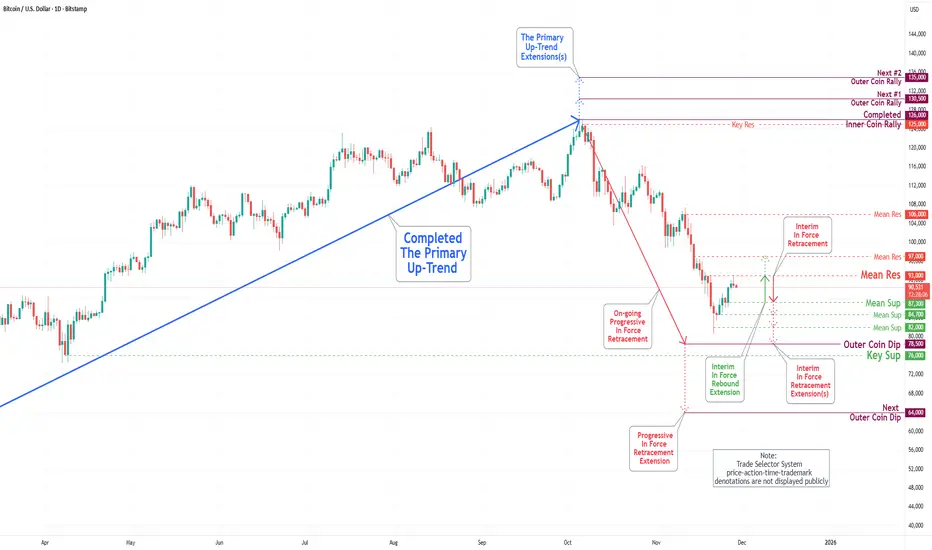
Bitcoin(BTC/USD) Daily Chart Analysis For Week of Dec 5, 2025Technical Analysis and Outlook:
In the most recent trading session, the Bitcoin market experienced a Pump-and-Dump scenario and continued the downward trend observed over the past week. The price has reached the Mean Resistance level of 93,500.
Market sentiment is declining, with current price action focusing on identifying the Mean Support level at 88,000. Additional support is identified at 84,500, with a further significant drop possible to the Outer Coin Dip at 78,500.
Given the current dynamics of the crypto market, there is potential for an intermediate rebound from the Mean Support level of 88,000 back up to the Mean Resistance level of 93,500. Furthermore, an external extension may target the Interm Inner Coin Rally at 98,000.

Time for XRP?CRYPTOCAP:XRP ➖ Time for XRP?
I checked CoinMarketCap and saw the coin is currently ranked 6th in searches, so I got curious about what's going on with it.
Like every other coin, it dropped hard together with the market on Monday and triggered a ton of trader stop losses.
Looking at the liquidation heatmap, there is still room for upside along with Bitcoin. Basically this will just be a corrective bounce before we head even lower. We'll wipe out the shorts first and then drill a new bottom.
➖ Entry around $2.0210 with a target of $2.3700, good for roughly +17%.
Unless aliens and reptilians don't step in and mess with this little XRP bounce of course 🦖👽.

SOL reversal⚡ SOL/USDT – 1H Reversal Heating Up
BYBIT:SOLUSDT.P holding strong above $136–$138 support — EMA ribbon flipped green and momentum’s curling up.
If bulls defend this level, next leg targets $150 → $160+.
Break below $132 invalidates short-term setup.
“Golden pocket bounce. Calm before the breakout.” ⚙️

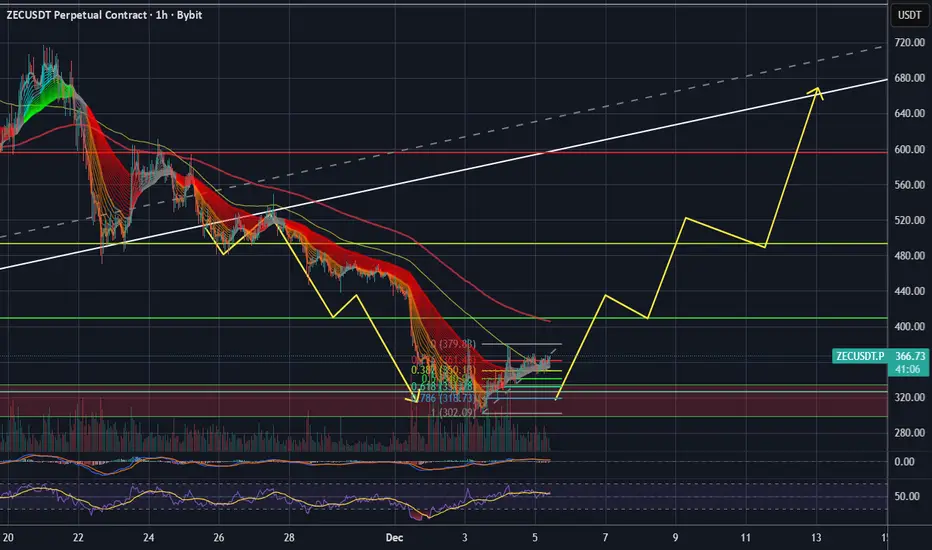
ZEC Golden Zone Reversal⚡ ZEC/USDT – The Golden 0.618 Reversal Zone?
BYBIT:ZECUSDT.P just tapped the 0.618 Fib around $326, right inside a strong support zone — classic golden pocket territory. 👀
The setup’s screaming potential reversal:
- RSI: Bullish divergence forming.
- MACD: Losing bearish momentum.
- EMA Ribbon: Flattening on 4H = trend shift brewing.
If bulls can reclaim $410–$490, I’m eyeing a push toward $650+.
Below $320, though — game over, next stop $207.
“Golden pocket bounces are where legends are born… or wrecked.” 💀➡️🚀
XYZ(BLOCK) HIGH PROBAIBILITY LONG SETUP SOON!!!🚨 XYZ HIGH PROBABILITY BUY SETUP 🚨
* Here We Can See Clearly The Next Potential Moves For BLOCK Coming Hours/Days.
* Keep Your Eyes Close On Your Trading Positions.
* Happy PIP Hunting Traders.
FXKILLA.

ETH - Bulls Waiting at the Intersection Zone!📈ETH remains overall bullish, moving steadily inside its rising channel. Every dip toward the lower bound has acted as a clean continuation point for the next push upward.
🏹As price pulls back , we will be looking for long setups once ETH retests the intersection of the lower trendline and the demand zone. This confluence area has been respected multiple times, making it a high-probability level for trend-following entries.
⚔️As long as ETH holds above this orange zone, the bullish structure remains intact, and the next impulse toward the upper channel boundary becomes the most likely scenario. Only a break below the demand zone would weaken the bullish outlook.
Now we wait for the retest… then let the structure guide the entries. 🤔
⚠️ Disclaimer: This is not financial advice. Always do your own research and manage risk properly.
📚 Stick to your trading plan regarding entries, risk, and management.
Good luck! 🍀
All Strategies Are Good; If Managed Properly!
~Richard Nasr

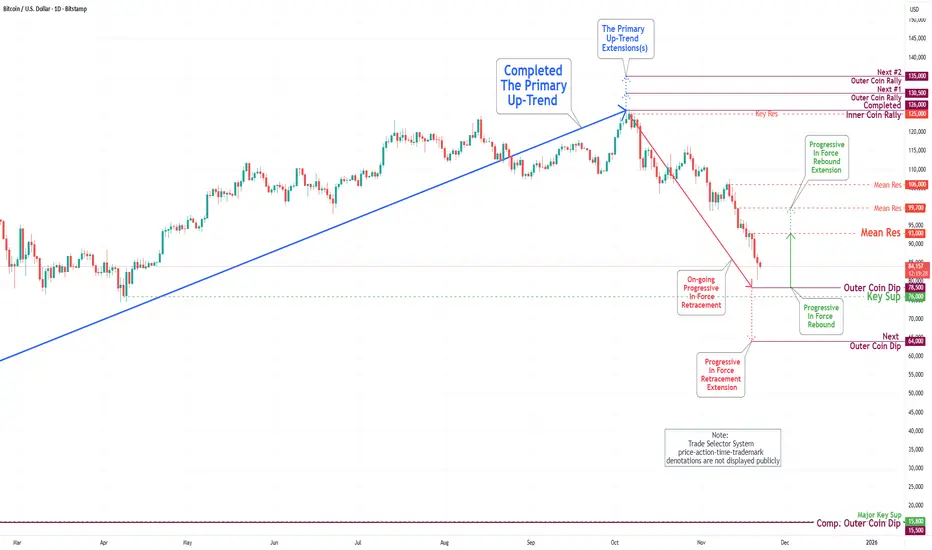
Bitcoin(BTC/USD) Daily Chart Analysis For Week of Nov 28, 2025Technical Analysis and Outlook:
During the most recent trading session, the Bitcoin market exhibited a resilient rebound, continuing a trend observed over the past week. The price has reached the Mean Resistance level of 93,000.
Market sentiment is in declining mode, and the price is likely to trend toward the Mean Support level at 87,300. Current trading activities are focused on identifying the next Outer Coin Dip, projected at 78,500, with additional obstacle support at the Mean Support levels of 84,700.
Given the prevailing trading dynamics, there is potential for an intermediate rebound from the Mean Support level of 87,300 to the Mean Resistance level of 93,000. Furthermore, an external extension may occur as the cryptocurrency market continues to fluctuate in line with current shaky market sentiment. Notably, it is essential to acknowledge the potential for a significant rebound once the Outer Coin Dip target of 88,500 is achieved.
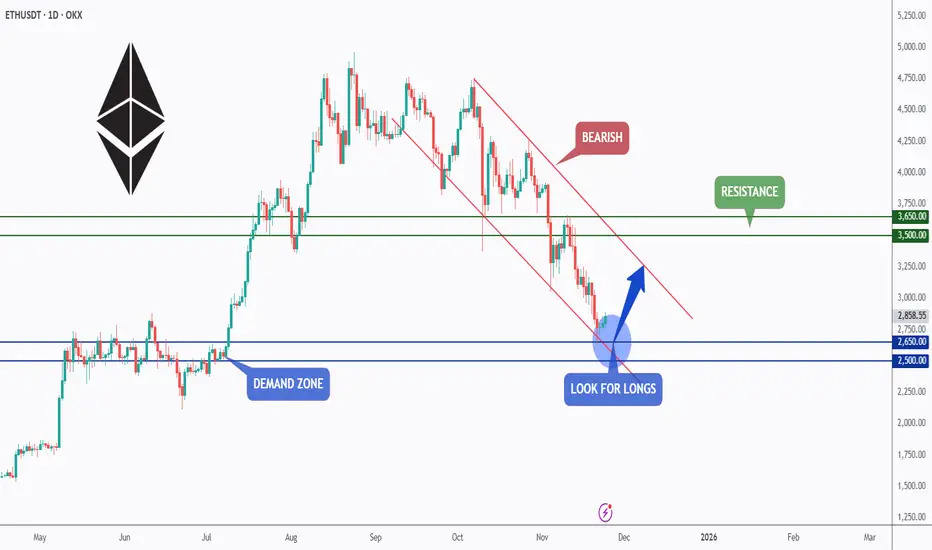
ETH - Demand Zone Meets Channel Support… Correction Loading?⚔️ETH is currently trading around a major demand zone, which lines up perfectly with the lower bound of the falling channel. This intersection forms a strong confluence area where buyers typically step in to absorb the selling pressure.
🏹As long as ETH holds above the $2,500–$2,650 zone, we will be looking for long setups, anticipating a big corrective move toward the upper bound of the falling channel. This would align with the natural rhythm of impulse → correction inside a bearish channel.
If the bulls manage to defend this area, the next targets sit around $3,500–$3,650, which represent the next key resistance levels. However, a break below the demand zone would invalidate the bullish correction setup and open the door for further downside.
ETH is now at a decisive point… will the demand zone trigger the next corrective leg upward? 🤔
⚠️ Disclaimer: This is not financial advice. Always do your own research and manage risk properly.
📚 Stick to your trading plan regarding entries, risk, and management.
Good luck! 🍀
All Strategies Are Good; If Managed Properly!
~Richard Nasr
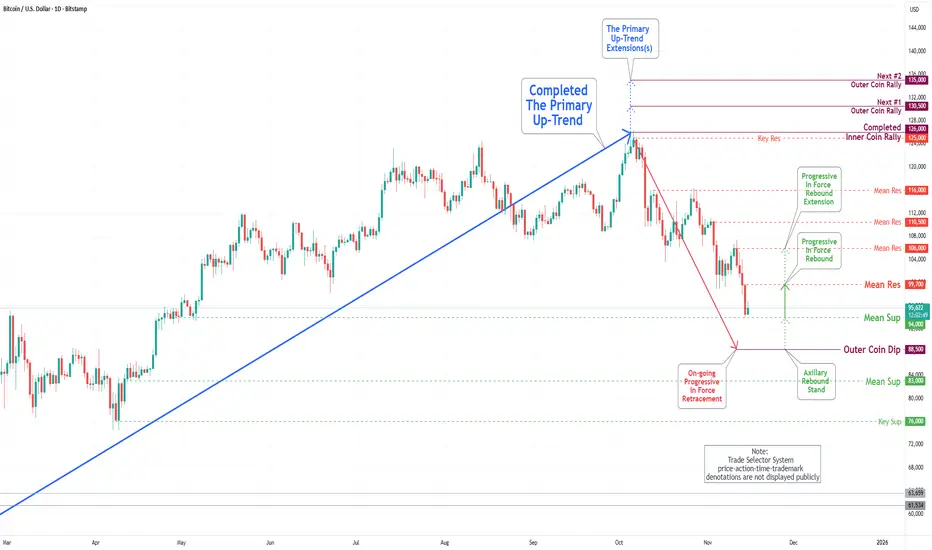
Bitcoin(BTC/USD) Daily Chart Analysis For Week of Nov 21, 2025Technical Analysis and Outlook:
In the last trading session, the Bitcoin market experienced a substantial drawdown, continuing a trend observed over the past week. The price has reached the Outer Coin Dip at 88,500. In light of these difficulties, the price has subsequently declined to the Mean Support level at 83,000, while trading activity is now focused on identifying the next Outer Coin Dip at 78,500. Notably, the price has remained below the upper boundary of the Mean Resistance at 93,000. Considering the current trading dynamics, a potential intermediate rebound towards this resistance level appears plausible. However, it is essential to recognize the possibility of a considerable rebound occurring once the Outer Coin Dip target of 88,500 is attained.
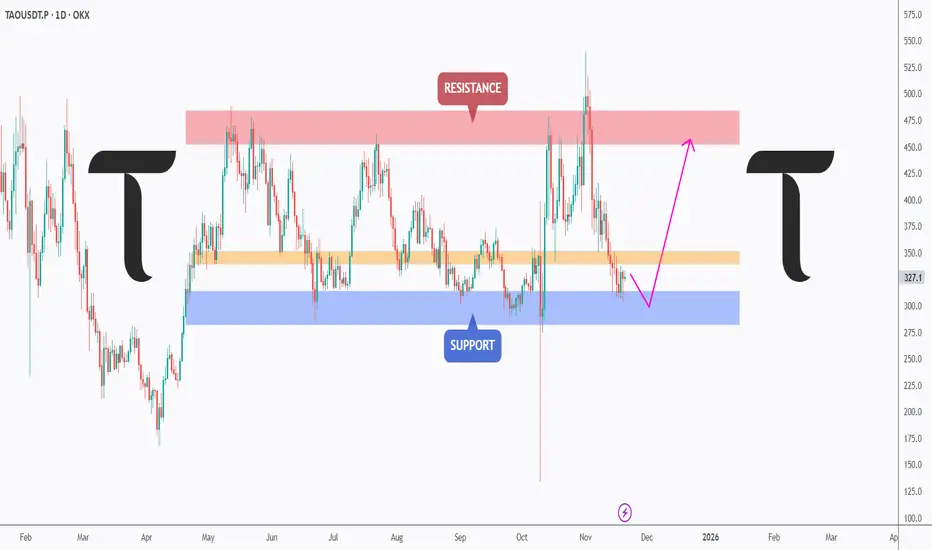
T for TAO… Let’s Keep It Simple!📦 TAO is currently trading inside a wide range , hovering above a major support zone that has held the price multiple times throughout the year. As long as this blue support area continues to hold, we will be looking for longs and expecting buyers to step in.
📈For the bulls to fully take over , TAO needs to break and hold above the orange structure zone, which has been acting as a strong barrier for months. A clean breakout above it would open the way toward the red resistance zone and potentially higher.
Until then, this remains a simple range:
Support for buys… resistance for sells… and structure for confirmation. 🤔
⚠️ Disclaimer: This is not financial advice. Always do your own research and manage risk properly.
📚 Stick to your trading plan regarding entries, risk, and management.
Good luck! 🍀
All Strategies Are Good; If Managed Properly!
~Richard Nasr.
Bitcoin(BTC/USD) Daily Chart Analysis For Week of Nov 14, 2025Technical Analysis and Outlook:
In the most recent trading session, the Bitcoin market has undergone a significant drawdown over the past week, reaching the Mean Support level of 99,000. Additionally, it has completed the Outer Coin Dip at 97,000. Compounding these challenges, the price has also declined to the Key Support level of 94,000, where trading activity is currently concentrated.
At this time, the price is being maintained within a trading range defined by the Mean Resistance at 99,700 and the Mean Support (Former Key Support) at 94,000, with a slight probability of an extension to the Mean Support level at 106,000. Nonetheless, it is crucial to acknowledge the considerable potential for pullbacks at these critical resistance levels.
SOL - Enough is Enough!📉After weeks of selling pressure , SOL is finally approaching a massive confluence zone around the $150 round number, which aligns perfectly with a strong weekly support area highlighted in blue.
⚔️This level has historically acted as a major pivot zone , and as long as SOL holds above it, I’ll be looking for short-term long opportunities, targeting the upper bound of the falling red channel.
🏹However, for the bulls to fully take control, SOL must break above the last major high marked in red, confirming a shift from correction to continuation.
Could this be the point where Solana says - Enough is enough? 👀
⚠️ Disclaimer: This is not financial advice. Always do your own research and manage risk properly.
📊All Strategies Are Good; If Managed Properly!
~Richard Nasr

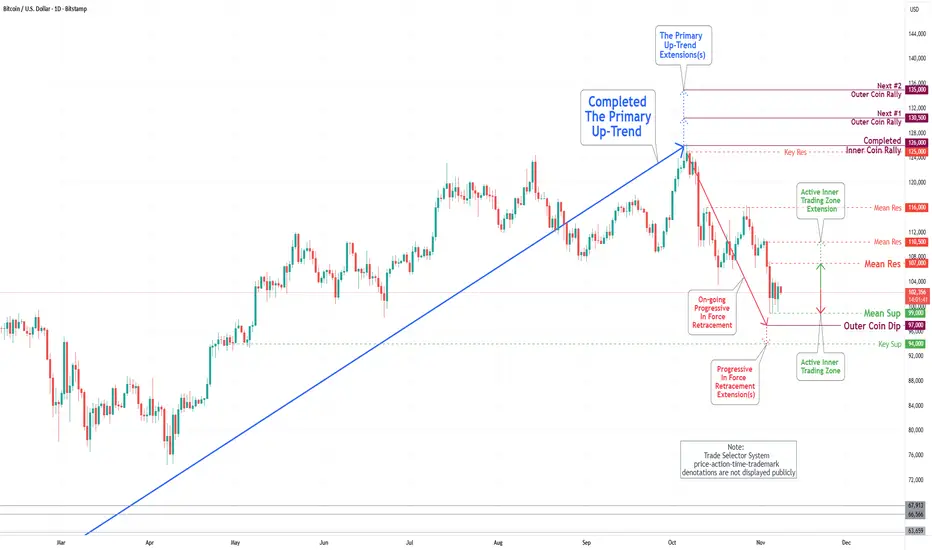
Bitcoin(BTC/USD) Daily Chart Analysis For Week of Nov 7, 2025Technical Analysis and Outlook:
In the previous trading session, the Bitcoin market experienced a notable drawdown over the past week, with the Mean Support established at 101,000, around which trading activity was concentrated. Presently, the price is actively maintained within the range defined by the Mean Resistance at 107,000 and the Mean Support at 97,000.
Current market analysis suggests the likelihood of a retest toward the Mean Support level at 99,000, with a primary emphasis on the potential for further downward movement toward the Outer Coin Dip at 97,000, which may extend to the Key Support level at 94,000. Nonetheless, it is vital to recognize the substantial rebound potential present at these critical levels.
ICPUSDT - BUY OPPORTUNITYI predicted Solana to achieve its ATH when it was trending bearish and markets where in complete negative sentiment towards Solana, none the less, my Solana outlook and price forecast was based on the blockchain, its usability, and TPS etc. It hit through all the TP areas and is now fully trading at its fair value, and still growing...
Now I am back with my updated outlook on Internet Computer Protocol (ICP). This blockchain is by far the most advance and powerful blockchain I have come across and know. Literally nothing comes close to it. I have done my own thorough research and can honestly say, this blockchain is literally a steal at current market value. In fact I am in complete disbelief and amazed how this blockchain is not in the TOP 5, when compared to other blockchains out there, who don't offer any real value, and or utility but rather just a mere copy tokens, of ETH etc most cant even host a single bite size image on their blockchain. Yes even Solana can not compete with the tech of ICP. ICP is a super-powerful blockchain, that can host anything including Ai fully on-chain. YES Fully On-Chain.
The introduction of Caffeine Ai > sovereign self-writing apps, self writing internet etc You can find more about this on ICP or follow Dom on X @ DOMINIC_W
Caffeine Ai could bring a lot of Devs over, possibility of anyone becoming a Dev through Caffeine Ai, buildings Apps that will generate income, burn cycles on ICP, catalyst for ICP growth and value etc
The scale at which ICP can exponentially grow from there, with mass adoption can far exceed market cap of Solana and many other blockchains. In my opinion, its far more superior than ETH. It is the only true Ai Blockchain which can host Apps fully on-chain etc immune to tampering, hacks etc A full scale IT stack that can engineer Apps, rewrite the internet all within ICP Blockchain.
It will recover, and gain its true value, at least 3 digits, potentially 4. (I am not financial advisor, Pls DYOR).
The ICP launch was heavily manipulated , it posed a threat to other blockchains, big techs etc however the TEAM at ICP continues to deliver (biggest R&D in crypto space), work and progress ICP. Its only a matter of time, ICP will be MASSIVE n people will wake up to its true reality and what it offers!
Todays price will be Historical!!! Yes I have added more ICP with this Dip. DCA is a powerful strategy ;) Thanks for the Dip - I call it the Winter Sale.
Lets see where ICP leads from here now!
I am holding strong, Diamond!
Oh, if you have come this far, Don't forget BOB on ICP - An interesting one to watch out for!!! just saying ;)
Pls DYOR - I am not Financial Advisor. Crypto is highly volatile!
Trade Safe Habibis

Bitcoin’s Decentralization Is a Lie - Here’s the ProofYou’ve Been Fooled For Years
The narrative: Bitcoin is "decentralized money," free from banks, governments, and corporate control. A financial revolution for the people.
The reality: Bitcoin is one of the most centralized, surveilled, and manipulated financial systems in existence, and the public has been sold a decade-long con.
Let’s break down why Bitcoin fails as decentralized money and how the system is controlled by a tiny elite, with more surveillance than traditional finance.
1. The Mining Oligarchy: 90% of Bitcoin’s Supply Controlled by a Handful of Players
Bitcoin’s security and transaction processing rely on miners—but this isn’t a distributed network of mom-and-pop operators. A few massive mining pools dominate the entire system:
Just 4 mining pools (Foundry USA, Antpool, F2Pool, and ViaBTC) control over 60% of Bitcoin’s total hash rate (Blockchain.com).
The top 10% of miners control 90%+ of the mining power—meaning a small group of entities can censor transactions, manipulate fees, or even collude to attack the network.
Mining is centralized in a few countries (U.S., China, Kazakhstan), where governments and corporations can shut it down at will (see: China’s 2021 mining ban, which wiped out 50% of the network overnight).
Hardware centralization: Only ASIC manufacturers (like Bitmain) can profitably mine Bitcoin. No average person can compete—this is industrial-scale control, not decentralization.
→ If 4 companies control the network, how is this "decentralized"?
2. The Validator Dictatorship: Bitcoin’s "Trustless" System Runs on Trust in a Few
Bitcoin’s nodes (computers that validate transactions) are supposed to be the backbone of decentralization. But:
Over 50% of Bitcoin nodes run on just 3 hosting providers (Amazon AWS, Hetzner, OVH) (Bitnodes).
Most full nodes are controlled by exchanges, institutions, and mining pools—not regular users.
If you’re not running a full node (and 99% of users aren’t), you’re trusting someone else’s version of the blockchain. That’s not trustless, that’s blind faith in a centralized elite.
→ If you’re not validating transactions yourself, you’re just a user in their system.
3. The Exchange Trap: Your Bitcoin Isn’t Yours (And Never Was)
95% of Bitcoin is held on exchanges (Coinbase, Binance, Kraken, etc.), not in self-custody wallets.
Exchanges freeze, seize, and censor transactions all the time (e.g., Coinbase banning Tornado Cash users, Binance freezing accounts at government request).
If your Bitcoin is on an exchange, you don’t own it. You own an IOU—just like a bank.
Withdrawal limits, KYC, and government pressure mean your Bitcoin is only as free as the exchange allows.
→ Sound familiar? This is just digital banking with extra steps.
4. The Blockchain Surveillance State: Bitcoin Is the Ultimate Financial Panopticon
Bitcoin was supposed to be private money. Instead, it’s the most transparent financial system ever built:
Every transaction is public forever—no deletions, no do-overs.
Chain analysis firms (Chainalysis, TRM Labs, Elliptic) work with governments, banks, and exchanges to track, deanonymize, and blacklist users.
Once your wallet is linked to your identity (via an exchange, merchant, or IP leak), every transaction you’ve ever made is exposed.
Law enforcement loves Bitcoin because it’s easier to trace than cash. The FBI has recovered billions in Bitcoin from criminals—not because it’s secure, but because it’s trackable.
→ Cash leaves no trail. Bitcoin leaves a permanent, public record of your entire financial life.
5. The Whale Problem: 2% of Wallets Control 50% of Bitcoin
Just 2% of Bitcoin addresses hold over 50% of the supply (BitInfoCharts).
The top 100 wallets own more Bitcoin than the bottom 100 million combined.
Whales manipulate the market with pump-and-dump schemes, while retail investors get rekt in every cycle.
→ This isn’t decentralized money. This is a rigged casino where the house always wins.
*6. The Irony: Bitcoin Is More Surveilled Than Traditional Finance
Bitcoin was supposed to be an escape from the banking system—but it’s just a worse version of it:
Slower (10-minute blocks vs. instant cash).
More expensive ($50 fees vs. $0 for cash).
Less private (public ledger vs. untraceable cash).
More centralized (mining pools, exchanges, whales vs. local banks).
→ You traded real financial privacy for a digital illusion of freedom.
7. The Ultimate Scam: "Decentralization Theater"
Bitcoin’s real decentralization is a marketing gimmick to keep you invested while:
Miners, exchanges, and whales extract wealth from retail.
Governments and corporations use the blockchain to track and control financial activity.
The narrative of "freedom" keeps you holding the bag while the insiders cash out.
→ You were sold a revolution. You got a surveillance network with a ticker symbol.
What’s Actually Decentralized? (Hint: Not Bitcoin)
If you want real financial sovereignty, here’s what beats Bitcoin:
✅ Physical cash – No ledger, no tracking, no middlemen.
✅ Gold & silver – No transaction history, no KYC, true store of value.
✅ Privacy coins (Monero, Zcash) – Actually untraceable transactions.
✅ Local barter & trade – No blockchain, no surveillance.
Bitcoin is not the future of money. It’s a centralized, surveilled experiment that enriches the few while fooling the many.
Final Verdict: Bitcoin Is a Centralized, Censored, and Controlled System
Mining? Controlled by a few corporations.
Validation? Run by cloud providers and exchanges.
Ownership? Most Bitcoin is held by whales and custodians.
Privacy? Worse than a bank account.
You’ve been fooled. The "decentralized revolution" was just another Wall Street trap—and the joke’s on you.
→ Wake up. The emperor has no clothes.
NASDAQ:COIN NASDAQ:MSTR TVC:GOLD TVC:SILVER NASDAQ:MARA TVC:DXY

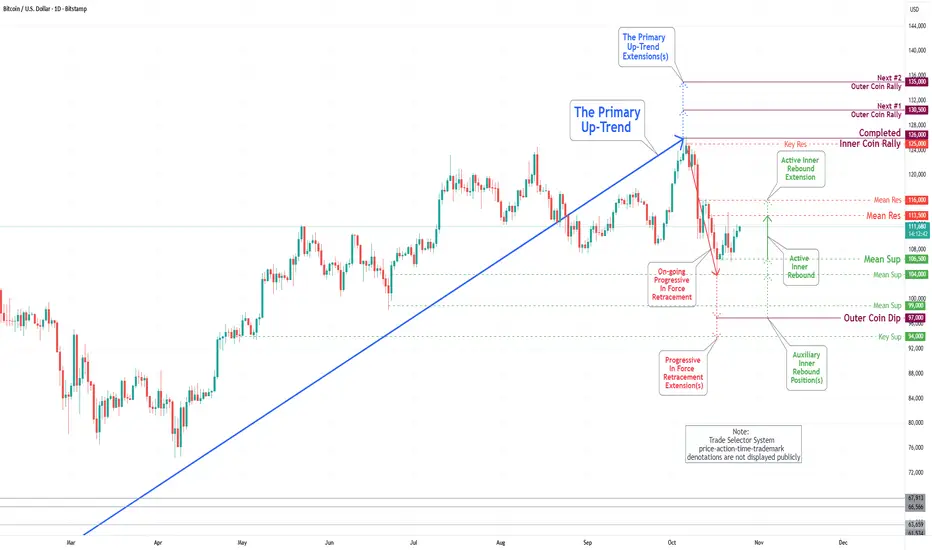
Bitcoin(BTC/USD) Daily Chart Analysis For Week of Oct 31, 2025Technical Analysis and Outlook:
The trading session from last week was notably eventful. The Bitcoin market experienced significant volatility, fluctuating between the Mean Resistance level of 116,000 and the critical Mean Support level of 106,500. Currently, the price is actively navigating this range.
Current market analysis indicates a likelihood of a retest toward the Mean Support level at 106,500, with a primary focus on the potential for further downward movement towards the Mean Support level of 101,000. This trajectory may ultimately lead to our key objective of reaching the Outer Coin Dip at 97,000. It is, however, essential to acknowledge the robust rebound potential at these pivotal levels.

HYPEUSDT – Watching a Key Support Zone for Long SetupHYPEUSDT is currently pulling back and heading toward a major support area at $42–$43. This zone has historically provided strong buying interest and could act as a platform for a reversal. We’re closely watching this level for a potential long swing trade opportunity.
🛠 Trade Setup
Entry Zone: $42 – $43 (Support Area)
Take Profit Levels:
• TP1: $53
• TP2: $59
Stop Loss: $38 (Just below structure)

Growth ahead of the Trump-Xi Jinping meeting in South Korea.CRYPTOCAP:ETH / #Ethereum 🔹 Donald Trump and Xi Jinping (October 19, 2025)
A positive outlook is shaping up for Ethereum, and it sure looks like a classic W reversal is in the works.
There's a ton of negativity swirling right now, with a lot of folks expecting prices to dip even lower (I was bracing for that final flush-out myself, but it looks like they scooped up the dip and are busy forming this reversal setup).
During that Ethereum drop on October 10-11, BitMine Immersion Technologies beefed up its reserves with 104,336 ETH worth $417 million.
As of this writing, the company's sitting on 3.03 million ETH valued at $12.18 billion, making it the biggest corporate whale holding Ethereum.
Whales and public companies are aggressively snapping up Ethereum and stacking their bags.
All that's left is to speculate where Ethereum's gonna top out and where they'll start dumping all this volume 8k? 10k?
I've pulled together some screenshots that back up the bullish signal:
1️⃣ Liquidations on the Hyperliquid exchange: As you can see on the chart above, once we break $5,000, a massive wave of short traders are gonna get wrecked that could spark another leg up in price momentum.
2️⃣ Coinbase order book: Check it out—above $5,000, there are limit orders lined up for profit-taking, so Ethereum might follow a similar path straight up to $8,000.
3️⃣ Current big orders on Binance and Coinbase exchanges.
4️⃣ OKX ETH/USDC liquidation heatmap.
Wrapping it up: On the daily chart, we're seeing a reversal pattern forming as a W (I call it the "pirate reversal" myself), and keep in mind that after the chaos on October 10-11, more than 1.6 million traders got absolutely rekt.
I doubt everyone's gonna pile back in buying or flipping to long positions anytime soon that plays right into the hands of the big market puppeteers and market makers.
They'll pump the price higher, whip up the hype, and offload their Ethereum stacks at the top.
Snapshot:

Bitcoin(BTC/USD) Daily Chart Analysis For Week of Oct 24, 2025Technical Analysis and Outlook:
In last week's trading session, the Bitcoin market experienced wild gyrations between Mean Support 106500 and the critical Mean Resistance level of 113500, as the price is currently actively fluctuating between the two.
Current market analysis indicates an initial recovery towards the Mean Resistance level of 113500, with the potential for further upward movement to the Mean Resistance level of 116000. However, it is crucial to acknowledge the possibility of a reversal at these resistance levels, which could extend to continue the Progressive In Force Retracement trend.
ETH Eyes Upside RunEthereum shows signs of regaining strength after a prolonged corrective phase. The asset is currently stabilizing, supported by gradual inflows from institutional participants and renewed investor accumulation. Market behavior indicates controlled volatility, suggesting a preparation phase before a potential expansion.
Network data reflects consistent transaction activity, while liquidity concentration hints at sustained participation from long-term holders. The recent stabilization in funding rates and improved open interest add weight to the recovery outlook.
If momentum continues to build under these conditions, Ethereum could enter a structured growth cycle in the coming sessions.

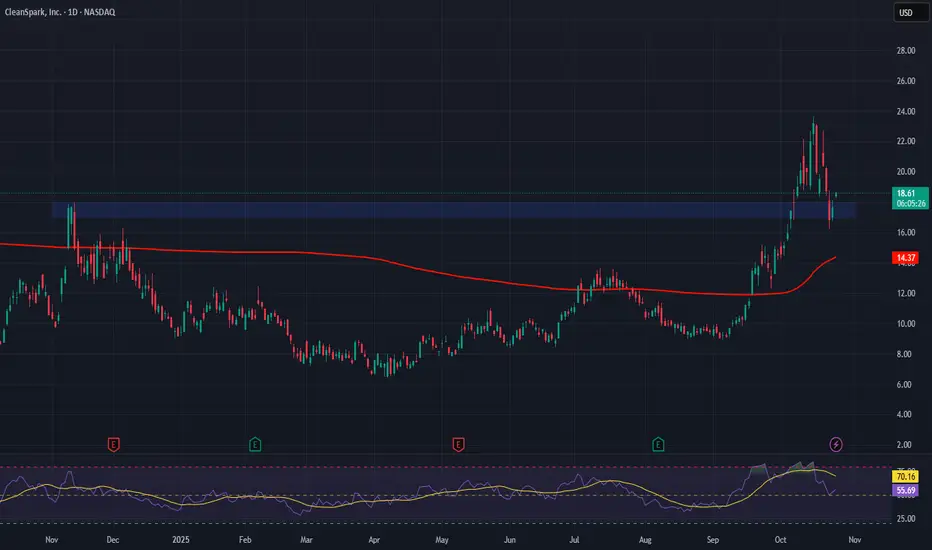
CleanSpark (CLSK)— Bridging Bitcoin Mining and AI InfrastructureCompany Overview:
CleanSpark, Inc. NASDAQ:CLSK is a leading Bitcoin mining and high-performance computing (HPC) company leveraging sustainable energy to power scalable digital infrastructure—offering investors exposure to both the crypto mining and AI computing sectors.
Key Catalysts:
Strong financial performance: Bitcoin holdings exceed 13,000 BTC, while Q3 2025 revenue surged 90.8% YoY to $198.6M, underscoring robust execution and institutional demand.
AI and HPC expansion: Strategic buildout of Georgia data centers positions CleanSpark at the crossroads of AI and blockchain, tapping into multi-trillion-dollar infrastructure opportunities.
Financial strength: A $500M Bitcoin-backed credit facility enhances liquidity and scalability while maintaining capital discipline and shareholder value.
Investment Outlook:
Bullish above: $17.00–$18.00
Upside target: $38.00–$40.00, driven by AI integration, operational scale, and Bitcoin price leverage.
#CleanSpark #BitcoinMining #AIInfrastructure #HPC #Crypto #SustainableEnergy #Blockchain #Investing #CLSK
NEAR - Patience at the Pivot, Power at the Bounce!📦NEAR has been stuck within a big range for months. After failing at the mid-range, price is grinding lower, and I’d prefer one more liquidity sweep into the blue support zone to reset late longs and load smart risk.
⚔️If buyers defend 2.00 and we then reclaim 2.20 → 2.30 (H4 close back above the pink structure), I’ll look for trend-following longs toward 2.70, then 3.10–3.40 (major resistance).
Plan:
🏹Wait for the dip into support, hunt for a wick + strong close/reclaim, and let the squeeze do the heavy lifting back into the range highs.
📚All Strategies Are Good; If Managed Properly!
~Richard Nasr
