BTCUSDT Holding Higher Lows, $94,700 Resistance in FocusHello traders! Here’s my technical outlook on BTCUSDT (3H) based on the current chart structure. BTCUSDT initially experienced a strong sell-off, marked by aggressive bearish momentum as price dropped from higher levels. After this decline, the market found a base and started to grow, transitioning into an ascending channel. This phase showed a clear shift in control from sellers to buyers, supported by a rising support line and multiple bullish reactions along the channel. However, as price approached the upper boundary of the channel and the Seller Zone, upside momentum began to slow. During this phase, BTC formed several fake breakouts and failed attempts to hold above resistance, signaling strong selling pressure near the highs. Price then broke back below short-term structure and entered a consolidation phase, forming a clear range. This range reflected temporary balance, with buyers defending the lower boundary while sellers capped the upside. Recently, BTC broke out from the range to the upside and reclaimed the Buyer Zone, confirming renewed bullish intent. Price is now trading above key support around 91,500–92,000 and is respecting the rising support line, indicating that buyers are actively defending pullbacks. The current move is pushing price back toward the Resistance Level and Seller Zone around 94,700, where a test is expected. My scenario: as long as BTCUSDT holds above the Buyer Zone and the rising support line, the bullish bias remains intact. I expect price to retest the 94,700 Resistance, with TP1 aligned near this level. A clean breakout and acceptance above resistance would confirm bullish continuation and open the door for higher targets. However, a strong rejection from the Seller Zone followed by a breakdown below support would invalidate the bullish scenario and suggest a deeper corrective move. Please share this idea with your friends and click Boost 🚀
Breakout

BTCUSDT Long: Uptrend Continues Toward 94,500 ResistanceHello traders! Here’s a clear technical breakdown of BTCUSDT (4H) based on the current chart structure. BTCUSDT initially traded within a well-defined descending channel, reflecting sustained bearish pressure during that phase. This move ended with a clear pivot point, followed by a strong breakout from the descending channel, signaling a shift in market control from sellers to buyers. After this breakout, price transitioned into a broad range, where BTC consolidated for an extended period, showing balance between supply and demand with multiple internal reactions.
Currently, BTC is approaching a key Supply Zone around the 94,500 level, where previous selling pressure is expected to re-emerge. This area aligns with the upper boundary of the ascending channel, increasing the likelihood of a reaction. Below current price, the Demand Zone near 86,800 remains a critical support level, marking the prior breakout area and the base of the bullish structure.
My scenario: as long as BTCUSDT holds above the Demand Zone and stays within the ascending channel, the bullish bias remains intact. I expect price to test the 94,500 Supply Zone, where a reaction or short-term pullback may occur. A clean breakout and acceptance above supply would signal further upside continuation. However, a strong rejection from supply followed by a breakdown below channel support would suggest a deeper corrective move. For now, structure favors buyers while price remains within the ascending channel. Manage your risk!

EURUSD: Fake Breakdown from Support Signals Potential ReversalHello everyone, here is my breakdown of the current EURUSD setup.
Market Analysis
EURUSD previously traded inside a clearly defined range, where price moved sideways and showed equilibrium between buyers and sellers. From this range, price attempted a bullish breakout, but the move resulted in a fake breakout into the upper area, signaling strong selling pressure inside the Resistance Zone around 1.1750–1.1760. This zone was tested multiple times, and each attempt to hold above it failed, confirming it as a strong supply area.
Currently, price is trading below the key resistance and remains structurally bearish. The highlighted move suggests a potential corrective pullback from support toward the descending channel resistance, which aligns closely with the horizontal resistance zone around 1.1750.
My Scenario & Strategy
My primary scenario: as long as EURUSD holds above the 1.1680 Support Zone and no strong bearish acceptance occurs below it, the bullish bias is favored in the short term. I expect buyers to push price higher toward the descending channel resistance and horizontal Resistance Zone around 1.1740, which acts as TP1. A clean breakout and acceptance above the 1.1750 Resistance Zone would confirm stronger bullish continuation and open the door for a move toward higher highs.
However, a decisive breakdown and close below the support zone would invalidate the long scenario and signal renewed bearish continuation. For now, the market is at a key reaction area, and the long setup depends on buyers continuing to defend support.
That's the setup I'm tracking. Thank you for your attention, and always manage your risk.

EURUSD Breakdown Confirmed, 1.1640 Support in FocusHello traders! Here’s my technical outlook on EURUSD (2H) based on the current chart structure. EURUSD initially traded within a well-defined ascending channel, showing a strong bullish structure with higher highs and higher lows after the market started to grow from the lower levels. This bullish phase reflected steady buyer control, supported by a rising support line and multiple clean reactions along the channel structure. Eventually, price broke above the channel resistance, signaling momentum expansion. Following the breakout, EURUSD entered a clear range, where price consolidated between key highs and lows, indicating temporary balance between buyers and sellers. Multiple internal reactions and false moves within this range highlighted uncertainty and distribution near the highs. After topping out, price turned around and transitioned into a short-term descending channel, marking a shift in momentum. During this pullback, EURUSD broke below the range support and the descending channel support, confirming increasing bearish pressure. Price is now trading below the Resistance Level near 1.1720, which aligns with the former breakout area and the Seller Zone, reinforcing it as a strong supply region. The recent breakout below this level suggests sellers are gaining control in the short term. Currently, price is reacting around the Buyer Zone near the Support Level around 1.1670. This area aligns with prior demand and has already produced a small bounce, indicating potential short-term reaction. However, the overall structure remains corrective within the broader move. My scenario: as long as EURUSD remains below the 1.1720 Resistance Level, bearish pressure is likely to persist, with TP1 targeting the 1.1640 Support Level. A clear breakdown below support would open the door for further downside continuation. Conversely, a strong reclaim and acceptance back above resistance would invalidate the bearish bias and signal a potential trend shift. For now, price is at a key decision zone where sellers hold the advantage while support is being tested. Please share this idea with your friends and click Boost 🚀

XAUUSD Long: Demand Holds at 4,400 - Push Toward 4,500 in FocusHello traders! Here’s a clear technical breakdown of XAUUSD (2H) based on the current chart structure. XAUUSD previously moved within a steady bullish structure, respecting a rising trend line that supported price during multiple pullbacks. After a strong impulsive rally, Gold transitioned into a consolidation phase, forming a well-defined range that highlighted temporary balance between buyers and sellers. This range eventually resolved to the upside with a breakout, confirming bullish continuation and renewed buyer control.
Currently, XAUUSD is trading between the 4,400 Demand Zone and the 4,500 Supply Zone, with price holding above the rising trend line. This shows that bullish structure is still intact, but price is once again approaching a key resistance area where a reaction is likely.
My scenario: as long as XAUUSD holds above the 4,400 Demand Zone and respects the rising trend line, the broader bullish bias remains valid. A clean breakout and acceptance above the 4,500 Supply Zone would confirm continuation toward higher levels. However, if price is rejected from supply and breaks back below demand, this could trigger a deeper corrective move toward the trend line. For now, price is compressing between demand and supply, and a decisive move is expected soon. Manage your risk!

XRP - From Support to Momentum Shift!Let’s break this one down step by step.
On the left chart, (Weekly chart) XRP just rejected a very strong weekly support zone around $1.75 – $1.90. This level has been rejected multiple times in the past, and once again, buyers stepped in!
Now shifting to the right chart , (Daily chart) this is where things get interesting.
After months of downside pressure, momentum officially flipped from bearish to bullish. XRP managed to:
• Break above the falling red channel
• Take out the last major daily high marked in blue
That’s a classic sign of a momentum shift, not just a random bounce.
At the moment, price is correcting, which is healthy after such a move.
As long as this correction remains controlled, my focus is simple:
I’ll be looking for longs, targeting the supply zone marked in green above.
If structure continues to hold, dips are no longer something to fear... they’re something to watch closely.
Is this the start of a larger XRP rotation… or just the first step? 🤔
⚠️ Disclaimer: This is not financial advice. Always do your own research and manage risk properly.
📚 Stick to your trading plan regarding entries, risk, and management.
Good luck! 🍀
All Strategies Are Good; If Managed Properly!
~Richard Nasr

BTCUSDT: Sellers Defend 91,800 as Bullish Momentum WeakensHello everyone, here is my breakdown of the current BTCUSDT setup.
Market Analysis
BTCUSDT spent a significant period trading inside a well-defined range, where price oscillated between clear support and resistance levels, showing indecision and balanced participation from both buyers and sellers. Multiple breakout attempts from this range failed, confirming the strength of the boundaries and the lack of sustained momentum during that phase. Eventually, price broke out of the range to the upside and transitioned into a clean ascending channel, signaling a short-term bullish shift. This move was supported by higher highs and higher lows, reflecting increasing buyer control. However, as price approached the major Resistance Zone around 91,800, bullish momentum started to fade. The market printed reactions and hesitation near this resistance, indicating strong selling interest at higher levels.
Currently, the upper boundary of the ascending channel is being tested, and price is currently struggling to hold above the 90,000 Support Zone, which previously acted as a key breakout and demand area. The recent price action suggests that the upside move is losing strength and may be corrective rather than impulsive.
My Scenario & Strategy
My primary scenario: as long as BTCUSDT remains below the 91,800 Resistance Zone and fails to reclaim the upper part of the ascending channel, the bias favors a short-term bearish correction. A rejection from resistance increases the probability of a pullback toward the 90,000 Support Zone, which is the first key downside target. If this support fails to hold, further downside continuation toward lower range levels becomes possible.
However, a strong bullish breakout and acceptance above 91,800 would invalidate the short bias and open the door for renewed upside continuation within or above the channel. For now, price is at a critical decision area, with sellers defending resistance and buyers attempting to hold structure. Caution and proper risk management are essential in this zone.
That's the setup I'm tracking. Thank you for your attention, and always manage your risk.

XAUUSD: Buyers Defend Support, Retest of 4,490 ResistanceHello everyone, here is my breakdown of the current XAUUSD setup.
Market Analysis
Gold previously traded under pressure near a descending triangle resistance line, where price action was compressed before buyers stepped in. After forming a solid base, XAUUSD broke above the triangle resistance and confirmed a bullish structural shift. This breakout initiated a steady upside move, supported by a rising trend line and a clear sequence of higher highs and higher lows. Following the initial breakout, price entered a range, signaling temporary consolidation and accumulation. Buyers eventually gained control again, leading to a clean breakout above the range and continuation higher. This move brought gold into the key Resistance Zone around the 4,490–4,520 area, where price was recently tested and met with strong selling pressure.
Currently, after the rejection from resistance, XAUUSD pulled back sharply but found demand near the Support Zone around 4,310, which aligns with a previous breakout level and the rising support line. The current price action shows a corrective pullback rather than a full trend reversal, with buyers stepping in to defend this support area. The structure remains constructive as long as price holds above this key demand zone.
My Scenario & Strategy
My primary scenario: as long as XAUUSD holds above the 4,310 Support Zone and respects the rising support line, the bullish bias remains intact. I expect buyers to continue defending this area and attempt another push toward the 4,490 Resistance Zone as the next upside objective.
However, a decisive breakdown below support would weaken the bullish structure and open the door for a deeper corrective move. Until that happens, the overall structure favors continuation to the upside after consolidation.
That’s the setup I’m tracking. Thank you for your attention, and always manage your risk.

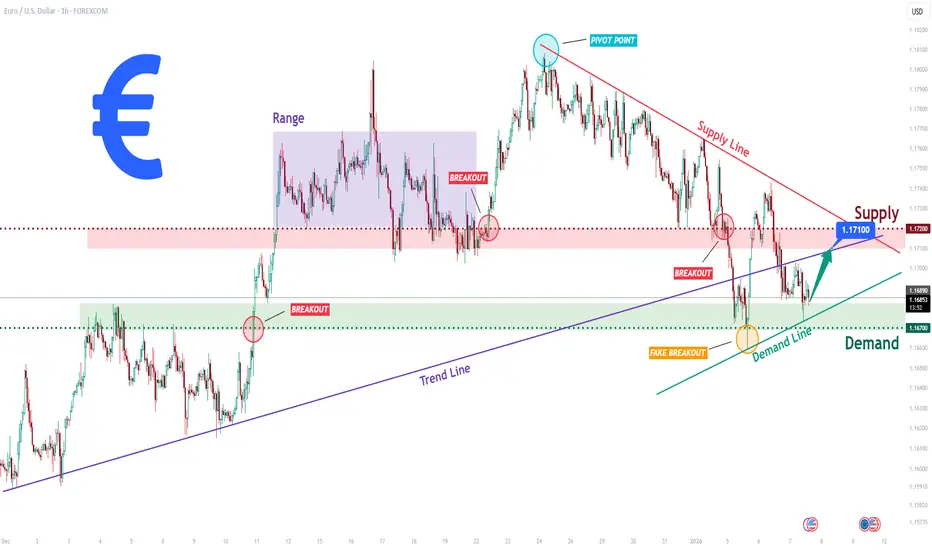
EURUSD Short: Supply Holds Strong - Market Eyes 1.1680 DemandHello traders! Here’s a clear technical breakdown of EURUSD (3H) based on the current chart structure. EURUSD is trading within a broader bullish structure, supported by a well-defined ascending trend line that has guided price higher from the previous pivot low. Earlier, the market spent time consolidating inside a range, indicating accumulation before the upside expansion. A strong impulsive breakout from this range confirmed buyer control and triggered a bullish continuation move. As price advanced, EURUSD reached a key Supply Zone around 1.1750–1.1760, where selling pressure became visible. Multiple attempts to push above this area resulted in fake breakouts, clearly signaling buyer exhaustion and the presence of strong sellers at higher levels. The chart highlights several failed breakouts and rejections from the supply line, reinforcing this zone as a critical resistance.
Currently, after the rejection from the upper highs near the pivot point, price broke below the short-term structure and is now trading below the supply line, suggesting a loss of bullish momentum. The recent bounce appears corrective rather than impulsive, indicating that the market may be preparing for a deeper pullback rather than immediate continuation higher. Below current price, the Demand Zone around 1.1680 stands out as the next major downside target. This level previously acted as support and aligns with a key horizontal demand area where buyers may attempt to step back in. A move toward this zone would represent a healthy correction within the broader structure.
My scenario: as long as EURUSD remains below the 1.1750 Supply Zone and continues to respect the descending supply line, the short-term bias favors sellers. I expect downside continuation toward the 1.1680 Demand Zone. A strong bullish reaction from demand could lead to consolidation or a corrective bounce, but a clean breakdown below 1.1680 would signal a deeper bearish correction. For now, price is at a key decision area, with sellers in control below supply and demand acting as the main downside objective. Manage your risk!

Latest Gold Price Update TodayGold closed the January 6 trading session up 45 USD at 4,494 USD. The bullish momentum continued into this morning, with prices briefly touching 4,500 USD, moving closer to the previous peak of 4,549 USD set on December 24, 2025.
Safe-haven demand remains strong following the U.S. military strike in Venezuela and the arrest of President Nicolás Maduro over the weekend, which has heightened geopolitical uncertainty and supported gold prices.
Investors are also closely awaiting today’s U.S. employment report for further clues on the Federal Reserve’s interest rate outlook. If the data aligns with expectations for a more accommodative policy stance, the current uptrend in gold could strengthen further.

Rebote en soporte, atención a continuación XAUUSD viene consolidando dentro de un rango bien definido.
El retroceso actual se da sin ruptura de estructura, manteniendo la zona de demanda intacta.
Mientras el precio se sostenga por encima del soporte, el sesgo sigue siendo alcista, con expectativa de ruptura del techo.
📈 Idea principal — BUY continuation (ruptura de 4500)
XAUUSD is consolidating within a well-defined range.
The current pullback is taking place without a break in structure, keeping the demand zone intact.
As long as price holds above support, the bias remains bullish, with expectations of a breakout above the range high.
📈 Main idea — BUY continuation (4500 breakout)
The expected scenario is for price to complete the pullback, regain momentum, and break above the 4500 area with confirmation, continuing the previous impulse.
Entry (BUY):
Confirmed breakout of 4486–4490, with a strong close on M15/H1 and continuation.
Stop Loss (SL):
4476
(A move back below this level invalidates the breakout and returns price to the range.)
Take Profit (TP):
TP1: 4498–4500
TP2: 4520
TP3: 4545–4555
🧠 Management and validation
As long as price remains above 4470, the continuation scenario stays valid.
Shallow pullbacks or minor rejections are normal before a clean breakout.
A sustained close below 4470 invalidates the continuation bias and puts the market back into range.
📰 Macro & geopolitical context (extra)
Markets are closely watching the upcoming U.S. employment data, which could set the tone for the dollar and bond yields—key drivers for gold in the short term.
At the same time, the broader geopolitical backdrop continues to support defensive demand, helping to limit deeper pullbacks while global uncertainty remains elevated. PYTH:XAUUSD

EURUSD Attempts a Modest ReboundHello everyone, what’s your view on FX:EURUSD today?
EUR/USD has staged a modest recovery, supported by improving risk sentiment as traders grow less concerned about the situation in Venezuela.
From a fundamental perspective, the U.S. dollar remains relatively strong as investors await clearer signals on the Federal Reserve’s monetary policy path for 2026. Meanwhile, the euro continues to face pressure from weak growth prospects in the euro area and expectations that the ECB will maintain an accommodative stance.
On the H4 chart, EUR/USD is still approaching the upper boundary of its trendline, with recent rebounds largely technical in nature. The 1.174–1.176 zone acts as the nearest resistance ahead of the psychological 1.180 level, while 1.1650–1.1680 remains a key support area. As long as price holds above this support, buyers remain relatively safe.
What’s your take on this pair?

AUDJPY WILL KEEP GROWING|LONG|
✅AUDJPY strong bullish displacement confirms an ICT breakout above the key level. Previous resistance flips into support, with price likely to retest the zone before continuing toward buy-side liquidity and higher targets. Time Frame 3H.
LONG🚀
✅Like and subscribe to never miss a new idea!✅

Gold Surges as Bullish Outlook StrengthensHello everyone, what’s your take on gold prices today?
At the start of the new trading week, gold jumped to 4,420 USD, posting a gain of more than 90 USD after the United States concluded its military operations in Venezuela.
According to the Kitco News Annual Gold Survey, the majority of investors expect the precious metal to set new record highs above 5,000 USD in 2026, while only one in ten foresee prices falling below 4,000 USD.
More specifically, survey breakdown (475 retail investors):
29% (138 investors): Above 6,000 USD in 2026
42% (197 investors): 5,000–6,000 USD
19% (92 investors): 4,000–5,000 USD
10% (49 investors): 3,000–4,000 USD
In the short term, gold has successfully broken above the 4,400 USD level. If conditions remain favorable, 4,550 USD stands out as the next upside target and represents the path of least resistance.
From my personal perspective, I remain bullish on gold—what about you?

FTAI – Momentum & Volume Align for Trend ContinuationFTAI – CURRENT PRICE : 196.85
FTAI remains in a strong bullish trend, supported by recurring momentum and volume behavior. The two vertical green lines highlight previous periods where RSI entered extreme bullish territory above 70, and in both instances, price continued to advance rather than form a top. The same momentum condition is now present again, suggesting RSI strength is acting as trend confirmation, not exhaustion.
Look at the volume pointed by red arrow. On 30 July 2025, there was a gap up with high volume, from there the stock continue rises - indicating strong buying interest. Now same scenario happens (30 DECEMBER 2025 candle) - gap up with strong volume (hint a strong bullish momentum). Take note also that there is a rising support line - indicating demand is getting higher. There is possibility that the stock may trend higher in near term.
ENTRY PRICE : 195.00 - 197.00
FIRST TARGET : 216.00
SECOND TARGET : 226.00
SUPPORT : 176.00

GE40 (DAX): Structural Breakout — Bulls Targeting 25,000
Macro Environment: Investors are currently digesting a "Santa Rally" while eyeing the upcoming Fed Minutes for clues on 2026 monetary policy. Despite thin year-end liquidity, the technical structure remains exceptionally bullish as fiscal reform optimism offsets manufacturing weakness.
Technical Analysis
The H4 chart reveals a decisive shift in market regime:
The Breakout: Price has cleared a multi-month descending trendline and a major horizontal ceiling at 24,400.
Base Formation: A clean accumulation zone (grey box) acted as a launchpad, confirming strong institutional demand at lower levels.
Momentum: The successful flip of previous resistance into support suggests a "Buy the Dip" environment.
Order Swing Set-up: LONG
Entry: 24,476 (Ideally on a retest of the breakout level)
Take Profit: 25,006 (Key psychological level & measured move target)
Stop Loss: 24,195 (Protected below the recent consolidation base)
Risk/Reward Ratio: ~ 1:1.8
⚠️ DISCLAIMER: This post is for educational purposes and personal opinion only; it is not financial advice. Trading indices involves significant risk, especially during low-liquidity holiday periods. Please Do Your Own Research (DYOR) and manage your risk strictly.

EURUSD: Fake Breakout at Resistance Signals Move Toward 1.1680Hello everyone, here is my breakdown of the current EURUSD setup.
Market Analysis
EURUSD previously traded inside a clear downward channel, reflecting sustained bearish pressure during that phase. After forming a base, price broke out of the descending channel and transitioned into a strong upward channel, confirming a shift in market control toward buyers. This bullish leg was supported by a sequence of higher highs and higher lows, showing healthy upside momentum. As price approached the key Resistance Zone around 1.1770–1.1780, bullish momentum started to weaken. Multiple attempts to break above this resistance resulted in fake breakouts, signaling strong seller interest at the highs.
Currently, following these rejections, EURUSD failed to hold above the upper boundary of the ascending channel and broke below short-term support, indicating a loss of bullish structure. Price is now compressing below resistance and forming a structure that resembles a triangle breakdown, suggesting increasing downside pressure. Below current price, a well-defined Support Zone around 1.1680 stands out as the next key area where buyers may attempt to defend and slow the decline.
My Scenario & Strategy
My primary scenario: as long as EURUSD remains below the 1.1770 Resistance Zone and continues to respect the broken channel / triangle resistance, the bias favors sellers. Any pullbacks toward resistance that show rejection can be considered short opportunities, with downside continuation toward the 1.1680 Support Zone as the main target.
However, a clean breakout and acceptance back above resistance would invalidate the short scenario and signal a potential return to bullish continuation. Until then, structure and price action favor further downside or corrective movement lower.
That's the setup I'm tracking. Thank you for your attention, and always manage your risk.

EURUSD Long: Compression Near Key Zones Signals Upcoming MoveHello traders! Here’s a clear technical breakdown of EURUSD (1H) based on the current chart structure. EURUSD previously traded within a well-defined ascending structure, respecting a rising trend line that acted as dynamic support during multiple pullbacks. This bullish phase showed consistent higher lows, confirming buyer control. After the impulsive upside move, price entered a consolidation range, highlighted on the chart, where buyers and sellers temporarily reached equilibrium. From this range, EURUSD executed a bullish breakout, confirming continuation and pushing price toward the upper structure. However, as price approached the Supply Zone around 1.1720–1.1750, bullish momentum started to fade. Multiple reactions, including fake breakouts and rejections near the pivot point, clearly signal strong selling pressure in this area. A descending Supply Line now caps price, reinforcing bearish pressure from above.
Currently, on the downside, price recently swept below short-term support, forming a fake breakout into the Demand Zone around 1.1670, which aligns with an ascending Demand Line. The quick recovery from this area suggests active buyers defending demand and preventing deeper downside for now. Currently, EURUSD is compressing between demand support and descending supply resistance, indicating a tightening structure and an upcoming directional move.
My scenario: as long as EURUSD holds above the 1.1670 Demand Zone and respects the rising demand line, a corrective bounce toward the 1.1710–1.1720 Supply Zone is possible. This area remains a key decision point. A strong rejection there would favor renewed bearish continuation, while a clean breakout and acceptance above supply would invalidate the bearish pressure and open the door for bullish continuation. Manage your risk!
BTCUSDT: Bullish Structure Intact - Targeting 93K ResistanceHello everyone, here is my breakdown of the current BTCUSDT setup.
Market Analysis
BTCUSDT previously traded inside a well-defined consolidation range, where price moved sideways and volatility was compressed, showing balance between buyers and sellers. During this phase, multiple internal swings failed to establish a clear trend direction. Before the range, price experienced several fake breakouts near the upper highs, highlighting strong selling pressure inside the 93,000 Resistance Zone, where buyers repeatedly failed to gain acceptance.
Currently, price is trading above the support zone and consolidating below the key 93,000 Resistance, where selling pressure previously emerged. The structure remains constructive, with higher highs and higher lows still intact, suggesting the move is corrective rather than a full reversal.
My Scenario & Strategy
My primary scenario: as long as BTCUSDT holds above the 90,800 Support Zone and respects the rising trend line, the bullish bias remains valid. I expect price to consolidate and potentially push higher toward the 93,000 Resistance, which acts as the next major upside objective (TP1). A clean breakout and acceptance above the resistance zone would confirm bullish continuation and open the door for further upside expansion.
However, a decisive breakdown below support and the trend line would invalidate the long setup and signal a return to range behavior or deeper correction. For now, buyers remain in control while support holds.
That's the setup I'm tracking. Thank you for your attention, and always manage your risk.

XAUUSD Rising Support Holds - Next Target 4,500 ResistanceHello traders! Here’s a clear technical breakdown of XAUUSD (4H) based on the current chart structure. After a prolonged consolidation phase, Gold was trading inside a well-defined range, indicating balance between buyers and sellers. This range acted as an accumulation zone before price initiated a bullish expansion. Following the breakout from the range, XAUUSD entered an ascending channel, confirming a shift toward buyer control with a sequence of higher highs and higher lows. During this phase, price respected both the channel support and resistance lines, using them as dynamic structure levels. As price approached the upper boundary of the channel and the Resistance / Seller Zone around 4,500–4,510, bullish momentum started to weaken. Multiple fake breakouts above resistance signaled strong selling pressure at the highs. This led to a sharp corrective move lower, where price broke below short-term structure before finding support. Currently, XAUUSD is holding above the Buyer Zone around 4,400, which aligns with a key Support Level and a prior breakout area. Price has already shown a reaction from this zone and is now forming higher lows along a newly respected rising support line, suggesting buyers are attempting to regain control. The recent breakout back above local resistance reinforces the idea of a corrective pullback rather than a full trend reversal. My scenario: as long as XAUUSD holds above the 4,400 Buyer Zone and respects the rising support line, the bullish bias remains valid. I expect buyers to defend this area and attempt another push toward the 4,500 Resistance / Seller Zone (TP1). A clean breakout and acceptance above this level would confirm bullish continuation and open the path for further upside. However, a decisive breakdown below the buyer zone would weaken the structure and increase the risk of a deeper correction back toward lower support levels. Please share this idea with your friends and click Boost 🚀

SEAMEC LTD - Weekly Falling Trendline Breakout📊 SEAMEC LTD – Weekly Falling Trendline Breakout Attempt 🚀
📅 Updated: Dec 03, 2025 | ⏱️ Timeframe: 1W
CMP: ₹987.85 (+2.81%)
Ticker: NSE:SEAMECLTD
🔍 Technical Overview
SEAMEC is showing strong bullish momentum on the weekly timeframe, attempting a breakout above a 1.5-year falling trendline drawn from 2024 highs.
A strong base formation is also visible:
🟦 Demand Zone (Support Block): ₹830–₹870
Price has respected this demand zone multiple times, creating a rounded accumulation base.
📈 Current Move:
Breakout candle touching the trendline
Higher lows forming since August 2025
Volume expansion on recent bullish candles indicating accumulation
A confirmed breakout above the falling trendline could mark the beginning of a fresh medium-term uptrend.
🎯 Chart Summary
SEAMEC is showing signs of reversing its prolonged downtrend.
Breakout confirmation above ₹1,030 may open the path toward:
🎯 Targets:
₹1,120 (supply zone)
₹1,210 (swing high)
A close above the trendline with volume would validate the reversal.
⚠️ Disclaimer
This analysis is for educational and chart-study purposes only. Not financial advice. Always do your own research before trading.

AUD-NZD Bullish Breakout! Buy!
Hello,Traders!
AUDNZD breaks structure with strong bullish displacement, confirming demand absorption and a clean SMC breakout. Prior consolidation flips into support, with price now targeting higher liquidity pools after a shallow pullback. Time Frame 6H.
Buy!
Comment and subscribe to help us grow!
Check out other forecasts below too!
Disclosure: I am part of Trade Nation's Influencer program and receive a monthly fee for using their TradingView charts in my analysis.

MarketViewLab | XAUUSD Breakout RetestMarketViewLab | XAUUSD Breakout Retest
XAUUSD (Gold) – 2H Chart Analysis
Structure: Consolidation breakout in progress
Market Bias: Bullish – monitoring continuation potential
Key Levels
• Support Zone: 4,390–4,410
• Resistance Zone: 4,560–4,700
Chart Context:
Price recently broke above a consolidation range after multiple tests of support.
The breakout shows improving momentum with higher lows forming.
Technical View:
• Break above range suggests strength returning to buyers.
• Retest toward 4,430–4,450 could act as a potential support zone.
• Continuation toward 4,560–4,700 remains possible if momentum holds.
(This analysis is for educational purposes only and does not constitute financial advice.)
