ASTS massive daily bull flagWith the cult like following on this ticker, a 4H break out and hold of this bull flag to the upside could see massive retail money piling in to send the price back to $54 ATH. RSI is also showing potential bullish confluence. The 4H chart has daily EMAs overlayed. The price is currently sitting above the daily 7EMA. Breakout above ATH and it's clear blue skies with no resistance. Huge potential.
Breakout

DOGE/USDT – Is Dogecoin About to Ignite Altseason Again?Hey Traders!
If you’re finding value in this analysis, smash that 👍 and hit Follow for high-accuracy trade setups that actually deliver!
Dogecoin just broke out of a multi-month descending wedge — and history tells us to pay close attention when this meme king wakes up. Let’s dive into why this setup could be the start of something massive.
📈 Chart Pattern
DOGE has been consolidating for months inside a falling wedge — a classic bullish reversal structure. It’s now finally broken out with strong volume confirmation, holding above the 50 EMA and showing signs of momentum building up.
🔍 Historical Clue
Remember what happened in the previous bull markets?
✅ 2021: DOGE exploded 2000%+ and triggered the craziest altseason ever.
✅ 2017: DOGE moved first, followed by hundreds of altcoins rallying massively.
Now, in 2025 — it looks eerily similar. Every time DOGE wakes up, it signals that retail and meme sentiment is heating up, a classic altseason ignition.
🎯 Trade Setup
Entry: $0.198 (Already triggered)
Targets:
TP1: $0.28
TP2: $0.42
TP3: $0.64
Stoploss: $0.162
Risk-Reward: Massive upside potential, with clearly defined invalidation.
💡 Final Thoughts
Altcoins are starting to follow. ETH has broken out. XRP is running. BTC dominance has rejected trendline resistance. Everything is aligning. If history repeats, this breakout in DOGE could mark the official start of Altseason 2025.
👉 Don’t sleep on DOGE. This might just be the trigger we’ve been waiting for.
📌 Follow for more setups & insights. Stay tuned!

HelenP. I Euro will drop more, breaking the support levelHi folks today I'm prepared for you Euro analytics. After analyzing the current structure of the EURUSD chart, I noticed a strong break of the ascending trend line, which had been respected for a long period. The price has now returned to test the broken trend line from below, aligning with the resistance zone between 1.1665 and 1.1700 points. This area used to serve as solid support, but after the breakout, it turned into resistance. The retest from below could become the final confirmation before the pair continues its downward movement. Right now, EUR is trading just inside this resistance zone. There is a small chance the price might move slightly higher to touch the upper boundary of the zone, but overall, the pressure looks bearish. I expect that after a minor bounce, EUR will decline again, breaking below the local support at 1.1665. Once that happens, a larger impulse down could be triggered, targeting even 1.1525 points, which is my main goal for this setup. This bearish scenario is supported by the failed attempts to recover above the trend line and the fact that previous support has already flipped to resistance. If you like my analytics you may support me with your like/comment.❤️
Disclaimer: As part of ThinkMarkets’ Influencer Program, I am sponsored to share and publish their charts in my analysis.

HelenP. I Bitcoin can continue to fall and break support levelHi folks today I'm prepared for you Bitcoin analytics. If we look at the chart, we can see that Bitcoin has been trading inside a well-defined upward channel. The price recently touched the upper boundary of this channel for the second time and formed a clear reaction, indicating strong resistance. After this, BTCUSD started to pull back from the resistance zone around 110300 - 109800 points. At the moment, it is trading slightly above this support area, but momentum is already shifting downward. Given this structure, I believe Bitcoin is likely to continue its decline and break below the support zone. The previous upward impulse has already lost steam, and there are no signs of strong buying activity around the current levels. The next logical target in this scenario is the lower boundary of the channel, near the 107500 level, where the trend line acts as dynamic support. This level has historically served as a rebound point, and I expect it to do so again. My current idea is short, aiming for a move down toward the trend line. If BTCUSD breaks through the first support and confirms the weakness, the price could fall quickly and test the next support area around 105600 - 105000 points. But for now, I will be watching the 107500 level closely. If you like my analytics you may support me with your like/comment ❤️
Disclaimer: As part of ThinkMarkets’ Influencer Program, I am sponsored to share and publish their charts in my analysis.

Bitcoin Breaks Out – The Final Test Has Begun 🚀🔥 Bitcoin Breaks Out – The Final Test Has Begun 💥📈
Boom! The breakout is here. After days of grinding under resistance, BTC has finally burst out of the channel — and all eyes are now on the monster level at $114,900.
📊 We spoke about this level again and again — the third macro test, the “HUGE-est Level EVER,” the battleground between Ultimate FOMO and End of Cycle.
⚠️ This breakout could lead to:
✔️ Acceleration to retest 114,900
✔️ A potential 3rd attempt to break the golden structure
✔️ Euphoria or exhaustion — no middle ground
🧠 Smart traders will remember:
– 8+ divergences still exist on higher timeframes
– The risk of failed breakout traps is high
– But this is what we’ve been waiting for: confirmation + continuation
🎯 If momentum holds, we may be on our way to test the upper macro structure. This is not the time to hesitate — it’s time to manage risk like a pro and track the flow.
💡 Catch up on the setup:
👉 Where Can Bitcoin Go? Part 8
👉 July 10th Market Outlook – Uncharted Waters
🗣️ It’s not about prediction — it’s about preparation.
We were ready. Are you?
One Love,
The FXPROFESSOR 💙
Disclosure: I am happy to be part of the Trade Nation's Influencer program and receive a monthly fee for using their TradingView charts in my analysis. Awesome broker, where the trader really comes first! 🌟🤝📈

Golden Cross on GME WeeklyGME Chart Breakdown, Déjà Vu or Destiny? Something big just lit up the weekly chart, the 50 MA has pierced through the 200 MA, forming that golden cross traders dream about. On the weekly timeframe. Not a drill.
Now, let’s rewind. The last time this pattern appeared? January 2021. The infamous squeeze. Back then, GME didn’t just nudge upward, it catapulted nearly 4000%, going from a $3 floor to $120 in a blink.
Fast forward to today, new golden cross, new setup, and a $23 floor. If history rhymes even remotely, we’re staring down a hypothetical $1000 per share move. Yes, one thousand.
Is lightning about to strike twice? Stay tuned to find out!

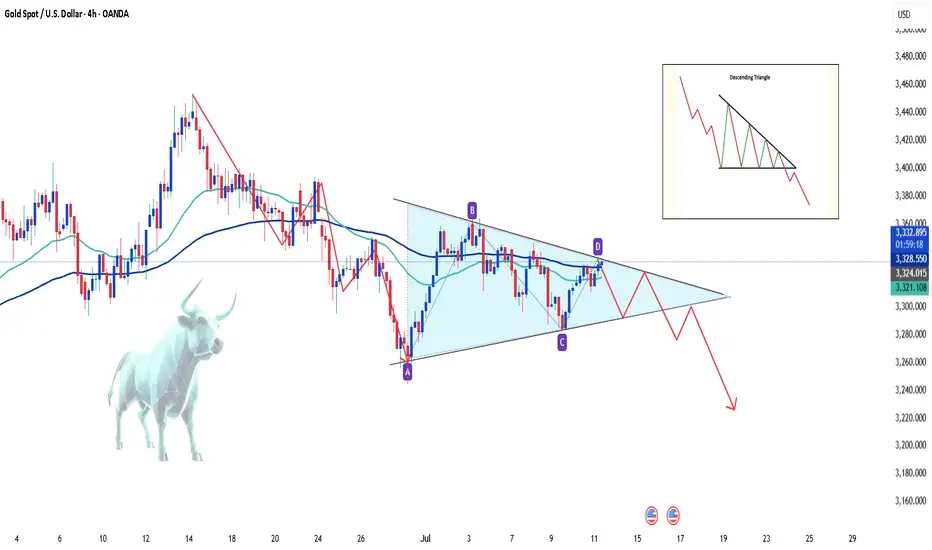
XAUUSD - Sell or Buy ? Hello everyone, great to see you again!
Today, OANDA:XAUUSD remains under notable pressure as the U.S. continues to signal a tougher trade stance. The latest move: the U.S. President announced a 50% import tariff on copper and a potential 200% tariff on pharmaceuticals, following a previous tariff notice ranging from 25% to 40% sent to 14 countries — including Japan, South Korea, Thailand, and Malaysia.
This isn’t just about protectionism. These measures fuel fears of global inflation, supply chain disruptions, and a broader economic slowdown. With surging prices in raw materials and essential goods, consumers may be forced to cut back spending, a classic warning sign for future growth.
In this environment, investors had hoped gold would shine again as a safe haven asset. However, the recent bullish momentum has been underwhelming, signaling ongoing market hesitation.
📉 On the H4 chart, XAUUSD is being squeezed into a descending pattern, which typically carries a high probability of a downside breakout. If the current support fails, the next target could fall below the 32xx area.
On the flip side, if supportive news emerges — such as a hint of rate cuts from the Fed — gold must break above the $3,335 level to revive bullish sentiment.
🔎 What do you think? Will gold break lower — or bounce back? Drop your thoughts below!
1INCH ANALYSIS🔮 #1INCH Analysis 🚀🚀
💲💲 #1INCH was trading in a Descending Broadening Wedge Pattern, give a perfect breakout and will retests the levels. If the price of #1INCH sustains the breakout then we will see a bullish move. 📈📈
💸Current Price -- $0.2220
📈Target Price -- $0.2510
⁉️ What to do?
- We have marked crucial levels in the chart . We can trade according to the chart and make some profits. 🚀💸
🏷Remember, the crypto market is dynamic in nature and changes rapidly, so always use stop loss and take proper knowledge before investments.
#1INCH #Cryptocurrency #Breakout #DYOR

ETHEREUM BREAKOUT CONFIRMED!Hey Traders!
If you’re finding value in this analysis, smash that 👍 and hit Follow for high-accuracy trade setups that actually deliver!
After months of consolidation inside this massive symmetrical triangle, ETH finally breaks out on the daily chart—and this could be the spark for the next major rally! 🔥
📈 Structure: Symmetrical Triangle
✅ Breakout Confirmed
📍 CMP: ~$2,760
🎯 Next Major Target: $5,000+
This is the breakout bulls have been waiting for! If momentum sustains, ETH could enter price discovery territory soon. Buckle up—the real move might just be beginning. 🚀
Let’s see how far it runs from here!
Drop your targets in the comments 👇

Gold Holds Its Structure – Retest in ProgressOANDA:XAUUSD Price continues to follow a clearly defined ascending channel, with consistently higher highs and higher lows – a textbook sign of a sustained uptrend. This bullish momentum indicates buyers remain in control, reinforcing the case for further upside.
A key resistance level was recently broken, and we’re now observing a classic retest scenario. That breakout? It matters. It’s not just a price move – it’s a structural shift. If the former resistance holds as support, this opens the door for a potential rally toward 3,351 – the upper boundary of the current channel.
But if that level fails, a mild pullback is likely, possibly a temporary drop before the market decides on its next move.
Bottom line: respect the structure. Don’t force trades without clear confirmation.

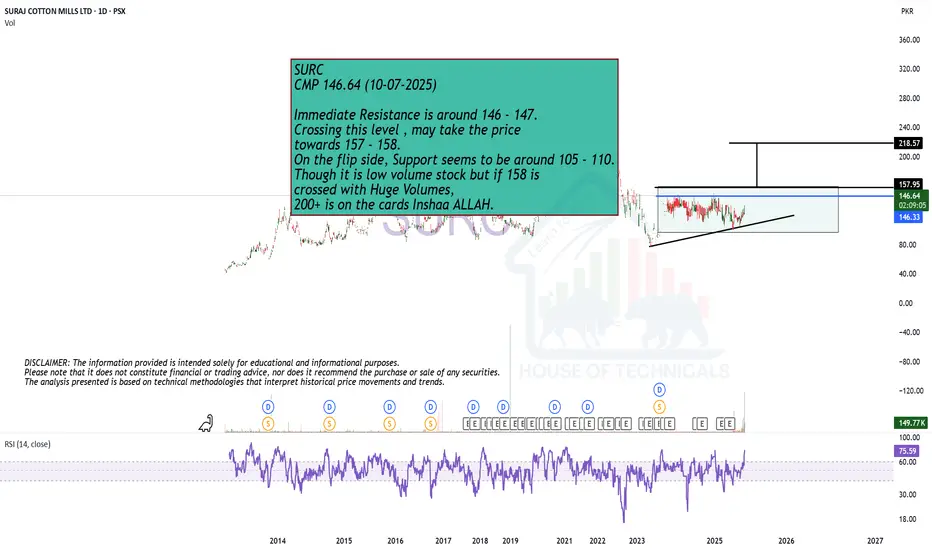
Breakout Expected.SURC
CMP 146.64 (10-07-2025)
Immediate Resistance is around 146 - 147.
Crossing this level , may take the price
towards 157 - 158.
On the flip side, Support seems to be around 105 - 110.
Though it is low volume stock but if 158 is
crossed with Huge Volumes,
200+ is on the cards Inshaa ALLAH.
XAUUSD BREAKOUT TRADE (READ CAPTION)hi trader's. what do you think about gold
current price: 3318
gold is breakout bullish trade line gold retest down side. then gold taking support and jump upside
support zone: 3314,3295
resistance zone :3345,3365
stop loss: 3282 market low

Ethereum Breakout Is Imminent!🚀 CRYPTO:ETHUSD is approaching the June peak, and a breakout would confirm a bullish sequence in play.
Upside targets are set at $3,600 – $3,960, aligning with key Fibonacci levels and challenging the 2024 highs.

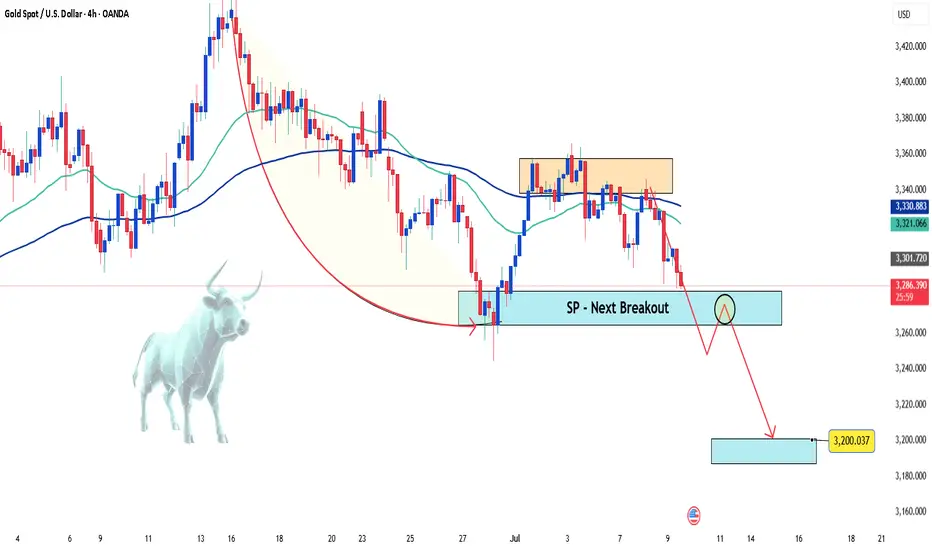
Gold Trade Setup – Long Invalidated, Watching Retest for ShortGold has been consolidating between $3,200 and $3,500, recently pressing against a descending resistance line that has rejected price several times. I was favoring the upside, but our long setup was invalidated — the stop loss at $3,330 was hit.
Price is now retesting ascending support, and I'm shifting focus to a short opportunity, using our previous long entry level (~$3,333) as a key area of interest for entries.
Here’s the updated plan:
Short Entry: Around $3,333
Stop Loss: $3,340
Take Profit: $3,303
Remaining cautious but opportunistic — the larger structure is vulnerable and could break further if support fails.

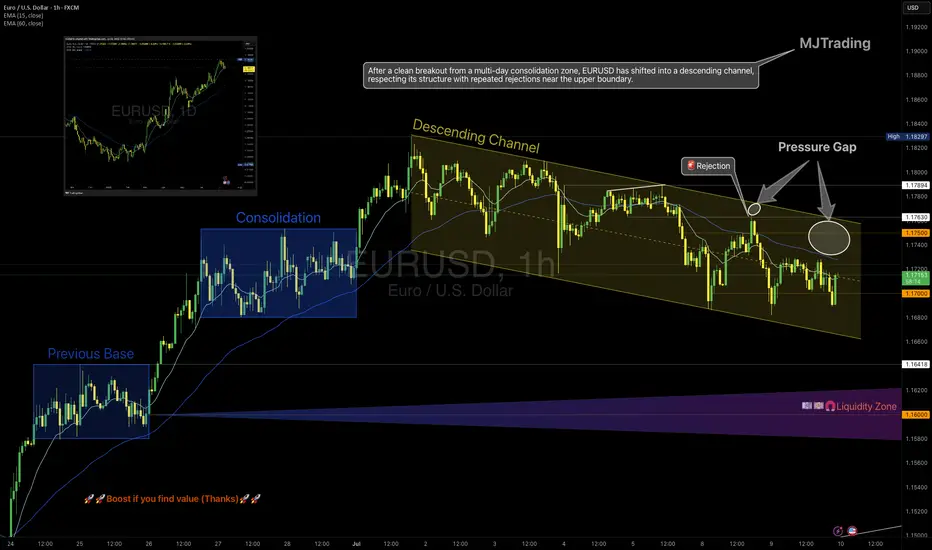
EURUSD – From Structure to Shift
1H Technical Outlook by MJTrading
EURUSD moved cleanly through a sequence of structural phases:
• Previous Base
• Multi-day Consolidation (potential quiet accumulation)
• Transition into a well-respected Descending Channel
Price has since shown repeated rejections from the upper boundary, including a decisive selloff from the 1.1750 zone, forming what we now label a "Pressure Gap" — a space where aggressive sellers overwhelmed price.
🧭 Key Scenarios Ahead:
🔻 Bearish Continuation:
Breakdown below 1.1700 opens room toward:
• 1.1640 (channel bottom)
• 1.1600 Liquidity Zone
Watch for impulsive sell candles + EMA rejection
🔁 Short-Term Bounce or Trap:
Holding above 1.1700 could spark a rebound toward 1.1750
This may serve as a final test before another leg lower
Only a clean break and hold above 1.1763 flips structure bullish
🔍 Bonus Confluence:
1D Chart shows broader bullish context (inset)
EMAs tightening = expect volatility burst
Well-defined structure gives clear invalidation and targets
Every trend tells a story — from base building to breakout, and now a possible breakdown. Trade the structure, not the prediction.
#EURUSD #Forex #TradingView #TechnicalAnalysis #PriceAction #DescendingChannel #LiquidityZone #SmartMoney #MJTrading
Hero MotoCorp — Daily Chart Breakout Trade SetupHero MotoCorp — Daily Chart Breakout Trade Setup
Range Bound: The stock has been consolidating between ₹4,170–₹4,400 for the past several weeks.
Structure: This is a classic rectangle consolidation, often a continuation pattern.
Volume: Watch for volume expansion on the breakout; prior breakouts lacked follow-through due to low volumes.
Higher Timeframe (Weekly/Monthly) charts show a bullish continuation since mid-May, with high-volume candles across weekly and monthly charts
Key resistance zones: Weekly resistance lies between ₹4,930–₹5,000.
Strong fundamental macro tailwinds: March sales show robust performance in both domestic ICE and EV segments (Vida)
🔍 Key Confirmation Signals for a Potential Trade
✅ Strong daily candle close above ₹4,420
✅ Above-average volume on breakout
✅ RSI crossing 60 on breakout adds momentum confirmation
⚠️ Risk Management Notes
Avoid early entry within the range (false breakouts possible)
Wait for EOD close above resistance for confirmation
Consider a trailing SL once the stock crosses ₹4,500

CAD_JPY BULLISH BREAKOUT|LONG|
✅CAD_JPY broke the key
Structure level of 107.400
While trading in a strong uptrend
Which makes me bullish biased
And I think that after the retest of
The broken level is complete
A rebound and bullish continuation will follow
LONG🚀
✅Like and subscribe to never miss a new idea!✅
Disclosure: I am part of Trade Nation's Influencer program and receive a monthly fee for using their TradingView charts in my analysis.

AUD_CAD WILL KEEP GROWING|LONG|
✅AUD_CAD is going up
Now and the pair made a bullish
Breakout of the key horizontal
Level of 0.8980 and the breakout
Is confirmed so we are bullish
Biased and we will be expecting
A further bullish move up
LONG🚀
✅Like and subscribe to never miss a new idea!✅
Disclosure: I am part of Trade Nation's Influencer program and receive a monthly fee for using their TradingView charts in my analysis.

Crypto at All Time Highs! But...Last month I shared a chart of an equal-weight crypto basket suggesting crypto may be on the cusp of fresh All Time Highs -- those highs have arrived! While that is certainly exciting for crypto holders one should take note of other aspects of the rally.
The US Dollar has depreciated substantially against foreign currencies this year (2025)
Bitcoin has yet to reach a fresh high against Gold
Bitcoin is strongly correlated to US equities, which are also at all time highs
USD Decline
The US Dollar is down a whopping 10% against a basket of foreign currencies this year, lead ostensibly by President Trump's raucous political policies, most notably aggressive tariffs across the globe and industries. The crypto rally therefore could be characterized as more of a Dollar softening than a crypto strengthening.
Bitcoin v Gold
Bitcoin - still the epicenter of all things crypto has not topped Gold.
Gold in fact has been on a heater of late against the Dollar.
Many folks still regard Gold as "real money". As such crypto could be said to be in a "stealth bear market", especially considering the declining momentum against Gold while failing to match its highs.
Bitcoin v Stocks
Bitcoin is also strongly correlated to US equity performance, despite claims that it's a hedge. The correlation has only grown stronger as Bitcoin's price against the Dollar has soared.
That said, it does consistently outperform equities, as long as the music is still playing!
Closing Thoughts
Most people likely don't care about how Bitcoin is faring against Gold. Bitcoin, the highest quality form of crypto is itself still highly speculative. While an equal-weight basket of cryptos is impressively reaching an all time high against the Dollar, coins with smaller market caps will surely be the first to go when this speculative impulse subsides.
There's probably still some gas in the tank at this point, but now is a good time to consider trimming positions before you miss the chance 🤑

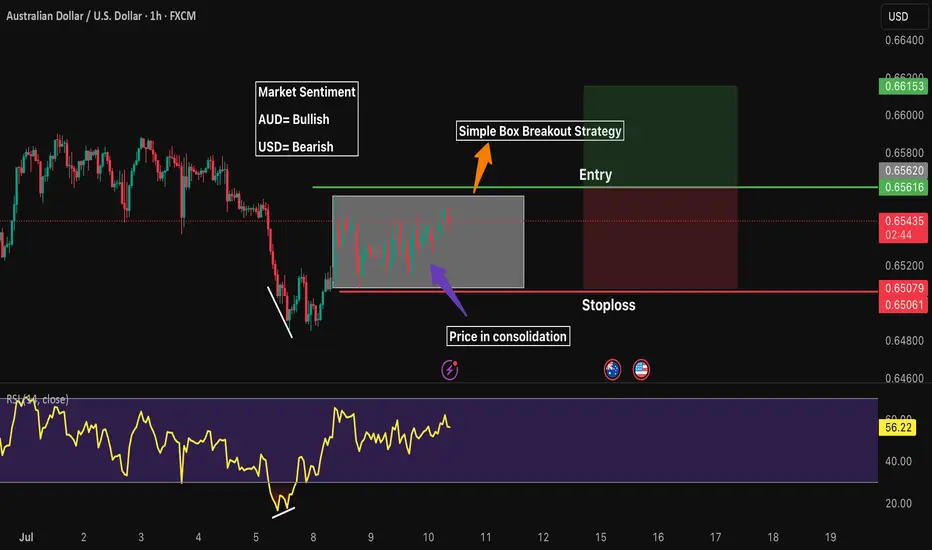
AUDUSD 1H LongMarket Sentiment
AUD= Bullish
USD= Bearish
Waiting for price to breakout from its consolidation box
RR 1:1
Gold Loses Its Shine – Short-Term Sentiment Turns BearishHello everyone, great to see you again for today’s market chat!
The factors that once made gold appealing — inflation fears, economic uncertainty, and the flight to safety — are gradually fading. As confidence grows that the Fed will maintain high interest rates for an extended period, capital is steadily moving away from gold and into more stable, yield-generating assets.
Across the financial community, there’s growing consensus: gold is no longer a top investment priority. The U.S. dollar is gaining strength, Treasury yields are rising, and gold’s support structure is weakening. While investors await the Fed’s next move, many are staying on the sidelines — or even leaning toward a bearish outlook. Notably, the rebound in the DXY is also playing a key role in adding pressure.
Gold is currently lacking momentum, lacking support, and most of all — lacking conviction. At this stage, the trend is no longer a debate, but a widely accepted short-term reality.
What about you — where do you think gold is headed next?
USD-CHF Bearish Flag! Sell!
Hello,Traders!
USD-CHF is trading in a
Downtrend and the pair broke
Out of the bearish flag so
We are bearish biased
And we will be expecting
A further bearish move down
Sell!
Comment and subscribe to help us grow!
Check out other forecasts below too!
Disclosure: I am part of Trade Nation's Influencer program and receive a monthly fee for using their TradingView charts in my analysis.

DYDX Breakout from Falling Wedge | Targeting $1.60+# DYDX Breakout from Falling Wedge | Targeting $1.60+
📈 **DYDX/USDT Analysis – Daily Timeframe**
DYDX has just broken out of a falling wedge pattern – a classic bullish reversal formation – after holding a strong support zone around **$0.50**. This zone has acted as a reliable demand area for several months.
---
🔍 **Technical Highlights:**
- ✅ Falling wedge breakout confirmed with daily candle close above resistance
- 🟢 Strong support at $0.50–$0.52
- ⚠️ Horizontal resistance at $0.75 may act as a short-term barrier
- 🚀 Potential rally toward major resistance at **$1.60–$1.70** (target zone)
---
🎯 **Profit Targets:**
- First Target: **$0.75**
- Final Target: **$1.60 – $1.70**
❌ **Invalidation (Stop-loss idea):**
- If price breaks below $0.48 with volume, the bullish scenario may be invalidated.
---
📊 This setup is based on breakout structure and potential trend reversal. If volume confirms, this could be the beginning of a new mid-term uptrend.
💬 Let me know what you think about this setup! Would love to hear your feedback.
