Elise | BTCUSD | 30M – Range Expansion SetupBITSTAMP:BTCUSD
After rejecting from the 93,500 resistance area, BTCUSD experienced a strong impulsive drop, sweeping sell-side liquidity before stabilizing at a key support level. The current structure shows consolidation above support, suggesting short-term accumulation. Buyers are active, but price still trades below major resistance, meaning confirmation is required.
This is a reaction-based trade, not a trend trade.
Key Scenarios
✅ Bullish Case 🚀
Condition: Hold above 86,200–85,100
🎯 Target 1: 88,800
🎯 Target 2: 90,000
🎯 Target 3: 92,000–93,500 resistance zone
❌ Bearish Case 📉
Condition: Breakdown & close below 85,000
🎯 Downside Target 1: 83,800
🎯 Downside Target 2: 82,000
Current Levels to Watch
Resistance 🔴: 90,000 – 93,500
Support 🟢: 86,200 – 85,100
⚠️ Disclaimer: This analysis is for educational purposes only. It is not financial advice
Btcusdlong

BTC Trade Set Up Dec 18 2025Price has pushed up higher off demand and is making HL on the 4h so i will want to see a slight pullback on lower time frames to then continue up to fill the 4h FVG

BTC Trade Set Up Dec 15 2025Price pushed down to SSL over the weekend has been engulfed back to the upside. Now price is trading in between a bullish and bearish 4h FVGs so i will want to see a push through either one of them to confirm either a continuation lower to demand and SSL or a reversal higher to BSL

BTCUSD: The Energy of an Upward WaveIn recent days, BTCUSD has shown a series of mixed movements, but the overall picture is gradually leaning toward growth. The wave structure suggests that the market is accumulating energy through short corrective pauses, creating a foundation for the continuation of the bullish impulse.
The chart shows that the price is holding in the upper part of the range, while downward fluctuations appear more like temporary pauses than full-fledged reversals. This reflects the resilience of buyer interest and the gradual strengthening of sentiment.
As a result, BTCUSD retains the potential to develop an upward wave, where further movement will depend on the market’s ability to confirm the strength of the current impulse and consolidate above local zones.

Bitcoin (BTC/USD) — Bullish Pullback Into Demand | 15-Minute ChaMarket Structure
Overall bias: Bullish
Price is moving inside an ascending channel, showing higher highs and higher lows.
The recent drop looks like a pullback within trend, not a trend break.
---
📉 Pullback & Demand Zone
Price pulled back from the upper part of the channel into a strong demand zone (red box).
Key demand levels:
88,768
88,404
This zone aligns with:
Previous consolidation
Prior impulse base
Mid/lower channel support
This increases the probability of a bullish reaction.
---
🔁 Expected Scenario (Primary)
1. Price holds above the demand zone
2. Forms a short-term base / higher low
3. Pushes back into the channel
4. Continuation toward the target zone
🎯 Upside Target
90,500 – 90,600 (marked “TARGET POINT”)
This is:
Channel resistance
Previous high liquidity area
---
⚠️ Invalidation / Risk
A clean 15m close below ~88,400
Breaks demand
Invalidates bullish setup
Opens downside toward 88,000 / 87,600
---
📊 Summary
Trend: Bullish continuation
Entry logic: Reaction from 88.4k–88.8k demand
Target: ~90.5k
Invalidation: Below 8

Waiting for BTC to break out and recover.BTC Trading Plan – Daily Timeframe
BTC is currently in a corrective phase within a larger downtrend, but signs of a potential base formation are emerging.
Key Technical Context
Price is moving inside a descending channel / falling wedge, often a bullish reversal structure if broken to the upside.
The 93.2K level is a critical breakout line. A confirmed daily close above this level would signal a shift in short-term momentum.
The zone around 100K–102K (purple area) is a major supply / resistance, aligning with the descending trendline and EMA resistance.
Strong demand remains at 83.5K–84K, which is the key downside support.
Trading Scenarios
Bullish Scenario
Daily close above 93.2K → continuation toward 100K–102K.
A clean breakout above 102K would open the path back to higher levels and trend reversal confirmation.
Bearish Scenario
Rejection below 93.2K keeps BTC in consolidation.
Breakdown below 83.5K could trigger a deeper drop toward the 79K region.

Bitcoin Breakdown Pullback Target Locked In📊 BTC Analysis – Breakdown With Incoming Retracement
Bitcoin has broken cleanly below the previous consolidation block, confirming a shift from neutral to bearish short-term structure. After the breakdown, price found temporary support around 90,000, where buyers are attempting a relief bounce.
Your chart highlights a likely retracement path toward the 92,500 – 93,000 zone.
This area lines up with:
The bottom of the last range (now turned resistance)
Ichimoku cloud resistance
A typical breakdown retest zone
A potential liquidity grab level before continuation
This makes it the most probable reaction zone for sellers to re-enter the market.
---
🔍 Key Technical Points
Trend: Short-term bearish after the breakdown.
Current Move: Relief bounce forming from local support.
Main Target: Retest into 92.5K–93K before resistance kicks in.
Expectation: BTC may bounce upward first, then face strong rejection from the marked zone.
Invalidation: A sustained break above 93,200 would weaken the bearish idea.

BTCUSD in Risk-Off Mode | Diversify & Scalp SmartBTCUSD Risk-Off Consolidation – Eyes on 70K Risk, Scalping to 100K
Bitcoin’s stuck in a risk-off rut, consolidating near 90,000–95,000 as global markets turn cautious. It’s not dumping yet, but a sell-off to 70,000 looms if sentiment worsens. Here’s my approach to navigate this:
Setup:
Current State: BTCUSD’s holding low, reflecting risk-off flows (flat 20-day EMA, RSI ~40). Volume profile shows weak support until 70,000.
Risk Warning: A break below 90,000 could trigger a slide to 70,000, a key demand zone with historical buying.
Strategy:
Scalping Start: Enter small-position scalps (0.01–0.02 lots) on intraday bounces (e.g., 4H bullish pin bars above 90,000), then manage into longer-term positions if momentum builds.
Diversification: Mitigate risk by trading other pairs (e.g., XAUUSD, EURUSD) with calculated entries. Use available margin and prop firm leverage (e.g., FTMO’s 1:100) wisely, keeping total risk at 10% max.
Position Management: Scale in cautiously, trailing stops to lock in profits. My long-term target is 100,000, but hope isn’t a strategy—small positions keep me flexible.
Market Context:
Risk-off sentiment (e.g., equity sell-offs, USD strength post-Fed) is capping Bitcoin’s upside. Recent highs near 103,000 (November 2025) faded fast, and low volume suggests hesitation. A 70,000 test is possible if macro fears grow, but 100,000 remains viable if safe-haven flows return. Volatility’s moderate (3–5% daily), ideal for scalping with tight risk.
Risk Warning: Don’t put all eggs in one basket. BTC’s downside risk demands diversification and strict risk management (10% max, per FTMO rules). Trade calculated, not emotional!
What’s your BTCUSD play?
Share your setups or risk-off strategies below!
#BTCUSD #Bitcoin #RiskOff #Scalping #RiskManagement

Btc Buy Setup Elliott Wave Analysis not an adviceThis count is based on my assumptions so anything can happen not a trading or financial advice just for educational purposes only kindly do your own ta thanks trade with care good luck.

BTC Dip and RipBTC appears to be repeating the pattern from a similar decline on December 10th by falling and consolidating around monthly VWAP (yellow dots). It swept a pocket of liquidity around 89,100-300 and cascaded lower during the low volume trading which was expected. The next large liquidity cluster on the weekly is around 95k, so I think we target that next. However, I'm targeting a more conservative range of 93,000-500 since this area has acted as very strong resistance lately and for the following reasons:
low amount of nearby short liquidations required to rapidly cascade upwards (toward 100k)
futures open interest is still bearish but modestly recovering
IBIT while put/call OI is bullish, the excessive calls (1.1MM vs. 617k puts) are acting as resistance due to spot hedging
dealer gamma positioning is positive which acts to dampen volatility (both directions)
I have also provided an alternate path which has BTC testing the lower trend line of the bear flag on the 1D chart. If this line breaks, then the measured move projects a potential low of $65k. I will definitely cut longs and flip short on a meaningful break of this trend line.
I opened at 90k on Friday. I expected the liquidity sweep but I'm trading IBIT options, which required a commitment before NY close. I expect the trade to play out by the end of this week.

Bitcoin (BTC/USD) Daily Chart: Downtrend Pressure with Early Sta
Trend: BTC is still trading below a clear descending trendline, confirming a broader bearish structure since the mid-year highs. Lower highs and lower lows remain intact.
Price Action: Current price is around $90,160, consolidating after a sharp sell-off in November. This looks like a pause or base-building phase, not yet a confirmed reversal.
RSI (≈44): RSI is below 50, indicating weak momentum, but it has stabilized above oversold territory. This suggests selling pressure is easing, though bulls are not in control yet.
MACD: MACD remains below the signal line, but histogram contraction hints at bearish momentum slowing. A bullish crossover would be an early reversal signal.
Momentum/Volume Indicator: Negative values persist, showing dominant bearish momentum, but the flattening bars imply reduced downside strength.
Key Levels:
Resistance: $95,000–$100,000 (trendline + prior support)
Support: $85,000, then $78,000
Outlook:
BTC is in a bearish-to-neutral transition zone. A daily close above the descending trendline with RSI reclaiming 50 would favor a trend reversal. Failure to hold $85,000 increases the risk of another leg down toward $78,000.

BTCUSD 15-Minute Chart – Symmetrical Triangle Consolidation withAnalysis:
Market Structure: After a sharp bearish impulse (strong sell-off), BTC entered a consolidation phase, forming a symmetrical triangle. This indicates balance between buyers and sellers after high volatility.
Trend Context: The impulse move before the triangle was downward, but price has stabilized and volatility is compressing — often a precursor to a strong breakout.
Pattern Details:
Lower highs and higher lows are clearly converging.
Price is currently near the apex, where breakout probability increases.
Bias:
The drawn plan suggests a bullish breakout scenario.
Entry is placed slightly above triangle resistance to avoid false breakouts.
Trade Plan (as illustrated):
Entry: On confirmed breakout above the triangle resistance
Target: Measured move projection upward (roughly equal to the triangle’s height)
Stop Loss (SL): Below triangle support to invalidate the setup
Risk–Reward:
Favorable R:R, as the stop is tight relative to the projected upside.
Confirmation to Watch:
Strong bullish candle close above resistance
Increase in volume on breakout
Failure signal if price breaks down instead and closes below support
Conclusion:
BTCUSD is coiling inside a symmetrical triangle after a high-momentum drop. The setup favors a volatility expansion trade, with a bullish breakout being the planned direction — but confirmation is essential. A downside breakout would invalidate the bullish bias and shift momentum back to sellers.

Bitcoin Shown OpportunityEntry taken after nearest 1H swing low got swept and sharp turn formed. A good question is will price hit our TP? Let's wait and see.👀

Elise | BTCUSD 30M - Recovery Into HTF ResistanceBITSTAMP:BTCUSD
The impulsive recovery suggests strong demand from lower levels, but current price is trading inside a prior distribution zone where reactions and pullbacks are expected. Trend remains bullish while holding above key intraday support.
Key Scenarios
✅ Bullish Case 🚀 → Hold above 91,400
🎯 93,400 → 🎯 94,000
❌ Bearish Case 📉 → Lose 91,000
🎯 90,400 → 🎯 89,800
Current Levels to Watch
Resistance 🔴: 93,400 – 94,000
Support 🟢: 91,400 / 91,000
⚠️ Disclaimer: This analysis is for educational purposes only. Not financial advice.

BTC Trade Set Up Dec 12 2025Price is making HH now i will want to see it sweep SSL to then make internal 15m-5m bullish structure to continue higher to BSL

BITCOIN - Buy BTCUSD nowBITCOIN (BTC/USD) has recently been stuck inside a triangle channel pattern and has struggled to break out for a few weeks. However, the price has recently broken a strong resistance level (the white trend line shown on the chart) - The price is currently above the trend line which acted as a strong resistance level and is now very likely to hit the next resistance zone which is labeled as the take profit level. buy BTCUSD now!

BTC Trade Secures 3800 pipsPrice swept external BSL which i expected price to pushdown to lower SSL which played out perfectly now i will want to see bullish structure from where its at or to come down lower to sweep SSL before continuing higher

BitcoinBTCUSD
- Bearish Channel as an corrective pattern in Long Time Frame
- Fair Value Gap
- Completed " 123 " Impulsive Waves
- Fibonacci Level - 38.20% / 50.00%
- Bullish Channel in Short Time Frame

“Bitcoin / U.S. Dollar” (BTC/USD) on the 4‑hour timeframe from B1. Price Movement: The candlestick pattern indicates an ascending trend channel (blue lines) with a recent breakout above the upper channel line (circled area), suggesting bullish momentum.
2. Target Point: A red horizontal line marks a target at 95,919.5, implying the expected upside if the bullish move continues.
3. Support Zone: A red shaded rectangle highlights a demand zone between 85,755.8 and 88,210.8, acting as a key support level.
4. Green Rectangle: Represents a potential profit zone extending from approximately 88,210.8 to the target 95,919.5, indicating an expected price surge.
5. Current Price: BTC/USD is trading around 92,089 (as of 02:50:26), sitting above the support and aiming for the target.
6. Analysis Implication: The setup suggests a bullish continuation after the breakout, with traders likely watching for sustained movement above the channel to confirm the upward run toward the target, while keeping an eye on the support zone for any reversal🚀📈

BTCUSD – PDH Reclaimed | Liquidity Sweeps on Both Sides BTC swept liquidity at the weekly high zone (94,116) and delivered a sharp rejection.
Price then dropped into the demand zone around the Previous Day Low (87,775–89,000), where strong buy interest stepped in twice.
Now price is trading back above PDH (91,778) and retesting intraday supply.
Key Points:
Multiple liquidity grabs on both ends
Buyers defended PD Low zone aggressively
Market reclaiming PDH hints at short-term bullish continuation
Break above 92,295 may open the path back toward the weekly high
Bias:
Bullish above PDH; neutral-to-bearish only if price falls back below 89,875.
BTC is preparing for a decisive move — watching reaction at intraday supply.

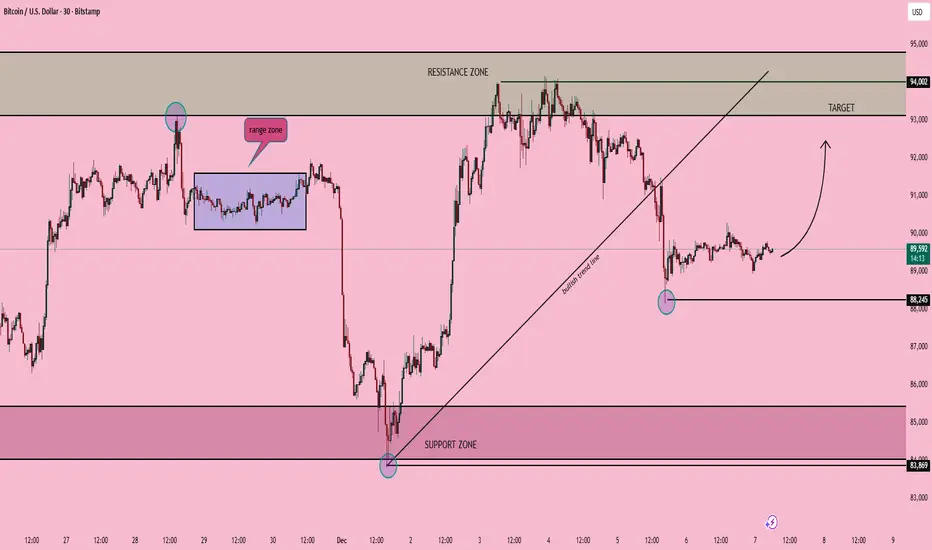
BTC/USD – Support Retest & Possible Recovery PathBITSTAMP:BTCUSD
If Bitcoin maintains support above 88,245, bullish recovery toward the previous 93,500–94,000 resistance zone becomes probable. This zone remains the main area where sellers previously controlled price, so a breakout confirmation is required for further continuation.
A breakdown below this structure exposes deeper liquidity levels toward 83,869 demand, where stronger buy reaction is expected.
Key Scenarios
🔵 Bullish Setup
Hold above 88,245 → break micro-range →
🎯 Target 1 → 91,200
🎯 Target 2 → 93,500
🎯 Target 3 → 94,000 (main resistance)
📌 Invalidation if price closes below 88,245
🔴 Bearish Setup (If Support Fails)
Break below 88,245 → continuation downwards
🎯 Target → 85,500
🎯 Target → 83,869 major demand
Possible reversal expected from demand block.
Current Levels to Watch
Resistance: 93,500 → 94,000
Support: 88,245
Demand: 83,869
⚠️ This is an educational analysis, not financial advice.
BTCUSD Technical Analysis (30m)This post provides an analytical breakdown of BTCUSD using the 30-minute timeframe (30m), leveraging our proprietary technical indicator: the Trend Break Target (TBT) Indicator.
Market Structure Shift and Indicator Activation
The current analysis focuses on a significant change in the market structure observed on the 30m chart. The TBT indicator was programmed to detect and react to specific conditions that signify a high-probability continuation or reversal.
Activation Signal: The indicator was activated and the price targets were subsequently generated following the closing of the specific candle indicated by the arrow on the chart. This close confirmed the necessary structural change (e.g., a break of resistance/support, or a specific pattern completion) required by the TBT's underlying logic. This market structure shift (MSS) provides the foundation for the calculated price objectives.
Calculated Price Targets (TBT Forecast)
Based on the activation of the Trend Break Target Indicator, the following potential price objectives have been calculated. These targets represent areas where price action is statistically likely to find resistance, profit-taking activity, or a high-probability exhaustion point for the current move.
🎯 Target 1 (T1): $90,400
Significance: This is the immediate and most probable objective, often representing a minimum measured move following the structure break.
🎯 Target 2 (T2): $91,450
Significance: A secondary, extended target that comes into play if bullish momentum persists and T1 is cleanly surpassed and held.
🎯 Target 3 (T3): $92,709
Significance: The final, ambitious target representing the full potential move calculated by the TBT model based on the initial structure shift. It acts as the high-end projection for the current impulsive wave.
Disclaimer
Note: This analysis is based on a proprietary indicator and should be used for informational and educational purposes only. Always manage your risk effectively, use appropriate stop-loss orders, and conduct your own due diligence before making any trading decisions. The crypto market is highly volatile, and actual price action may deviate from projected targets.

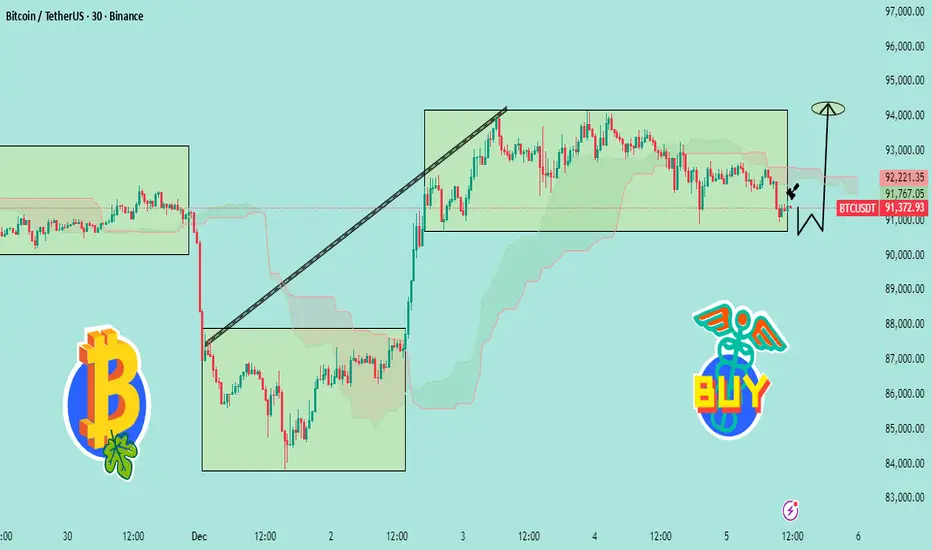
“BTC Bounce From Demand Zone – Targeting 94K Next📊 BTCUSDT Analysis (Based on Your Chart)
1️⃣ Price is Still Respecting the Range
Bitcoin is trading inside a wide consolidation box (around 91,000 – 93,000).
The recent drop tapped the bottom of the range, showing a clean liquidity sweep.
That wick below the box = fake breakdown → bullish signal.
---
2️⃣ Strong Reaction at Demand Zone
The chart shows BTC touching the demand/support zone, followed by a small bullish reaction (the black arrow).
This suggests:
Sellers failed to break lower
Buyers are stepping in exactly where expected
Market preparing for a reversal bounce
---
3️⃣ Expected Move (Your W Pattern Idea)
The drawn “W-shape” indicates a double bottom setup.
If the bottom holds around 91,000, BTC can push back toward:
🎯 Target: 93,500 – 94,000
This matches the upper boundary of the consolidation.
---
4️⃣ Bullish Scenario
If BTC holds above 91,000–91,300:
Reclaim mid-range
Break through resistance
Continue toward 94,000+
This aligns with the “BUY” tag you added.
---
5️⃣ Bearish Invalidations
Bullish idea is invalid if: ❌ Price closes below 90,800 on 30-minute
= fresh breakdown → deeper correction
---
🧠 Summary
BTC swept liquidity at the support → formed a bounce → still inside range → bullish reversal expected toward 94K