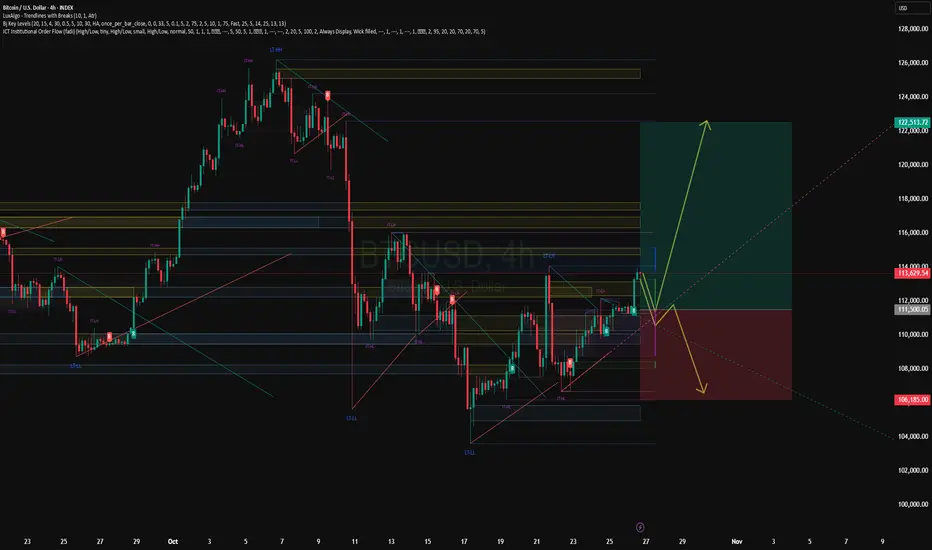
No Rise in Sight — 107K Might Be RightAt the moment, I don’t see any technical reasons for Bitcoin to continue its rally.
For now, I’d like to see Bitcoin move down toward the 107K area or even lower.
The invalidation level of this scenario is marked in red on the chart
Btcusdtlong

BTC $115,200 TARGET BREAKOUT: The Ultimate Long SignalThe Logic Behind $115,200: This analysis pinpoints the critical multi-year resistance/supply zone at $115,200. A confirmed close above this level is the ultimate trigger for the next parabolic leg up in the Bitcoin cycle. Our proprietary provides a filtered, no-noise signal specifically for this major breakout level. Key Features: * Precision Entry: Alerts only on the confirmed breach of the 115,200 supply * Risk Management: Includes projected Take Profit 1 & 2 targets * Filtered Noise: Uses to validate the move Action: Set your alerts and prepare for liftoff! The market structure dictates that this level is make-or-break for a new All-Time High pursuit.

BITCOIN BREAKOUT CONFIRMATION AND BULLISH CONTINUAION SETUPTechnical Analysis (3H Chart)
1. Market Structure:
The chart shows a clear uptrend phase earlier, followed by a corrective pullback.
Recently, Bitcoin has formed a Change of Character (CHoCH), indicating a potential shift back to bullish momentum after the correction.
Price has broken key resistance around $114,500–$115,800, confirming short-term bullish strength.
2. Key Zones:
Support Zone: $110,000–$112,000 (previous consolidation area; strong liquidity zone).
Resistance / Target Zone: $120,000–$121,000 (major supply area & top of descending channel).
3. Current Price Action:
BTC is currently testing the CHoCH breakout area (~$115,000–$116,000).
A minor pullback (retest) toward the breakout level is expected before another bullish leg begins.
The “eye” symbol suggests monitoring this retest for a long entry confirmation.
4. Target Projection:
If the breakout retest holds, the next target lies near $120,500, aligning with previous highs and upper trendline resistance.
5. Technical Outlook:
✅ Bias: Bullish (short to medium term)
📈 Entry Zone: $114,800–$115,500 (retest zone)
🎯 Target: $120,000–$121,000
🛑 Invalidation: Below $113,000 (structure break)

BTC: The overall trend remains oscillating upwardThe BTC is staying in the middle of the "support-resistance" range, with intense long-short competition, the overall trend remains oscillating upward
From a technical pattern perspective, the short-term support lies between 109,000 and 108,000. There have been multiple rebounds after stabilizing in this support range, indicating relatively strong buying support below. The resistance level at 113,000, as a previous pressure level, could open a new upward space toward 115,000 if it is broken with volume.
Considering the macroeconomic factors, if market risk appetite rises, Bitcoin is expected to test the resistance level upward based on the support range. If risk aversion heats up, we need to be vigilant about the risk of a pullback to test the support.
💎Trading Strategy:
Buy 110,000 - 110,500
SL 109,500
TP 111,000 - 111,500 - 112,000
Sell 112,000 - 111,500
SL 111,000
TP 110,500 - 110,000 - 109,500
Daily-updated accurate signals are at your disposal. If you run into any problems while trading, these signals serve as a reliable reference—don’t hesitate to use them! I truly hope they bring you significant assistance

BTC/USD: Final wave before breakout or correction signal?BTC/USD: Final wave before breakout or correction signal?
📊 Monthly Technical Analysis — Bitcoin (BTC/USD)
Using support/resistance levels and wave analysis
🌀 Wave Context
According to the Elliott Wave Principle model, Bitcoin may be either in the final impulse wave (5) or at the start of an A-B-C corrective structure.
Wave (4) is expected to have ended near the $100,000-$110,000 zone. If wave (5) starts, it could signal a significant upward move. Otherwise, a breakout of support could signal a correction.
📈 Monthly Scenarios
Bullish scenario: BTC holds above $110,000 → breakout to $120,000 → start of wave (5) → move to $135,000+.
Consolidation: The price moves sideways between ~$110,000 and ~$120,000, accumulating strength before a new move.
Bearish scenario: Breakout of support at ~$110,000 with volume → correction to ~$100,000 or lower.
✅Conclusion
On the monthly timeframe, BTC/USD is at a crossroads: it is either entering a powerful uptrend or a significant correction is beginning.
The ~$110,000 level is a key marker for the continuation of the bullish structure.
A breakout above $120,000 is a signal for growth.
A breakout below $110,000 is a signal for caution.
Monitor price movement relative to these levels and confirmation of the wave structure before making trading decisions.
BTCUSD: Final Wave Before the Breakout or Stuck Five-Wing?BTCUSD: Final Wave Before the Breakout or Stuck Five-Wing?
Weekly Scenarios
Bullish scenario: BTC holds above ~$110,000, breaks through ~$120,000 → wave (5) activates → target ~$135,000–$140,000.
Consolidation: Trading between ~$110,000 and ~$120,000; the market is building strength for the next round.
Bearish scenario: Break of support at ~$110,000 with volume confirmation → correction begins to ~$100,000–$105,000.
Conclusion
The weekly analysis shows that the BTC/USD market is at a crossroads: either the final wave of growth begins, or a correction begins.
Holding the ~$110,000 zone is critical for maintaining bullish sentiment.
A breakout above ~$120,000 is a signal for growth.
A breakout below ~$110,000 is a signal for caution.

Ready for BTC/USDT's Next Big Move?🎉 BTC/USDT: "Bitcoin vs. Tether" Crypto Wealth Heist Map (Swing/Day Trade) 🤑
🚨 Thieves of the Crypto Market, Assemble! 🚨
Ready to pull off a stylish swing/day trade heist on BTC/USDT? This is your Crypto Wealth Strategy Map with a bullish setup that’s screaming opportunity!
📈 Let’s dive into this cheeky yet professional plan with a sprinkle of thief swagger to snatch those profits! 💰
📊 The Setup: Why This Trade is a Steal! 🕵️♂️
Bullish Confirmation: We’ve got a double bottom pattern signaling a potential reversal. ✅
Accumulation Zone: Price action shows buyers stacking up, ready to push BTC higher. 🛒
Heikin Ashi Reversal: Smooth, green Heikin Ashi candles confirm the bullish vibes. 🟢
Market Sentiment: The crypto streets are buzzing with optimism — time to capitalize! 😎
The Thief’s Entry Plan: Layered Limit Orders 💸
This is where our thief strategy shines! We’re using a layering strategy with multiple buy limit orders to sneak into the market like the slick bandits we are. 🕴️
Entry Levels:
🎯 $112,000
🎯 $113,000
🎯 $114,000
🎯 $115,000
🎯 $116,000
Pro Tip: Feel free to add more layers based on your risk appetite! Stack those orders like a master thief planning the perfect heist. 😏
Why Layering?: This approach lets you average into the position, reducing risk if the market pulls a fast one. 🃏
🛑 Stop Loss: Protect Your Loot! 🔒
Thief’s Stop Loss: Set at $110,000. This is our escape hatch if the market turns into a trap. 🕳️
Note: Dear Thief OGs (Ladies & Gentlemen), this SL is just a suggestion. You’re the boss of your own vault — adjust it to your risk tolerance! 💪
🎯 Target: Cash Out Like a Pro! 🏦
Profit Target: Aim for $127,000, where we expect strong resistance and potential overbought conditions. Watch out for a possible trap — don’t get greedy! 😈
Note: Dear Thief OGs, this TP is my take. You decide when to grab your profits and vanish into the crypto night. 🌙 Take the money and run at your own discretion!
🔗 Related Pairs to Watch 👀
Keep an eye on these correlated pairs (all in USD) to confirm the broader market trend:
BITSTAMP:ETHUSD : Ethereum often moves in tandem with Bitcoin. A bullish ETH could reinforce BTC’s upward momentum. 📈
BITSTAMP:XRPUSD : Ripple’s price action can signal broader crypto market strength. Watch for similar bullish patterns. 🌊
COINBASE:LTCUSD : Litecoin tends to follow BTC’s lead. A breakout in LTC could confirm our bullish bias. ⚡
Key Correlation Insight: These pairs often move together due to shared market sentiment in the crypto space. If BTC/USDT pumps, expect ETH, XRP, and LTC to potentially follow suit. Cross-check their charts for confluence! 🧠
🛠️ Technicals Recap: The Thief’s Toolkit 🧰
Double Bottom: A classic reversal pattern signaling bulls are ready to charge. 🐂
Accumulation Zone: Buyers are quietly stacking positions — a sign of strength. 📦
Heikin Ashi: Smooth candles filter out noise, confirming bullish momentum. 🕯️
Resistance Watch: $127,000 is a key level where sellers might step in. Stay sharp! ⚠️
⚠️ Disclaimer: Thief Style, Just for Fun! 😜
This Thief Strategy is for entertainment and educational purposes only. Trading is risky, and the crypto market can be a wild ride. Always do your own research (DYOR) and manage your risk like a seasoned bandit. I’m not a financial advisor, just a cheeky chart enthusiast sharing the vibe! 😎
✨ If you find value in my analysis, a 👍 and 🚀 boost is much appreciated — it helps me share more setups with the community!
#BTCUSDT #CryptoTrading #SwingTrading #DayTrading #ThiefStrategy #Bullish #TechnicalAnalysis #HeikinAshi #DoubleBottom #MakeMoney

BTC: Correct prediction today👏Our prediction for Bitcoin's short-term fluctuation characteristics has also been accurately validated today.
✔We indicated that it would fluctuate around the key range in the short term, and in reality, Bitcoin has shown obvious wide-ranging fluctuations today, which is in complete alignment with the preset oscillation pattern.
✔Meanwhile, the market's competition for key levels has also confirmed our judgment:after testing the high level, the price gradually pulled back and then rebounded, highlighting the suppressing effect of the upper resistance. Moreover, the "V-shaped" rebound trend during the session has further verified the effectiveness of the short-term support range, which is highly consistent with our core prediction logic that Bitcoin is in a "shock adjustment phase, with price movements dominated by key levels".

BTC:Oscillating upward📈The BTC price shows an oscillating upward trend, with the low points gradually rising. However, trading volume has slowed down, indicating a strong wait-and-see sentiment in the market.
📝On the daily chart, after a sharp decline on the 22nd, the rebound momentum on the 23rd was weak, and the market is still in a consolidation phase overall. It is necessary to pay attention to whether it can break through the key moving averages.
💡From the perspective of moving averages, the value of MA10 is greater than that of MA30, indicating a certain upward tendency in the short-term trend.
🎉The intraday support range for BTC is around 105,500–106,000, and the intraday resistance range remains around 111,000–111,500.
💎Trading Strategy:
Buy 107,500 - 108,000
SL 106,500
TP 109,000 - 110,500 - 111,000
Sell 110,000 - 110,500
SL 111,000
TP 109,500 - 108,500 - 107,500
Daily-updated accurate signals are at your disposal. If you run into any problems while trading, these signals serve as a reliable reference—don’t hesitate to use them! I truly hope they bring you significant assistance

BTC: Shows an obvious volatile trendToday, BTC’s situation is relatively complex, with intertwined bullish and bearish factors, showing a volatile trend.
Price Movement: There has been sharp volatility, with rapid rises and falls. From the hourly chart, the price surged to around 114,000 last night, followed by a significant pullback from the highs, retesting the key support level around 107,500.
Influencing Factors:
News: The Federal Reserve held a meeting with payment companies to facilitate better institutional access to the stablecoin sector. This news triggered a short-term surge in Bitcoin prices. However, subsequent remarks by Trump proposing a 155% tariff led to a price decline. The uncertainty in news has had a significant impact on the market.
Market Sentiment: The fear index stands at 25, indicating a tendency toward panic in market sentiment. Additionally, the large traders’ long-short ratio shows a slight dominance of bears at 52.34%, reflecting relatively stronger short-term bearish momentum in the market.
Capital Flow: U.S. Bitcoin ETFs have seen net inflows exceeding $3.6 billion this month, the highest since January. Institutions like BlackRock continue to increase their holdings, forming bottom buying support for prices. However, the total open interest across the network has reached $48 billion, highlighting high leverage risks. A sharp price fluctuation could trigger massive contract liquidations, exacerbating market volatility.
Technical Analysis: On the hourly timeframe, the MACD has re-formed a death cross pointing downward. Although the blue bars have shortened and started to turn red, indicating a partial shift in short-term momentum, bears still hold the overall advantage. The upper resistance level is around $111,000, and the lower support level is around $107,500. A break below this key support could lead to further downside.
Trading Strategy:
Focus on range-bound trading. Avoid taking positions at mid-range levels, exercise caution in chasing trends, and patiently wait for key levels to enter trades.
Buy 107,500 - 108,500
SL 106,500
TP 109,500 - 110,500 - 111,500
Sell 111,000 - 110,500
SL 112,000
TP 109,500 - 108,500 - 107,500
Daily-updated accurate signals are at your disposal. If you run into any problems while trading, these signals serve as a reliable reference—don’t hesitate to use them! I truly hope they bring you significant assistance

BTCUSDT — at Edge of the Trend: Bullish or the Next Bear Trap?Main Narrative
Bitcoin is standing at a critical crossroads. After a deep correction from the 126K peak, the price is now forming a Symmetrical Triangle Pattern — a classic setup that appears when the market holds its breath before a major move.
Pressure from both sides — a descending resistance from sellers above and an ascending support from buyers below — is squeezing the price closer to the apex, the point where a decisive breakout becomes inevitable.
The next movement will decide whether the bulls regain control or the bears reclaim dominance.
---
Pattern & Structure Analysis
This triangle has formed after a strong downtrend, signaling a phase of consolidation and uncertainty.
There was one false breakout to the upside (yellow ×) — a typical liquidity trap where market makers lure buyers before pulling the price back inside the pattern.
Currently, Bitcoin remains trapped between:
Descending resistance (upper yellow line): around 110K–112K
Ascending support (lower yellow line): around 106.7K
This is a pressure zone — the longer the price stays inside, the more explosive the breakout will be once it happens.
---
Key Levels
Main Resistance: 110K – 112K (breakout zone)
Primary Support: 106.7K (bulls’ last stand)
Secondary Support: 103.6K and 102.1K (critical continuation zone)
Bullish Targets: 116K–118K (retest of previous resistance), and up to 126K if momentum expands
Bearish Targets: 103K → 102K → potential breakdown continuation below 100K if selling pressure dominates
---
Bullish Scenario — “Real Breakout or Just Another Trap?”
If the 4H candle closes above 112K with strong volume confirmation:
Buyers regain short-term control.
First target lies around 116K–118K (prior supply zone).
Sustained momentum could lift the price back toward 126K — the previous major high.
However, without volume confirmation, any breakout could turn into a second fake rally, often followed by a sharper decline.
---
Bearish Scenario — “Support Break = Bearish Continuation”
If the price breaks below 106.7K, confirmed by a strong 4H close and rising sell volume:
The breakdown could drive the price toward 103.6K, then 102.1K.
A confirmed close below 102K may trigger panic selling and open a path toward the next psychological zone below 100K.
In this case, the triangle would represent a continuation pattern, not a reversal — signaling further downside.
---
Market Psychology
This chart perfectly reflects a battle of patience between buyers and sellers.
The longer the consolidation lasts, the more energy builds up behind the next move.
Experienced traders know: long consolidations often end with violent breakouts.
---
Strategy & Key Notes
Wait for a confirmed 4H candle close beyond the triangle with strong volume.
Breakouts without volume = traps.
Keep position size small until direction is confirmed.
Enter only after a successful breakout retest to reduce risk exposure.
---
Conclusion
Bitcoin is entering a decisive phase.
A confirmed breakout above 112K could ignite a bullish run toward 116K–126K,
while a breakdown below 106K would confirm that the market is leaning back into a bearish phase.
This isn’t just another triangle — it’s a critical point that will define the medium-term trend for Bitcoin.
---
#Bitcoin #BTCUSDT #CryptoAnalysis #Breakout #TechnicalAnalysis #TrianglePattern #BTC #CryptoTrading #CryptoMarket

BTC:Continuing to pull back📈Looking at the 4-hour candlestick chart, Bitcoin continued to pull back and decline today. The short-term support level remains in the 107,000-107,500 range, which has provided support multiple times during previous downward movements. If the price breaks below this range, it may further drop to around 105,000. The resistance level is in the 112,000-113,000 range; a breakthrough here is expected to open up more upward space.
📝In the long term, after Bitcoin's fourth halving in April 2024, its daily production dropped from 900 to 450 coins, with the inflation rate falling below 1% for the first time. This has further strengthened its scarcity. Combined with the surge in institutional demand, the supply-demand gap is expected to widen, supporting a long-term upward price trend.
💡However, in the short term, the contradiction between continuous institutional inflows and profit-taking by short-term holders may lead to certain price fluctuations.
💎Trading Strategy:
Buy 107,000 - 107,500
SL 106,500
TP 108,000 - 109,000 - 110,000
Sell 111,500 - 111,000
SL 112,000
TP 110,000 - 109,000 - 108,000
Daily-updated accurate signals are at your disposal. If you run into any problems while trading, these signals serve as a reliable reference—don’t hesitate to use them! I truly hope they bring you significant assistance

Correct projection for BTCThe core conclusions of my analysis on Bitcoin today have all been verified by market trends, which can be summarized in three aspects: trend prediction, key level control, and trend logic:
1-Consistency with short-term trends: It was pointed out that "the 4-hour chart continues to pull back, with short-term support in the 107,000-107,500 range". Intraday BTC has continued to fluctuate around this support zone without breaking below the key level, and it was also noted that the resistance level is around 113,000,a breakthrough here is expected to open up more upward space. Today's fluctuations are completely in line with expectations.
2-Support from long-term logic: The long-term upward logic of "strengthened scarcity and expanded institutional demand after the 2024 halving" was reaffirmed. Although short-term fluctuations were affected by profit-taking, it has not deviated from the long-term positive framework.
3-We accurately captured "the restrictive effect of support and resistance levels on prices", with no deviations in judgments on "short-term fluctuation rhythm and long-term trend direction", effectively providing clear range and direction references for trading operations.

BTCUSDT — Decision Zone: Continuation or Major Correction Ahead?Bitcoin’s 2-Day chart (Bitstamp) is now approaching a critical macro zone — the $106,000–$101,000 support block, which acts as the last stronghold for bulls in this current uptrend.
This area represents a confluence of horizontal support and the main ascending trendline that has guided price since late 2024.
If buyers can defend this zone, Bitcoin could still experience one final leg up toward the cycle top.
However, a decisive breakdown below it would confirm the start of a major structural correction.
---
Structure and Pattern
Primary Pattern: Rising Wedge / Ascending Channel
The pattern indicates weakening bullish momentum — each higher high forms with less strength.
Such formations often end with a sharp breakdown once the support line fails.
Key Levels:
Support zone (yellow block): $106K – $101K
→ Confluence of trendline and horizontal support.
Immediate resistance: $116,500
Upper liquidity zone / cycle top target: $126K – $128.5K
---
Bullish Scenario — “The Final Push”
If Bitcoin successfully rebounds from the $106K–$101K zone, it could trigger the last upward wave toward $126K–$128.5K, potentially marking the final phase of this bull cycle.
Bullish Confirmation:
2D candle closes above $110K–$112K
Formation of a reversal pattern (hammer/pin bar) with increasing volume
Momentum indicators (RSI/MACD) start to turn upward
Upside Targets:
Target 1 → $116,500
Target 2 → $126K – $128.5K
Macro Narrative:
A bounce from this zone would likely lead to the final euphoric rally before distribution begins.
---
Bearish Scenario — “Breakdown of the Cycle”
If Bitcoin closes a 2D candle below $101K, the bullish structure will officially break down, confirming the start of a major correction phase.
This would validate the rising wedge pattern and shift momentum entirely to the bears.
Bearish Confirmation:
2D close below $101K
Failed retest around $104K–$106K
Rising selling volume
Downside Targets:
Target 1 → $92,500
Target 2 → $75,500
Macro Narrative:
A breakdown below $101K would mark the end of the bull market and the beginning of the re-accumulation phase below $90K.
---
Conclusion
Bitcoin is standing at its macro decision zone: $106K–$101K.
This range will determine whether we get one final bullish push — or the start of a major correction.
Holding above → potential rally toward $126K–$128K
Losing support → possible drop toward $92K–$75K
The next 2D candle will decide the macro direction of Bitcoin — continuation or collapse.
---
#Bitcoin #BTCUSD #BTCAnalysis #CryptoMarket #TechnicalAnalysis #PriceAction #SupportAndResistance #RisingWedge #BTCUpdate #BitcoinOutlook #CryptoTrend #MarketStructure #BitcoinChart #BTCOutlook

BTC holds firmly above 110,000Today, BTC exhibited a trend of first declining and then rising.
At the opening, Bitcoin once dipped to 107,466, but subsequently, bulls began to gain momentum, driving the price to recover gradually. It successfully broke through the 110,000 mark and continued to rise.
From the perspective of market sentiment, the Fear & Greed Index is in the "Greed" zone, with the current index standing at 70. This indicates that despite short-term price fluctuations, the market remains optimistic about the overall trend. Such sentiment helps sustain the current consolidation and may provide momentum for a subsequent rally.
In terms of capital flows, on-chain data shows that although the overall capital flow is relatively complex, whales have recorded a significant net inflow in the latest cycle. Their inflow volume reached 207 million BTC, far exceeding the outflow volume of 160 million BTC. This strong buying power is the core driving force behind Bitcoin's ability to gain support at high levels and continue its upward trajectory.
Short-term trend forecast:
In the short term, BTC is likely to consolidate around 110,000. Attention should be paid to the resistance level near 112,000–113,000 on the upside and the support level near 107,500-107,000 on the downside. If it can break through the upper resistance, the price may surge toward the 115,000–118,000 range; if it falls below the lower support, it may drop to 105,000 or even lower.
Trading Strategy:
Buy 108000 - 109000
SL 107000
TP 110000 - 111000 - 112000
Sell 112000 - 111000
SL 113000
TP 110000 - 109000 - 108000
Daily-updated accurate signals are at your disposal. If you run into any problems while trading, these signals serve as a reliable reference—don’t hesitate to use them! I truly hope they bring you significant assistance

Correct projection for BTCBTC's movement today is fully consistent with our analysis, fluctuating upward within the range of 107,000 to 112,000. In terms of operation, it is necessary to closely follow this fluctuation range, adopt the "high short, low long" strategy, accurately seize the entry timing, and timely take profits when reaching the target level to ensure gains are locked in.

BTC:Targets set at 109,800 - 111,000 after break above 107,500As we mentioned earlier, if Bitcoin breaks above 107,500 and remains stable, a minor rebound will occur, with targets set at 109,800 and 111,000. Let’s wait and see if it can reach this target range tomorrow.

BTC: Continuing to fluctuate between 106,000 and 107,500Today, BTC continues to trade within a narrow range and has repeatedly encountered resistance at the key level of 107,500. This level can be regarded as the bull-bear divide.
If the price can break above this level and stabilize, a small rebound is expected, with subsequent target levels around 109,800 and 111,000.
On the downside, we will focus on the support level around 106,000. If the price is suppressed from above and falls below this support level, it may continue to decline.
Buy 106000 - 106500
SL 105500
TP 107000- 107500
Sell 107500 - 108000
TP 109000
TP 106500 - 106000
Daily-updated accurate signals are at your disposal. If you run into any problems while trading, these signals serve as a reliable reference—don’t hesitate to use them! I truly hope they bring you significant assistance

#BTCUSDT:Last Drop at 98K Before Hitting 140K?Bitcoin dropped significantly after reaching a record high of 125k. This comes after we announced a 100% tariff on China, creating fear in the global market, especially among crypto investors. We can now see a clear pattern forming, the AB=CD pattern, which is likely what others are also seeing.
Good luck and trade safely!
Team Setupsfx_

BTC: Sharp VolatilityBTC exhibited a trend of rising first and then falling, with overall intense volatility,reflecting the uncertainty and complexity of the market.
From the perspective of short-term technical indicators, after Bitcoin’s price broke below the key range of 109,000–110,000, this area has now transformed into a resistance level. Currently, the price is fluctuating within the 106,000–107,000 range: it faces resistance near 107,500 on the upside, while receiving support from the 103,000–104,000 range on the downside. If the price fails to break through the 107,500 resistance level effectively, it may continue to face downward correction pressure.
Buy 106000 - 106500
SL 105500
TP 107000- 107000
Sell 107500 - 108000
TP 109000
TP 106500 - 106000
Daily-updated accurate signals are at your disposal. If you run into any problems while trading, these signals serve as a reliable reference—don’t hesitate to use them! I truly hope they bring you significant assistance

BTC Performance Recap for the week🎉This week, BTC generally exhibited intense volatility, following a trajectory of "continuing the previous uptrend first, then oscillating downward, and finally rebounding after touching support".
📝Monday: Continuing the Uptrend and Breaking Key Levels
Building on the upward momentum from the previous weekend, Bitcoin’s price smoothly broke through the key psychological level of 115,000 and did not stop there—it continued to climb to around 116,000, setting a stage of interim highs for the week’s trend.
📝Tuesday to Thursday: Oscillating Downward and Losing Key Support
The uptrend failed to sustain. Starting from Tuesday, Bitcoin entered a phase of oscillating decline; its price gradually pulled back and broke below the short-term key support level of 110,000 in the process. Downward pressure continued to release, and the weak sentiment persisted all the way to Friday.
📝Friday: Bottoming Out, Rebounding on Support, and Consolidating in a Narrow Range
On Friday, when the price further dipped to just above 103,000, it received strong support at this level and staged a rebound, easing the previous downward momentum. However, the rebound lacked strength and failed to retake the 110,000 level.
📝As of now, it remains fluctuating in a narrow range between 106,000 and 107,600.
💡It was mainly influenced by a combination of factors including macroeconomic policies, market sentiment, and technical indicators. The details are as follows:
💎Reasons for the Early Rally
1-Impact of Expectations for Fed Interest Rate Cuts
The Federal Reserve (Fed) launched an interest rate cut cycle in September 2025. The market expects two consecutive rate cuts in October and December, and the anticipated decline in both nominal and real interest rates has increased the appeal of Bitcoin as a non-interest-bearing asset. This attracted inflows of some funds, driving up its price.
2-Support from Sovereign Nations’ Strategic Reserves
The Trump administration established the U.S. Strategic Bitcoin Reserve, incorporating Bitcoin into the national economic asset framework—a move that triggered emulation by many countries. The number of listed companies holding Bitcoin globally has increased significantly, with a total of large Bitcoin holdings. This "digital gold" positioning has significantly boosted Bitcoin’s weight in global asset allocation, pushing its price higher.
3-Impact of Historical Cyclical Patterns
Over the past decade, Bitcoin has achieved an average return rate of over 22% in the month of October. In October this year, the balance of the U.S. Treasury General Account is approaching the $850 billion target, and expectations of funds flowing back into the market have also provided support for Bitcoin’s price.
💎Reasons for the Late Decline
1-Panic Triggered by Trade Policies
On October 10, U.S. President Trump threatened to impose a 100% tariff on Chinese goods, sparking market concerns about an escalation of the global trade war. Investors’ risk appetite declined, and funds flowed out of risky assets such as Bitcoin, leading to a price drop.
2-Substitution Effect of Gold
Gold prices have recently climbed to a record high above $4,300, with a cumulative increase of 18% in the past month. Due to gold’s strong momentum and lower volatility, funds have clearly favored gold more. Some investors shifted from Bitcoin to gold, suppressing Bitcoin’s price.
3-Sell-Off Triggered by Technical Breakdown
Bitcoin fell below the 2025 "realized price" level—a key technical indicator that tracks the average withdrawal price of all wallets. Sustained trading below this level triggered further sell-offs by holders seeking to limit losses. Additionally, after Bitcoin broke below the key support level of $111,000, automated trading systems and stop-loss orders were triggered, intensifying selling pressure.
4-Cascading Margin Calls Driven by High Leverage
Bitcoin’s price decline led to nearly 300,000 margin calls in the cryptocurrency market, with a total liquidation value of $1.221 billion. A large number of leveraged long positions accumulated earlier were forced to close out amid the price drop, forming a vicious cycle of "decline → margin call → further decline" and amplifying downward pressure on the price.

BTC: Today's predictions and operations have been verified👏Today, our predictions for BTC have been verified by the market.
✔1-Judgment on Short-Term Market Nature: After Bitcoin experienced a sudden sharp surge at the opening, we accurately judged that "this surge was a short-term fluctuation lacking sustained support". Subsequently, the price fluctuated downward rapidly and fell back to the oscillating range, which fully validated the judgment that "it was not a trend reversal".
✔2-Trend Direction Prediction: We clearly proposed the downward target level of 103,000. After Bitcoin dropped to just above 103,000 and then rebounded, this fully confirmed our judgment.
🎉Today, we have successfully concluded this week’s trading and work. Next week, we will continue to provide you with more accurate market interpretations and operation references from a professional analytical perspective. Finally, we wish you all a relaxing and pleasant weekend in advance!

BTC: The next downside target looking at 103,000The price of BTC continued to decline today. The previous key support level of 109,500 was broken, and the moving average system was also in a bearish arrangement, exerting pressure on the price.
In terms of technical indicators, according to relevant analysis, Bitcoin's MACD indicator showed a bearish signal. Although the RSI indicator was in a neutral area, the price was lower than both the short - term and long - term moving averages, and the trading volume significantly shrank, indicating insufficient market momentum, an unhealthy price - volume relationship, and weak reversal signs. In addition, from the perspective of the 4 - hour K - line, the MACD histogram remained negative but gradually became shorter, indicating that the strength of the bulls was increasing, but the KDJ indicator had no golden cross or death cross, remaining neutral overall.
In terms of market sentiment, the continuous weakness of Bitcoin made the market sentiment more cautious, and the confidence of the bulls was somewhat damaged.
If Bitcoin cannot regain 110,000 in the short term, the price may continue to fall, and the next target may be around 103,000.
Sell 107000 - 106000
SL 108000
TP 105000 - 104000
Daily-updated accurate signals are at your disposal. If you run into any problems while trading, these signals serve as a reliable reference—don’t hesitate to use them! I truly hope they bring you significant assistance
