Elloit wave ETH 12/18/2025My outlook on ETH remains bullish, but it differs from my previous analysis. Initially, I thought the red wave b was an impulsive wave C or wave 1, signaling the start of a new downward trend. However, upon closer examination, the wave structure appears too irregular to be an impulse wave.
After the recent downside pressure passed, ETH’s price action has turned notably bullish. Price first tested a strong resistance level and then formed a triangle pattern, which I interpret as wave b. This wave b retraced nearly 80% of wave a, increasing the probability that wave c could form an expanded flat correction.
If this scenario plays out, the target for wave 2 would be around 3,900–4,000, which also coincides with a strong resistance zone. This target is further supported by a Butterfly harmonic pattern and aligns closely with the 0.618 Fibonacci retracement of the major wave 1.
That said, it is important to note that there is still a possibility that ETH has already completed its correction and may continue to move downward. This scenario should be monitored closely.
Butterfly

State Street Corporation (STT) – Short Setup Technical AnalysisState Street Corporation (STT) – Short Setup Technical Analysis
State Street Corporation is currently trading well outside the 3rd Anchored VWAP band, indicating a pronounced overextension away from fair value and a high probability of mean reversion. Price acceptance at these levels is typically unstable, particularly in the absence of accelerating volume.
This extension coincides with the completion of a bearish Butterfly harmonic pattern, a structure that frequently marks terminal moves and exhaustion within an advance. The Butterfly completion zone defines a technically relevant area where upside continuation becomes increasingly asymmetric.
From a tactical standpoint, the setup favors a short positioning on rejection, rather than trend continuation. Any failure to maintain acceptance above the upper VWAP band would confirm loss of bullish control and increase the likelihood of a rotation back toward the Anchored VWAP and prior value area.
Bias: Short on rejection outside the 3rd VWAP band
Target: Mean reversion toward Anchored VWAP
Invalidation: Sustained acceptance above the Butterfly completion zone
Context: Bearish Butterfly completion + VWAP overextension = high-probability short setup

DXY Butterfly & December NewsIn this video, we focus on forecasting the future trend of the Dollar Index just hours before the release of key economic data, including:
- Core Retail Sales m/m
- Non-Farm Employment Change
- Retail Sales m/m
- Unemployment Rate
Our analysis is based on candlestick formation patterns combined with harmonic patterns.
The ideal Butterfly pattern notably indicates an upward trend in the Dollar Index toward the Order Block Zone.

GOLD SHORT SELL VIEW
Hello Traders, here is the full analysis for this pair,
let me know in the comment section below if you have any questions,
the entry will be taken only if all rules of the strategies will be
satisfied. I suggest you keep this pair on your watch list and see if
the rules of your strategy are satisfied.
Dear Traders,
If you like this idea, do not forget to support it with a like and follow.
PLZ! LIKE COMMAND AND SUBSCRIBE

EURUSD - we got what we wantedFurther to my previous idea on EURUSD - the price has (most likely) respected the Resistance and started to complete the Butterfly Pattern.
So now, hand off the computer and wait. Or perhaps go out for some Black Friday Shopping! We have just earned some $ for it :)
Just my humble opinion

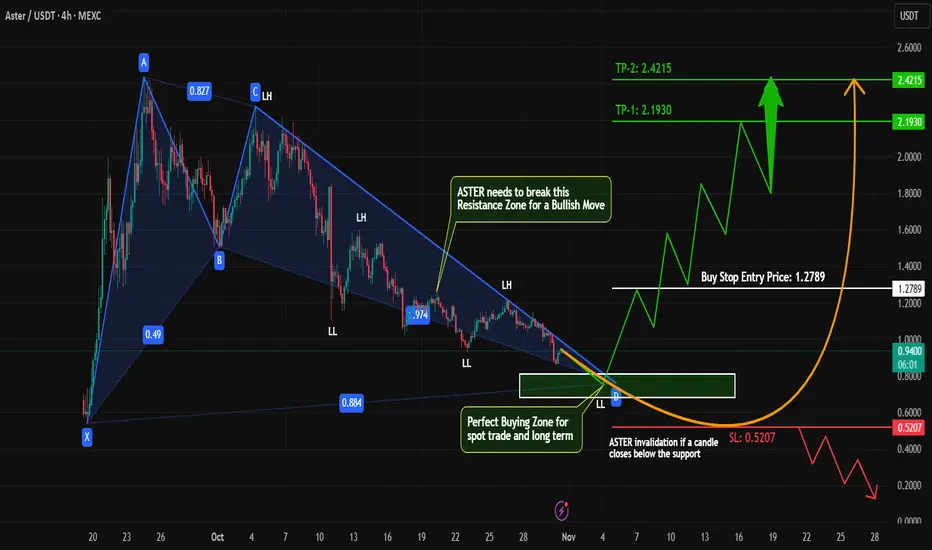
ASTER – Strong Long-Term Investment Setup | Harmonic Pattern#ASTER is one of the strongest and most promising new projects in the market right now. The price action is setting up beautifully for a potential long-term bullish move.
Technical Outlook (4H Timeframe):
#ASTER is currently forming a bullish harmonic pattern, and the final leg of this structure is about to complete soon — around the current market price (CMP) or within the 0.8115 – 0.7000 zone.
Trade Plan:
→ Buy Zone: 0.8115 – 0.7000
→ Enter 50% position in this zone.
→ Remaining 50% after a confirmed break above resistance at 1.2150 – 1.2800.
Alternative Scenario:
If #ASTER doesn’t retrace to the 0.8115–0.7000 zone and instead breaks the 1.2150–1.2800 resistance, we’ll place a buy stop order above that level to catch the breakout move.
Why #ASTER?
Fundamentally strong new project
Technical showing high probability bullish setup
Perfect long-term accumulation levels forming
Always use proper risk management — this is key to long-term success.
What’s your view on #ASTER? Do you think it’ll bounce from the harmonic completion zone or break out early? Drop your thoughts below!
#ASTER #CryptoAnalysis #HarmonicPattern #TradingSetup #LongTermInvestment #Altcoins #CryptoTrading #BullishSetup #TechnicalAnalysis
Btc abcdSo this is like seeing into the future. Impossible you and I will agree. Harmonics should never be traded till they complete, or so they say.
Anyways the chart shows an incomplete AB=CD. A pitchfork.
Just an idea please don't take as gospel.

Corn butterfly Been bullish on corn 🌽 for a good while. This is long term harmonic pattern that made me that way. The bottom which recently occurred was marked by three distinct doji type candles. Really believe commodity supercycle is very close. Oil, corn , metals obviously 🙄.

$103,000 Support is Your Next Long Entry!The chart shows a Bearish Harmonic Pattern (D point completed near $107,000), indicating the recent bullish momentum needs a rest.
We anticipate a short-term pullback following the completion of this pattern.
The target for this drop is the key support area (green box) around $103,000 - $103,500.
OBV also shows Bearish Divergence (price up, indicator down), which strongly supports the idea of a temporary pullback.
Wait for the price to hit the $103,000 support zone.
Look to enter a LONG trade from the $103,000 - $103,500 area for the next major leg up. This is the main opportunity!
Good Luck!

BTC HARMONICSBtc 1M fractal close. 102400 ish.
Two harmonics one up one down.
See how price reacts see which is victorious.
112500 upper target if we go up.

GBPJPY BEARISH SETUPGBP/JPY moving higher within a corrective leg; prime resistance is located at 201.96
The rally was sold in the dip was bought resulting in GBP/JPY closing the day little net changed. We've seen mild upside momentum overnight.
With the single currencies expected to move in the same direction, I would expect continued volatile price action.
From a technical perspective, we are currently at the equilibrium zone. Further upside barriers are seen at 201.93 and 201.96.
Conclusion: there is scope to build a Butterfly formation. This would suggest that intraday rallies are sold. 201.96 is prime resistance.

EURUSD - performing the correctionFurther to my previous idea on EURUSD. The price respected the Buttfly Pattern and started the correction. Nor the price got to the First Resistance, where I expect a correction, then it will continue to the Main Resistance at 1.16300. There I expect the price to return to downtrend and continue to 1.12500.
Just my humble opinion

USDCAD - At ResistanceUSDCAD is just approaching a Resistance Cluster and completing the Butterfly Harmonic Pattern at 1.4146-1.4166. This is in line with the situation on EURUSD, GBPUSD and USDJPY.
I expect the price to perform a correction down to 1.3914 and then revert to uptrend.
Just my humble opinion

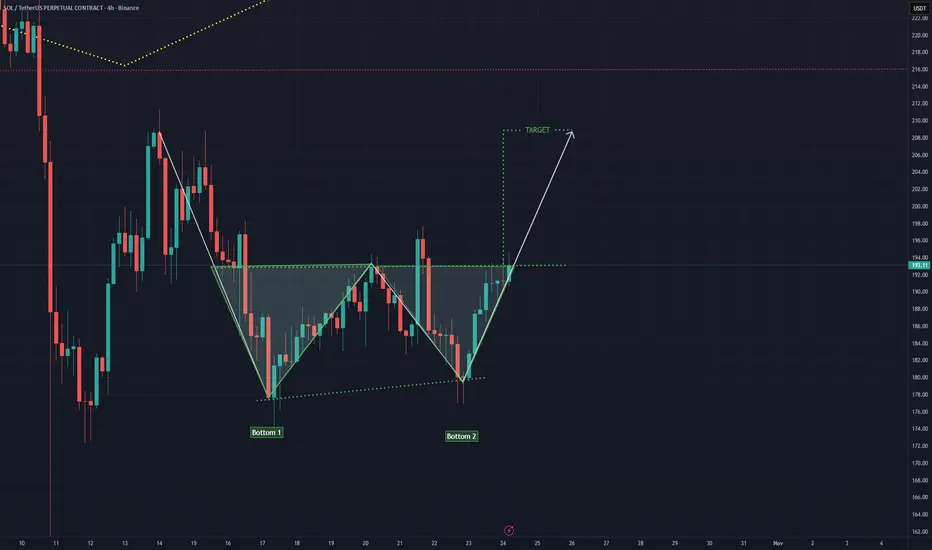
SOL 4H CRYPTOCAP:SOL 4H Chart
Solana forming a clear Double Bottom pattern signaling a potential trend reversal after the recent pullback.
Price is testing the neckline resistance, and a breakout above could confirm bullish continuation toward the projected target zone.
If confirmed, this setup suggests strong bullish momentum building for $SOL.
#SOL #Solana #Crypto #PriceAction #TradingView
DXY MAX BUTTERFLYThe pattern is as title says a max butterfly. The xd ratio should be between 1.272 and 1.618. Risky short taken, maybe some relief on the shitcoins. 97.5 is obvious target.

EURUSD Forecast: Structure Break + Butterfly Pattern OpportunityHey guys, in today’s video I want to start here on the EURUSD and walk you through my 4-step analysis process I call IPDE, which stands for Identify, Predict, Decide, Execute.
We’re going to start by identifying that price recently violated a key level of structure, and from there, make the prediction that we could see price continue lower. Personally, when I’m looking to catch potential extensions, I like to wait for a pullback, and our previous structure level looks like a great area to watch for one.
And for those of you who trade advanced patterns, we’ve also got a nice Butterfly Pattern setting up that could provide an opportunity for longs.
If you have any questions or comments, please leave them below & I wish you a great upcoming week in the markets
Akil

EURUSD - intraday - Butterfly PatternFurther to the previous idea on EUR, what I can see is a completing Butterfly Pattern with D-point at 1.15 (what corresponds with the W1 perspective)
I expect a correction from that point, potentially up to 1.16-1.16250 and then continuation of the downtrend.
Just my humble opinion

Gold Bullish Butterfly Forming – Reversal Ahead?As I expected in the previous idea , Gold started declining from the Resistance zone($4,192 – $4,137) and has now reached the Support zone($4,004 – $3,895) — full target achieved .
At the moment, Gold is moving within that Support zone($4,004 – $3,895) and Potential Reversal Zone(PRZ) .
Looking at the 1-hour time frame , we can spot a Bullish Butterfly Harmonic Pattern forming, which is likely to complete right in that PRZ .
I expect that in the coming hours, once Gold enters the PRZ , it could rise at least up to around $4,057(First Target) .
Second Target: $4,132
Stop Loss(SL): $3,889(Worst)
Please respect each other's ideas and express them politely if you agree or disagree.
Gold Analyze (XAUUSD), 1-hour time frame.
Be sure to follow the updated ideas.
Do not forget to put a Stop loss for your positions (For every position you want to open).
Please follow your strategy; this is just my idea, and I will gladly see your ideas in this post.
Please do not forget the ✅ ' like ' ✅ button 🙏😊 & Share it with your friends; thanks, and Trade safe.

$BTCUSD Harmonic Butterfly Completion at $118K+This harmonic butterfly pattern can take us to $118K+, also reaching the next line on the fork. Shorts will probably pile in at that level together with profit-taking from longs should drive prices down. Not sure how deep it'll be.

EURJPY: Two Potential Advanced Patterns Setting UpWe’ve got a pretty interesting situation developing on the EURJPY, where not just one, but two potential advanced pattern formations setting up simultaneously. Opportunities like this don’t happen often, and they’re a great example of how structure and symmetry can align to give traders multiple reasons to get involved in the market.
Identifying the Dual Pattern Setup
What makes this chart particularly exciting is that the two patterns overlap within the same price zone, creating a powerful confluence area. When multiple patterns or Fibonacci-based setups complete around the same levels, it increases the probability of that zone acting as a significant turning point.
In the video, I’ll walk you through how to measure out each pattern step-by-step, showing you exactly where the completion points line up.
The Takeaway
Whether you’re an advanced pattern trader or simply looking to refine your technical analysis skills, this EURJPY setup is a great example of how disciplined pattern recognition can reveal high-probability opportunities.
I wish you guys a great week of trading!
Akil

GER40 (DAX) Bulls in Control, But Overbought Signals Flash
GER40 (DAX) Bulls in Control, But Overbought Signals Flash Technical Forecast:
Asset: GER40 (DAX Index)
Closing Price: 24,190.7 (as of 11th Oct 2025) USTC+4
Analysis Timeframe: Intraday (1H/4H) & Swing (D/W)
1. High-Level Market Structure & Context
The GER40 maintains a robust bullish trend on higher timeframes, trading well above its key Daily and Weekly Moving Averages. However, the recent ascent has pushed the index into overbought territory on intraday charts, suggesting a potential for a short-term pullback or consolidation before the next leg higher. Geopolitical stability and ECB policy expectations remain key drivers.
2. Multi-Timeframe Technical Breakdown
Primary Trend (Daily/Weekly): Bullish
Elliott Wave: The index appears to be in a powerful Wave 3 impulse wave on the daily chart. A minor Wave 4 pullback is anticipated, which would be a healthy correction and a buying opportunity for the subsequent Wave 5.
Ichimoku Cloud: The price is far above the Daily Cloud (Kumo), confirming the strong bullish trend. The Lagging Span (Chikou Span) is also well above the price action of 26 periods ago.
Moving Averages: The Golden Cross (50 EMA > 200 EMA) is firmly intact on the daily chart, providing dynamic support.
Short-Term Outlook (4H/1H): Caution - Overbought
RSI Divergence: The 4H RSI is showing a clear bearish divergence, forming lower highs while price makes higher highs. This is a strong warning sign of weakening momentum and an impending pullback.
Bollinger Bands: The price is riding the upper band on the 4H chart, a classic sign of an overextended move.
Wyckoff Theory: The market shows signs of a potential upthrust or a bull trap formation near the 24,250 resistance. A failure to hold gains here could lead to a reaction back to the support zone.
3. Key Price Levels & Patterns
Resistance: 24,250 - 24,350 (Recent highs & Upper Bollinger Band)
Immediate Support: 24,000 (Psychological level & recent swing low)
Strong Support: 23,800 (50-period EMA on 4H & Fibonacci 38.2% retracement)
Major Support: 23,500 (200 EMA on Daily & Wave 4 target)
A Bearish Gartley or Bat harmonic pattern is forming, suggesting a potential reversal at the 24,250-24,350 PRZ (Potential Reversal Zone).
4. Actionable Trading Plan
Intraday Strategy (Next 1-2 Days):
Scenario A (Short Setup): Look for a rejection at the 24,250-24,350 resistance zone, confirmed by a bearish candlestick pattern (e.g., Bearish Engulfing, Shooting Star) and a turn down in the RSI.
Sell Entry: 24,260 - 24,320
Stop Loss: 24,450
Take Profit 1: 24,050
Take Profit 2: 23,850
Scenario B (Long Setup): A buy-the-dip opportunity emerges on a pullback to the 23,800 - 23,850 support cluster, with a bullish reversal candlestick and RSI recovering from oversold (<40).
Buy Entry: 23,820 - 23,870
Stop Loss: 23,700
Take Profit 1: 24,100
Take Profit 2: 24,250
Swing Trading Strategy (Next 1-2 Weeks):
Bias: Bullish overall. The primary goal is to enter long on dips.
Ideal Long Entry: A deeper pullback to the 23,500 - 23,600 zone would present a high-probability, low-risk long entry for a swing trade targeting new highs above 24,500.
Invalidation: A daily close below 23,450 would invalidate the immediate bullish Elliott Wave count and suggest a deeper correction is underway.
5. Volume & Momentum Insight
VWAP & Volume: The Anchored VWAP (from a recent low) shows the price is extended above it, supporting the overbought thesis. Volume has been declining on the most recent push higher, indicating a lack of strong conviction—a characteristic of a bull trap.
Conclusion: While the long-term trend for the GER40 is unequivocally bullish, the short-term setup favors a corrective pullback. Intraday traders can scout for short opportunities at resistance, while swing traders should patiently wait for a better risk/reward long entry at lower support levels. Always manage your risk.
Disclaimer: This is technical analysis, not financial advice. Trade at your own risk.

NG. National Grid Long - Enter now or DCA around entry/SL zoneNG. National Grid Long - Enter now or DCA around entry and SL zone
Already in this trade but still a chance to enter on any pullback or slow DCA around entry.
Dividend paying
Long term uptrend so could hold a bit of position rather than full exit.
Bull flagging on old support with breakout
Hidden bullish divergence on MACD and RSI, suggesting continuation up
TP1 based on butterfly harmonic 1.272 target
TP2 based on 1.618 fib extension

ETH HTF Butterfly HarmonicAs we can see, the Elliott Wave count for wave (V) is still incomplete. Combined with the Butterfly harmonic pattern, this suggests a target price in the range of $5,900–$6,400. The invalidation level is if wave (4) overlaps with the top of wave (1).
