BTC/USD: Hammer Candle Meets NvidiaGranted, it could easily be seen as catching a falling knife or position squaring before a key risk event, but the hammer candle that printed on the BTC/USD daily chart has me interested, particularly as it came from a zone where it’s attracted buying in the past. It makes me wonder whether we’ve seen the lows for now, opening the door for countertrend long setups in the near term.
For one, BTC/USD has a decent track record for delivering reliable bullish and bearish reversal signals. The shooting star candle on 6 October kicked the bearish move off, with a bearish engulfing on 11 November coinciding with the resumption of the bear trend following a fleeting bounce. And that’s only the signals we’ve seen recently, with many others proving to be prescient earlier in the year.
Secondly, the dip and reversal from beneath $92,000 is noteworthy given price action seen around the level over the past year. There were constant dips and bounces from beneath it in late 2024 and early 2025, before it eventually flipped to offering resistance after a successful bearish break in February. Now testing the level again from above, you can’t dismiss the signal entirely.
While momentum indicators remain firmly bearish, favouring selling into strength, with RSI (14) now sitting in oversold territory, there’s grounds for countertrend long trades to be considered for those anticipating a short squeeze.
For now, I’m watching the price action around $92,000 as we move towards the key macro event for the week, Nvidia’s earnings report. With a correlation coefficient of 0.87 with Nasdaq 100 futures over the past fortnight, it suggests how traders respond to the earnings update will likely influence how BTC/USD trades.
Should the price hold $92,000, longs could be set above the level with a stop beneath for protection, targeting either former downtrend support located around $96,000 today or former support at $99,060.
On Nvidia’s earnings report, I don’t think anyone can say with certainty as to what will transpire, other than history suggests the chip giant will likely breeze past top-line revenue forecasts with bullish guidance from CEO Jensen Huang. But that’s essentially consensus, meaning the performance of riskier assets in the aftermath may reflect whether it’s good enough to justify the hype. Sure, the recent pullback has lowered the bar somewhat, but the bar remains incredibly high. If it can impress, bitcoin may well bounce.
Good luck!
DS
Candlestick Analysis

Trade idea on btcusdHere’s my trade idea on btcusd after the break of 90k
Apply proper risk management

AUDJPY: Rise Continues 🇦🇺🇯🇵
AUDJPY will likely continue rising after a confirmed
bullish change of character and a formation of a bullish imbalance on a 4h time frame.
Expect a growth at least to 101.8
❤️Please, support my work with like, thank you!❤️
I am part of Trade Nation's Influencer program and receive a monthly fee for using their TradingView charts in my analysis.

$BTC BOTTOM IN - Dragonfly Doji Reversal CandleBOTTOM IS IN
⚠️ Need to reclaim ~$95k within the next couple days to confirm, but I’m confident.
🐉 Printed a Dragonfly Doji Reversal candlestick with a Volume breakout to accompany.
🐉 RSI also sitting at lowest since Liberation Day.
🐉 Death Cross historically marks bottoms.
🐉 This 29% correction lines up perfectly with prior ones before next impulsive move up.

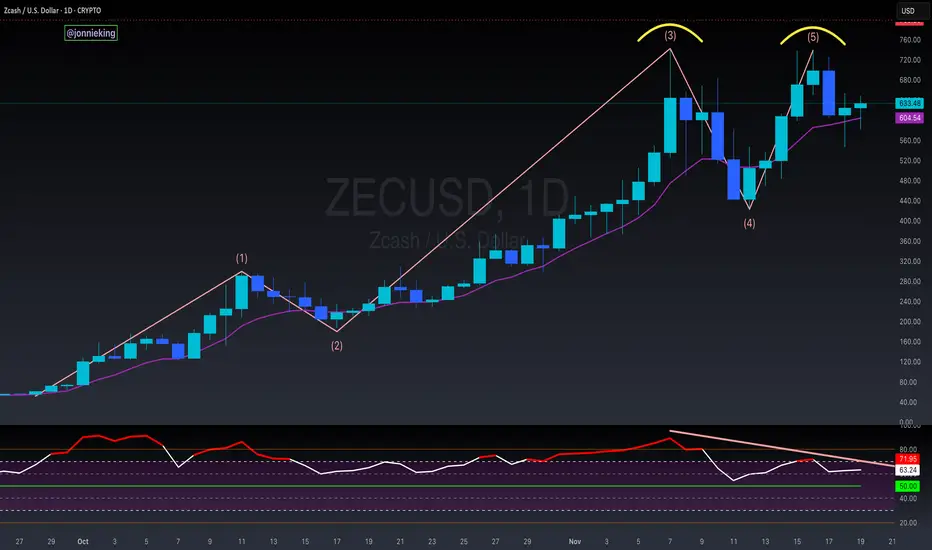
$ZEC 5-Wave Impulsive End of MoveZcash is one of those things that has thrown me off the most these past couple months.
Everything else including CRYPTOCAP:BTC has been nuking, but CRYPTOCAP:ZEC has shown insane strength.
It now appears this dino-coin is nearing the end of its run.
🚩 Double Top formed after impulsive 5-wave move.
🚩 Doji Candle followed by Bearish Engulfing on the Daily
🚩 Exaggerated Bearish Divergence on the RSI
🚩 Euphoria has been diminishing from the TL
⚠️ If it loses the 9EMA, this should confirm the next corrective wave down.
I like the ideology behind Zcash and what it offers to the market, but it has no right to be pumping with ₿itcoin nuking.
NZDUSD LLONG Market structure bullish on HTFs DH
Entry at Daily AOi
Weekly Rejection at AOi
Daily Rejection at AOi
Previous Daily Structure Point
Around Psychological Level 0.56500
Touching EMA H4
H4 Candlestick rejection
Rejection from Previous structure
TP: WHO KNOWS!
Entry 90%
REMEMBER : Trading is a Game Of Probability
: Manage Your Risk
: Be Patient
: Every Moment Is Unique
: Rinse, Wash, Repeat!
: Christ is King.

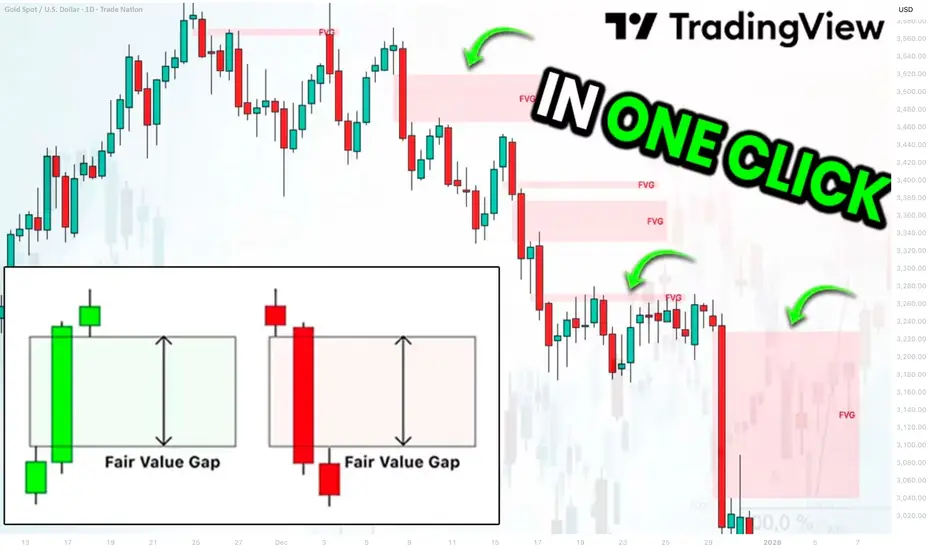
Best Free Fair Value Gap FVG Technical Indicator on TradingView
This free indicator accurately identifies Fair Value Gaps FVG on any market.
It is available on TradingView and it is very easy to set it up.
In this article, I will show you how to use this indicator and how to find a fair value gap easy in one click.
Let's start with my definition of a fair value gap because it is different from trader to trader.
FVG is a sudden, sharp price move that happens so fast that it leaves behind a price zone where very little trading actually occurred.
Because this zone saw almost no trading, it creates an imbalance .
Such a move is usually created by a large candle.
A candle with a big body and almost no wicks.
Among classic Japanese candlesticks, there is one such a candle.
It is called Marubozu.
Here are bullish and bearish structures of that candle.
A green one represents extremely strong bullish momentum. The price opened at the low of the period and closed at the high of the period. There were no pullbacks ; buyers were in complete control from the opening bell to the close.
Its bearish variation has the same logic.
The price opened at the high of the period and closed at the low of the period, with a very little trading activity within.
Our technical indicator will look for such a candle.
The indicator that we will use is called "All Candlestick Patterns".
In the settings of this indicator, we should select Marubozu White (bullish candle) and Marubozu Black (bearish candle).
After we click "OK", the indicator will immediately start working.
The indicator will show valid and significant Fair Value Gaps FVG on any time frame and any trading instrument.
Like any other indicator, it will miss some Fair Value Gaps, but while you are learning to identify them, it will help you to spot the most important ones.
❤️Please, support my work with like, thank you!❤️
I am part of Trade Nation's Influencer program and receive a monthly fee for using their TradingView charts in my analysis.
Long trade
5min Entry (Overview)
📘 Trade Journal Entry
Pair: EURUSD
Direction: Buyside
Date: Tue 18th Nov 25
Time: 13.00 pm
Session: NY PM
Timeframe: 5-Minute
🔹 Trade Details
Entry: 1.15758
Stop Loss: 1.15705 (0.02%)
Take Profit: 1.16079 (0.25%)
RR: 10.1
Trade model :
SSLQ Sweep → Demand Zone Reclaim → FVG Displacement → Bullish Repricing
Reclaim of resistance, (Demand zone)
Immediate FVG left behind
Broke market structure to upside
🔹 Technical Narrative
NY session delivers a sell-side sweep, taking London low + SSLQ level.
Price also enter a discount demand zone and printed a bullish displacement candle.
FVG gaps forming with price mitigating the imbalance that signalled the entry trigger.
Support held and turned into a new bullish structure.
Target set at buy-side liquidity above NY high and upper FVG fill.

TradeWithMky – Catching 10x-100x gems before they moonI called the exact bottom on NYSE:FET at 0.008 – now 0.30+ 😈
Join the ride before the next one prints life-changing money.
Tagged the legends who inspire the plays:
@CryptoCred @CryptoCapo_ @Pentosh1 @TheCryptoDog @CryptoKaleo
@Anbessa100 @RaoulGMI @CryptoWizardd @IncomeSharks @CryptoTony__
@CryptoBusy @Trader_XO @DonAlt @CryptoCobain @CryptoNewton
DM for VIP signals (limited spots)
Not financial advice – we just print money together 💰
#FET #ALTSEASON #100xGEMS

Long trade
15min TF overview
🔹 Trade Details
Entry: 0.56556
Profit Target: 0.56731 (+0.32%)
Stop Loss: 0.56431 (–0.08%)
Risk–Reward (RR): 5.47
📈 Technical Context
Model:
Sell-Side Sweep → Inducement → BOS → FVG Re-entry → Continuation
Key Confluences:
Sweep of London low
Displacement and BOS above intraday structure
Multiple FVGs providing strong entry zone
Trendline acting as dynamic support
NY session volume expansion
Demand block respected
Momentum shift confirmed
🧠 Narrative & Sentiment
Market engineered sell liquidity during London.
NY session confirms bullish flow with displacement.
Traders short from the London leg become trapped → fuel for upside.
Market Structure Overview
Higher-Timeframe Bias (HTF)
The pair is trading inside a corrective downswing but forming higher-timeframe demand reaction just above 0.5630. The large volume spike at the session low signals sell-side exhaustion and potential accumulation for this buyside trade idea.

Trading Block Level (Explained Simply)🔍 What Is the “Block Level”?
In Drummond Geometry, a Block Level is a key support or resistance zone that forms when the market stops trending and enters congestion (sideways movement).
It’s often found about 2–3 PL Dots back from the current price — think of it as the “floor” or “ceiling” that price builds after a trend ends. As shown below, the down trend starting on 3rd of Nov. and lasting till the 07th is broken on the 07th via the CE candle which "creates" the block level (red box with high and low of 2-3 PL Dots back)
If the block level holds, congestion continues.
If it breaks, a new trend begins in that direction.
---------------------------------------------------------------------------------------
💡 Theory – What You Expect
When trading at the block level:
Assume the block is strong unless proven otherwise.
Price usually does more than just a PL Dot refresh — it swings across the PL Dot and back again.
Flow slows down near a strong block area.
If the block is weak , you’ll notice good flow through it — this means congestion is ending and price will break out.
On the image above you can see that the 10th Nov. candle has weak flow (smaller than previous day, Zone 5 is holding, close and open are not far from each other,...), thus this indicateds that the flow slows down in the block area and implies that the block area is strong.
---------------------------------------------------------------------------------------
⚙️ How a Block Level Forms
A block level sets up:
During congestion entrance , after a trend has ended.
Around 2–3 PL Dots back from the current bar.
Within the context of Envelope Theory — the block often appears at or near an envelope border.
The higher time period (HTP) will always guide what’s most likely to happen next.
---------------------------------------------------------------------------------------
📈 How to Trade Block Level
1.Check your higher timeframe (HTP):
If HTP shows strength , trade for congestion action first , then expect a trend run .
If HTP shows weakness , prepare to trade against the block , aiming for a breakout through it .
2.Watch the flow:
Slow, choppy flow = congestion likely holding.
Strong, directional flow = block will likely break.
3.Use nearby energy areas (support/resistance close to price) to confirm entries.
The further out energy areas (stronger, wider zones) act as backup support/resistance.
---------------------------------------------------------------------------------------
🧭 In Simple Terms
Think of the Block Level like a wall:
A strong wall = price bounces → sideways market continues.
A weak wall = price smashes through → a new trend starts.
Your job is to observe which one is happening using the PL Dot behavior, flow, and the higher timeframe structure.
---------------------------------------------------------------------------------------
✅ Quick Recap
Concept Meaning
Block Level The base or cap of congestion, ~2–3 PL Dots back
Strong Block Price stalls or swings within range
Weak Block Price breaks through → new trend
HTP Strength Trade for congestion and trend continuation
HTP Weakness Trade breakout through the block
Goal Align flow + energy fields + PL Dots to confirm strength

AUDJPYContinuous bullish bias on the pair. Due to the liq sweep and the recent push up price might not mitigate my Demand entry. But I'll keep my limit open till invalidation.
Manage risk if interested

GBPAUDThis was my Sell setup on GA but with the recent push down after the liq sweep, price might not mitigate my entry level. This level is still valid until price breaks the low and creates a BOS.
Manage risk

USDCAD: Buying After the Trap 🇺🇸🇨🇦
Quick update for the yesterday's post for USDCAD.
I finally see some strength of the buyers after a test
of the underlined intraday support.
A buying imbalance after a trap suggests a highly probable growth.
Expect a rise at least to 1.4013
❤️Please, support my work with like, thank you!❤️
I am part of Trade Nation's Influencer program and receive a monthly fee for using their TradingView charts in my analysis.

BTC The Final Arc Before Saturn — Long to 126KAfter a full harmonic completion of the 2024 → 2025 expansion leg (53 K → 98 K), Bitcoin has now reached the last major rebalance zone within the macro distribution range.
We’re likely forming the final bullish displacement before the six-year contraction cycle begins in early 2026.
This setup is derived from an ICT structural framework — liquidity, displacement, and re-accumulation — aligned with a larger cyclical model I’ve tracked since 2020.
Technical Thesis:
Timeframe: 1D / 1W
Bias: Long (swing)
Entry Zone: 94 K – 96 K (daily order block at discount)
Stop: 87 K – Below prior swing low
TP1: 116.3 K
TP2: 126.3 K (macro equal-highs liquidity)
Macro Reversal Window: Mid-Feb 2026 (start of the “Great Short”)
Narrative Context:
Each BTC cycle follows a four-fold rhythm: Expansion → Equilibrium → Inflation Peak → Contraction.
The current move represents the final ascent, the last Sol-Jovian surge before Saturn’s compression phase.
If this plays out, BTC will complete its Magnum Opus — a fractal mirror of 2017’s structure, scaled and extended by one harmonic.
From there, the Great Short (2026 – 2032) begins — a multi-year descent where value returns to the patient.
In summary:
I’m long into 126 K — but preparing the foundation for a generational short once that liquidity is taken.

BTC/USDT : Long Into 96.6K RebalanceLiquidity taken below the prior low, displacement confirmed, and price delivered into a clean discount array.
Entry refined at 93.3K, drawing toward the 96.6K imbalance created by the previous sell-side leg.
The move is framed as a simple liquidity → displacement → rebalance delivery.
Stops sit below the internal low (92.8K).
Targeting the full inefficiency fill at 96.6K before reassessing structure.

Gold still in it's year-end range, good scalping opportunitiesThis year's high is in, the same forecast as last year if you watched with me this time last December.
We can expect that the new year candle will target the previous high quickly and swiftly as always, but until then we scalp this year-end wick range using LTF OB/FVGs for minimal pip TPs

AUDCAD ScalpRisky scalp buys targeting Key levels. This is a low probability trade cause am overall bearish on the pair. Please risk a little

EURUSD scalpScalp buys targeting the key level area outlined for a sell. This is a low probability risky trade.

SPX Possibly Breaking SupportPreviously support held on this Higher Low, but it is now creating a bear trend by showing us a Lower High, and now breaking support to possibly create a Lower Low. Wait for a retest on the support which will act as resistance, or on the trendline for a low risk short entry. Feel free to drop your thoughts/opinions!

Nvidia (NVDA) Price Action Statistics Around EarningsWith Nvidia set to release earnings after the US close on Wednesday, I take a look at recent price action around past reports, the Nvidia chart and the Nasdaq.
Matt Simpson, Market Analyst at City Index.

USDCAD: Bullish Bias Remains 🇺🇸🇨🇦
USDCAD will likely grow more,
following a test and a strong pullback from the underlined
daily support cluster.
Expect a rise at least to 1.4089
❤️Please, support my work with like, thank you!❤️
I am part of Trade Nation's Influencer program and receive a monthly fee for using their TradingView charts in my analysis.

BCH needs to break monthly resistanceIn order to get the explosive move we saw with Zcash. BCH needs to break the yellow line on the monthly time frame. Everyone has been focused on breaking the red line which we did in July, but there hasn't been any substantial uptrend. This is because the red line is formed using wicks and the real resistance is the solid candle of the yellow line.
