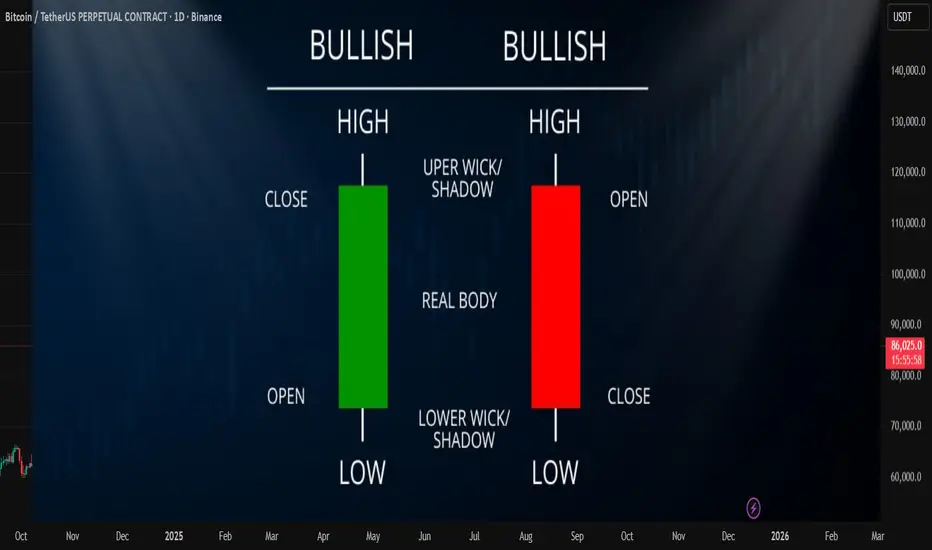
How to Read Candlestick Charts: The Complete Beginner’s Guide 1What is a Japanese Candlestick?
Before you can trade patterns, you must understand the "DNA" of a single candlestick. Unlike a
simple line chart that only shows the closing price, a Japanese candlestick tells you the
complete story of price action over a specific time period using four data points:
1. Open: The opening price.
2. High: The highest price reached during the period.
3. Low: The lowest price reached during the period.
4. Close: The closing price.
How to Read the "Body" and "Wicks"
● Bullish Candle: The Open is BELOW the Close. This means buyers won the session.
● Bearish Candle: The Open is ABOVE the Close. This means sellers won the session.
● The Wicks (Shadows): The thin lines above and below the body represent the extreme
high and low prices, showing price rejection.
The Top 5 Bullish Reversal Patterns
A bullish reversal pattern signifies that buyers are momentarily taking control, usually forming
after a price decline.
1. The Hammer The Hammer is a 1-candle pattern that signifies rejection of lower prices.
● Recognition: Little to no upper shadow. The lower shadow is about 2–3 times the length
of the body.
● Meaning: Sellers pushed price down at the open, but huge buying pressure stepped in
to close the price near the highs.
2. Bullish Engulfing Pattern A 2-candle pattern where buyers completely overwhelm sellers.
● Recognition: The first candle is bearish. The second candle is bullish and its body
completely "covers" (engulfs) the body of the first candle.
● Meaning: Buyers have won the battle emphatically.
3. Piercing Pattern Similar to the Engulfing pattern but slightly weaker.
● Recognition: The second bullish candle closes above the 50% mark (halfway point) of
the previous bearish candle.
4. Tweezer Bottom A 2-candle pattern indicating the market is struggling to trade lower.
● Recognition: The first candle shows rejection of lower prices. The second candle
re-tests that exact low and closes higher.
5. Morning Star A powerful 3-candle reversal pattern.
● Recognition:
1. A long bearish candle.
2. A small-bodied candle (indecision).
3. A strong bullish candle closing more than 50% into the first candle's body.
● Meaning: Sellers are exhausted, and buyers have taken control.
Next lesson will be posted on next week
stay connected
-TuffyCalls (Team Mubite)
Candlestickpattern
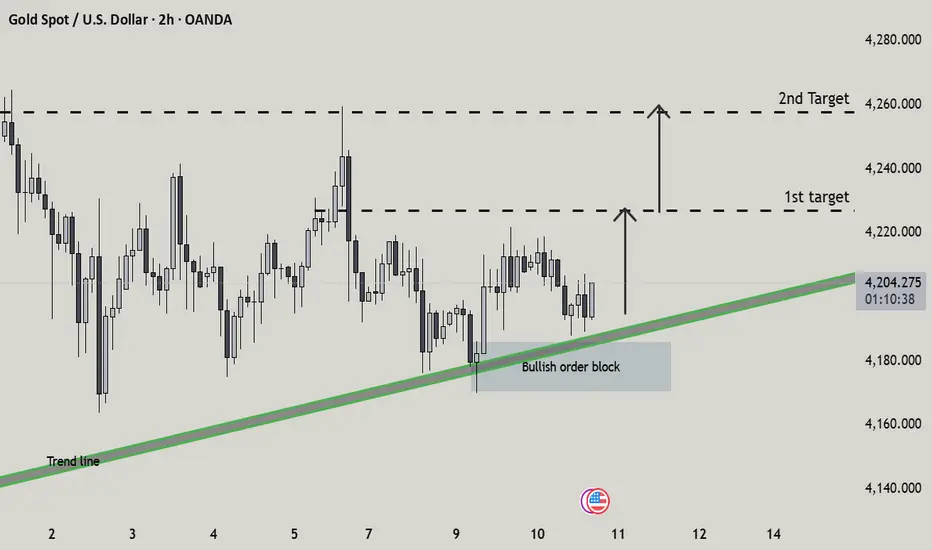
Gold Poised for a Breakout? Trendline Support + OBThis chart shows Gold respecting a strong ascending trendline while also tapping into a clearly defined bullish order block, suggesting a potential upward reaction. Price is hovering near support with projections toward the first target around 4,220 and a second target near 4,260 if momentum continues. The setup highlights a classic confluence of structure, demand, and breakout potential—often a precursor to strong moves in trending markets.
Do you think Gold will break above the first target zone, or will it reject and fall back to the trendline again?
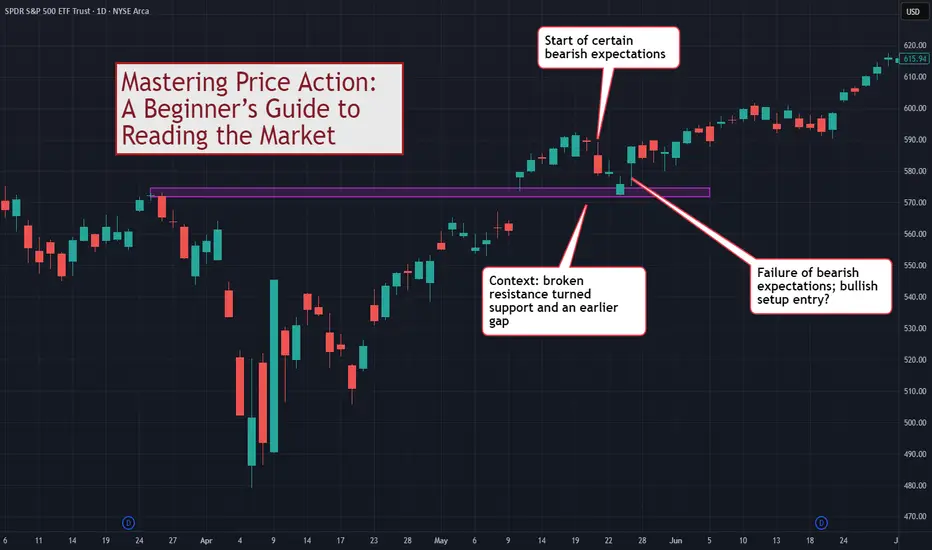
Mastering Price Action: A Beginner’s Guide to Reading the MarketThis discussion goes beyond the basic idea of "memorizing candlestick names." If you want to truly master price action as a tool for reading the market and understanding it as a basis for trading, this guide is for you.
Disclaimer:
The information provided in this tutorial is intended solely for educational purposes. Nothing in this material should be interpreted as financial, investment, or trading advice. Any strategies, methods, tools, or concepts discussed are presented for learning and demonstration only. You are responsible for evaluating your own decisions and risks. Always conduct independent research and consult a qualified professional before making financial or investment choices.
⚠️ WHY MOST TRADERS MISUSE PRICE ACTION
Most traders use price action in a simplistic way:
See a Pin Bar = Buy
See a Doji = Indecision
See an Engulfing = Reversal
The problem with this approach is that you are trading shapes instead of market dynamics.
Price action is not merely pattern recognition. It is a language.
To master price action, you must understand:
Volatility (Range)
Conviction (Body)
Buying/Selling Pressure (Shadows)
Context (Relative performance)
Expectation vs. Reality (Market Inertia)
Price action tells you the story of the battle between buyers and sellers.
📊 1. DECODING THE SINGLE BAR (THE DNA)
Before you can read a chart, you must be able to read a single bar.
Although a single bar is created from Open/High/Low/Close, it gives you critical information beyond that.
🕯️Range = Volatility
The distance between High and Low.
Wide Range: Active market, high volatility.
Narrow Range: Dead market, low volatility.
This chart shows the low volatility period transitioning to the high volatility prior to a major reversal.
🕯️Body = Conviction
Large Body: The market conquered territory. Strong conviction (Bullish or Bearish).
Small/No Body (Doji): The market is undecided. A battle with no winner.
This chart points out two bullish bars, one with weaker conviction than the other.
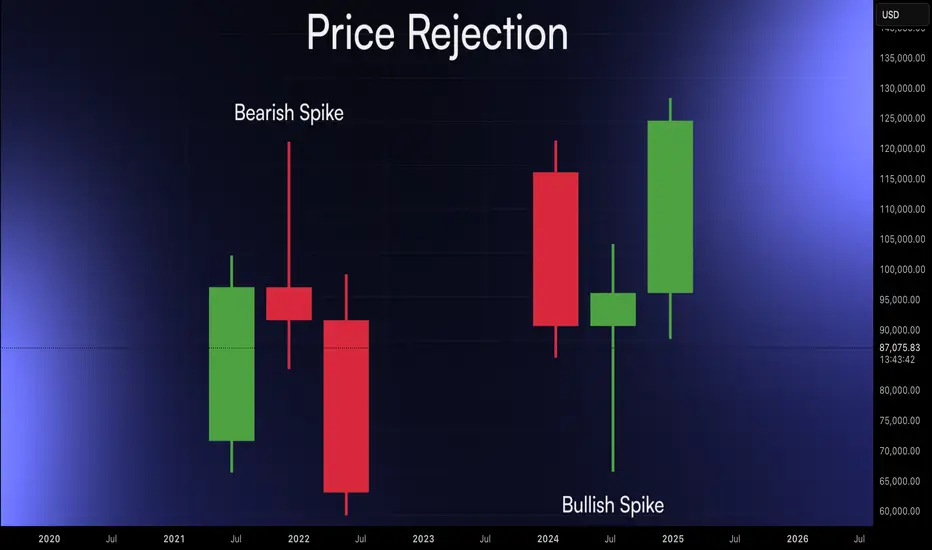
🕯️Shadows = Pressure
Upper Shadow: Selling Pressure. The market tried to go higher but was rejected.
Lower Shadow: Buying Pressure. The market tried to go lower but was rejected.
This chart shows how we can observe the shifting of buying/selling pressure by observing the wicks (tails/shadows) of candlesticks.
TIP: For examining shadows, focus on the shadows (wicks) that take up around at least 50% of the bar range.
📊 2. CONTEXT IS KING (TWO-BAR ANALYSIS)
Now, let’s go on to two-bar analysis.
Nothing works in isolation. A "wide" bar is only wide(r) if its range is larger than the previous bar.
The key here is to use the first bar to set the context for the second.
Volatility Check: Is the range expanding (market waking up) or contracting (market resting)?
The "Test": Every bar's High and Low are natural support and resistance levels.
- If Bar 2 breaks Bar 1's Low and closes lower → Bearish Victory .
- If Bar 2 breaks Bar 1's Low but reverses to close higher → Bullish Rejection (False Break) .
This chart focuses on one specific bar and compares it with the previous bar. Our observation produces no conclusion, only more questions.
📊 3. THE EXPECTATION GAME (THREE-BAR ANALYSIS)
This is the secret sauce of price action readers, forming expectations and observing. The market has inertia , for e.g. bullishness should follow bullishness.
This chart extends our earlier two-bar analysis. The third bar is a Doji, confirming uncertainty on the side of the bulls.
The Basic Analytical Framework For Close Price Action Analysis:
Read Bars 1 & 2: Form an expectation. (e.g., "Strong bearish bars, I expect Bar 3 to go down.")
Watch Bar 3: Does it confirm or fail your expectation?
Confirmation: Market moves as expected (Trend continues).
Failure: Market defies expectation (Potential Reversal).
📊 4. PATTERNS ARE JUST LABELS
Stop looking for "Pin Bars" or "Engulfing patterns" by name. Look for the behavior.
Pin Bar: Essentially a bar where the market tested a support/resistance level and was violently rejected (Long Shadow).
Outside Bar: A bar where volatility expanded and totally overwhelmed the previous session.
When you read the story, you don't need the labels.
📊 EXAMPLE TRADING FRAMEWORK
From the above, we can build a simple trading framework based on identifying context, forming expectations, and trading the failure of expectations . This is not the only framework but one of the many possible.
Bullish Setup
Context: Price tests a support level or previous low.
The Trigger: A bar shows a failure of bearish expectation (e.g., tries to go lower but closes high).
Bearish Setup
Context: Price tests a resistance level or previous high.
The Trigger: A bar shows a failure of bullish expectation (e.g., tries to break out but slams back down).
This chart shows a example leading to a potential long setup.
⚠️ COMMON MISTAKES
Trading in a Vacuum: Taking a "Pin Bar" signal without checking if the market is trending or ranging.
Ignoring the Body: A long shadow means nothing if the body shows the other side still has control.
Fixating on Names: Worrying if it's a "Harami" or an "Inside Bar" instead of asking "Who is winning?"
🎯 CONCLUSION
Reading price action is about knowing what the market has done and what it is doing now . It increases your chances of predicting what it will do .
Forget the fancy names.
Focus on the OHLC relationship.
Trade the failure of expectations.
Master this microscopic view, and then combine it with macroscopic market structure for the ultimate edge.
How do you read price action? Do you use patterns or read the flow? Share your approach below!
Candlestick Patterns That Actually MatterTraders often approach candlestick patterns by memorizing long lists instead of understanding the behaviour behind them. Crypto moves aggressively, hunts liquidity, and punishes textbook interpretations unless they occur at meaningful locations. The goal is not pattern collection. The goal is to recognize the few formations that consistently reveal intention when aligned with structure, liquidity, and context.
Engulfing Candles, Displacement and Control
What it shows: a clear shift where one side fully absorbs the other. This is participation, not random volatility.
When it matters: after impulses, at support or resistance, during liquidity sweeps, or when confirming a trend shift.
Why it’s valuable: engulfing candles often provide the first structural evidence that control has changed hands.
Rejection Wicks, Liquidity Taken, Pressure Reverses
What it shows: price tapped a high or low, triggered stops, and immediately met stronger opposing orders. This is how sweeps appear on a single candle.
When it matters: at equal highs/lows, session extremes, failed breakouts, and major swing points.
Why it’s valuable: wicks expose trapped traders and reveal where true supply or demand sits. They are early indicators of shifting intent.
Inside and Outside Bars, Compression and Expansion
Inside Bar: compression, tighter ranges, and reduced volatility ahead of expansion.
Outside Bar: immediate expansion where one side overwhelms both directions.
When they matter: at key levels before breakouts, during corrective legs, at consolidation boundaries, and after liquidity events.
Why they’re valuable: inside bars show preparation; outside bars show decision.
Treat these signals as behavioural information. Their value increases when combined with higher timeframe structure, liquidity mapping, momentum, volume, and session context.
3rd time lucky? (EUR/JPY)Setup
Bullish trend is overbought - short term bearish
Bearish Shooting star pattern on weekly chart (this is the 3rd one - the previous two didn't work out - 3rd time lucky?)
Bearish Evening star pattern on daily chart
Daily RSI down from very overbought reading
Price well above 20/50 day moving average zone
Commentary
There have been no meaningful corrections since the bullish trend began at 155. A large reversal from above 180 could be the start of one.
Strategy
Sell rebound towards supply zone starting at 182
Sell on break below last week’s low price (179.80)

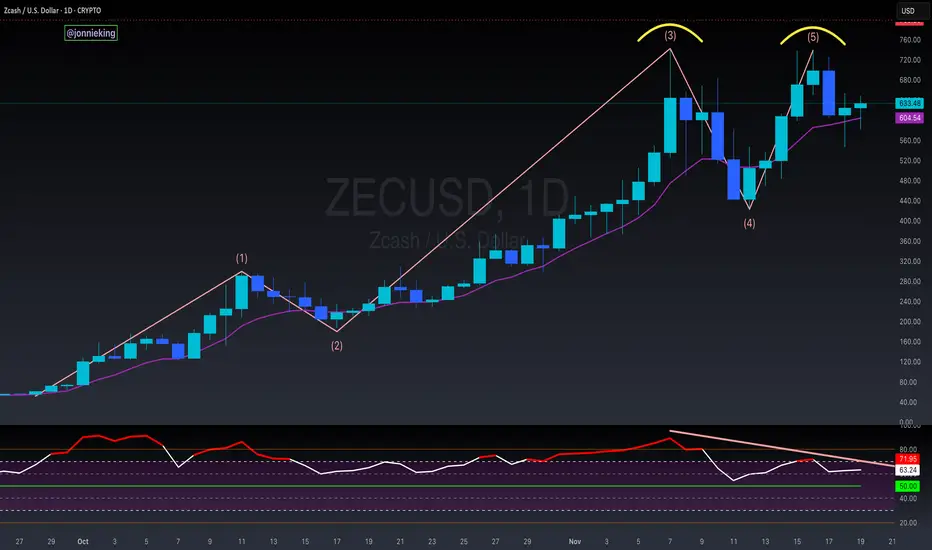
$ZEC 5-Wave Impulsive End of MoveZcash is one of those things that has thrown me off the most these past couple months.
Everything else including CRYPTOCAP:BTC has been nuking, but CRYPTOCAP:ZEC has shown insane strength.
It now appears this dino-coin is nearing the end of its run.
🚩 Double Top formed after impulsive 5-wave move.
🚩 Doji Candle followed by Bearish Engulfing on the Daily
🚩 Exaggerated Bearish Divergence on the RSI
🚩 Euphoria has been diminishing from the TL
⚠️ If it loses the 9EMA, this should confirm the next corrective wave down.
I like the ideology behind Zcash and what it offers to the market, but it has no right to be pumping with ₿itcoin nuking.
Evening Doji Star Sets On USDCHF, Price To FollowOn Wednesday, November 5th, Price on OANDA:USDCHF rose and tested the Resistance Level that's been overhead since August. Today with the decline in price on the Daily, suggests that we are looking at a very strong 3 Candlestick Pattern, the Evening Star Doji!
The Evening Star Doji is a Bearish Reversal Candlestick Pattern consisting of 3 candles: first being a large Bullish candle, second is a Doji candle representing the indecision between Bulls and Bears then followed by the 3rd candle being a large Bearish Candle, meaning Bears have overcome the Bulls.
Now if Price really is to reverse, the following candle after this pattern is formed should be a Bearish one, considering the Confirmation candle will confirm the reversal in price and continue to fall!

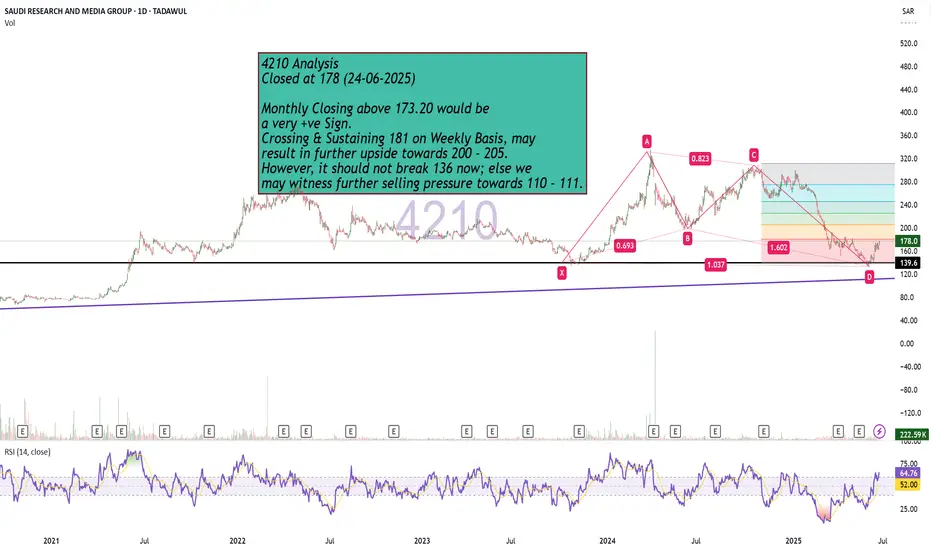
Bullish Monthly Candle Expected?4210 Analysis
Closed at 178 (24-06-2025)
Monthly Closing above 173.20 would be
a very +ve Sign.
Crossing & Sustaining 181 on Weekly Basis, may
result in further upside towards 200 - 205.
However, it should not break 136 now; else we
may witness further selling pressure towards 110 - 111.
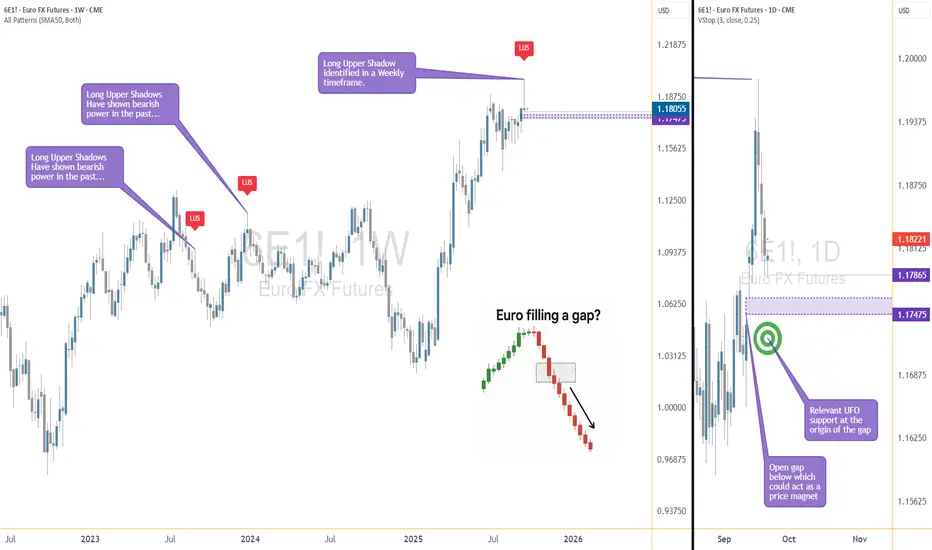
Mind the Gap! The Euro's Waiting GameShadows and Gaps: The Market’s Inside Joke
Euro FX Futures (6E, M6E) are doing that thing again… you know, when the chart leaves a Long Upper Shadow (LUS) on the weekly candle and basically whispers, “Don’t get too comfortable up here, bulls.”
Shadows this long usually mean buyers tried to party at higher levels, but sellers crashed the event and sent everyone home early. And just to make life interesting, the daily chart left an open gap below — like an unfinished side quest in a video game. Gaps are notorious for pulling price back, sooner or later, because the market hates leaving things undone.
The Setup: Simple but Sweet
Here’s how the trade idea shapes up:
Trigger: Wait for a break below 1.17865 (prior low).
Target: 1.17475 — the “gap magnet” zone.
Stop: 1.18090, based on volatility so it isn’t just a random guess.
Reward-to-Risk: Around 2:1. Clean, balanced, and not too shabby.
⚠️ Quick heads-up: right under that gap sits a support zone. Translation? Don’t overstay your welcome. Get in, fill the gap, and don’t go fishing for extra ticks where a bounce might kick you out.
Why This Combo Works
This setup is a little like peanut butter and jelly — two different flavors that just click.
Weekly chart = a big ol’ rejection shadow.
Daily chart = a gap that’s basically screaming, “Fill me!”
Put them together, and you’ve got multi-timeframe confluence — a fancy way of saying “both charts agree.” And when charts agree, traders pay attention.
Big vs. Mini: Futures Contract Fun
6E (Euro FX Futures): Big contract, €125,000. Each tick = $6.25. Great for heavy hitters.
M6E (Micro Euro FX Futures): Mini-me version, 1/10th the size. Each tick = $0.625. Perfect if you’d rather test the waters than dive headfirst.
Micros make scaling in and out a breeze, and honestly, they’re underrated for learning without risking the farm.
The Takeaway
The Euro is caught between rejection above and a magnet below. No downside break yet, but once 1.17865 goes, the path to 1.17475 could be quick.
Moral of the story? Candlestick shadows troll the highs, gaps tempt the lows, and patience is the secret sauce.
Want More Depth?
If you’d like to go deeper into the building blocks of trading, check out our From Mystery to Mastery trilogy, three cornerstone articles that complement this one:
🔗
🔗
🔗
When charting futures, the data provided could be delayed. Traders working with the ticker symbols discussed in this idea may prefer to use CME Group real-time data plan on TradingView: www.tradingview.com - This consideration is particularly important for shorter-term traders, whereas it may be less critical for those focused on longer-term trading strategies.
General Disclaimer:
The trade ideas presented herein are solely for illustrative purposes forming a part of a case study intended to demonstrate key principles in risk management within the context of the specific market scenarios discussed. These ideas are not to be interpreted as investment recommendations or financial advice. They do not endorse or promote any specific trading strategies, financial products, or services. The information provided is based on data believed to be reliable; however, its accuracy or completeness cannot be guaranteed. Trading in financial markets involves risks, including the potential loss of principal. Each individual should conduct their own research and consult with professional financial advisors before making any investment decisions. The author or publisher of this content bears no responsibility for any actions taken based on the information provided or for any resultant financial or other losses.

BTCUSD: Rally Back to 116000 ResistanceHello everyone, here is my breakdown of the current Bitcoin setup.
Market Analysis
The market for Bitcoin has seen a structural shift after breaking down from its prior Upward Channel. This event signaled a loss of bullish momentum and led to a sharp decline down to the major horizontal Support at the 112000 level.
Currently, the price has found significant support in the 111500 - 112000 Support zone and has initiated a bounce. The market is now in a potential reversal phase, but I believe the conviction of the buyers still needs to be confirmed with one final test.
My Scenario & Strategy
My scenario is built on the idea that the 112000 Support is a major area of demand that will ultimately hold. I'm looking for a strong and confirmed bounce from Support zone. This would be the key signal that the corrective low is in place and the market is ready to reverse its course and begin a new rally.
Therefore, the strategy is to watch for this successful retest. It would validate the long scenario, with the price then expected to rally back up to the point of the initial breakdown. The primary target for this move is the 116000 Resistance level, which also aligns with the Resistance Zone.
That's the setup I'm tracking. Thank you for your attention, and always manage your risk.

EURUSD Long: Rally Continues in Ascending ChannelHello, traders! The prior price auction for EURUSD was dominated by a wide consolidation range, bounded by the demand zone 2. Within this range, a new bullish structure began to form as an ascending channel, which eventually gathered enough momentum to break out and confirm a new uptrend, shifting market control to the buyers.
Currently, the price action continues to be guided by this ascending channel. Following a recent test of the upper price levels, the market has entered a corrective phase. The auction is now pulling back towards a significant confluence of support, located near the 1.1740 DEMAND level, which also aligns with the channel's dynamic support line.
My scenario for the development of events is a continuation of the uptrend after this correction completes. I expect the price to find strong support at the confluence of the channel's demand line and the 1.1740 - 1.1760 DEMAND ZONE. In my opinion, a confirmed bounce from this area will signal the end of the pullback and trigger the next impulsive move higher. The take-profit is therefore set at 1.1865, an intermediate target within the channel's structure. Manage your risk!

Gap-Fill Watch: Euro FX Futures React to Weekly RejectionIntroduction
When analyzing futures markets, one of the most compelling signals arises when higher timeframe candlestick rejection aligns with lower timeframe price imbalances. That is exactly what we see in Euro FX Futures (6E, M6E). On the weekly chart, long upper shadows (LUS) have historically marked turning points, reflecting exhaustion of bullish pressure. On the daily chart, an open gap below current price offers a potential magnetic pull. Together, these elements provide a textbook technical case study of how price can align across timeframes.
This article explores the educational insights behind candlestick rejection and gap mechanics, then applies them to a concrete trading scenario in 6E and its micro equivalent, M6E.
Weekly Chart: The Long Upper Shadow (LUS)
Long Upper Shadows appear when a market tests higher levels but fails to sustain them, leaving sellers in control by the close. They are one of the clearest visual expressions of rejection.
In Euro FX Futures, past long upper shadows have preceded significant bearish moves. Each instance reflects an imbalance where buyers were unable to absorb selling pressure at higher prices. The most recent weekly candlestick shows another long upper shadow forming near resistance. For technically minded traders, this is an early warning sign of potential downside ahead.
Daily Chart: The Open Gap Below Price
Price gaps occur when markets open significantly away from the prior session’s close. In futures, gaps often act like magnets—price tends to revisit them over time as liquidity seeks balance.
Currently, Euro FX Futures show an unfilled gap just below the market. Historically, such gaps in 6E have attracted price action, especially when combined with bearish rejection signals from higher timeframes. The combination of a weekly LUS above and a daily gap below paints a picture of imbalance: rejection at the highs, unfinished business at the lows.
Trade Setup
A structured trade idea emerges from this technical alignment:
Entry condition: Short position if 6E breaks below the prior day’s low at 1.17865. This ensures price is moving in line with bearish continuation before entry.
Target: 1.17475, the origin of the open gap. This is where the “magnet effect” is expected to complete.
Stop-loss: 1.18090, derived from a 2-day ATR calculation and adjusted to 25%. This keeps risk tight but accounts for minor noise.
Reward-to-Risk Ratio: With entry near 1.17865, risk is around 22 ticks while potential reward is about 39 ticks, yielding a favorable R:R of almost 2:1.
Risk caveat: Right below the gap origin lies a UFO support area. This means price may stall or reverse after the gap is filled. Being conservative with the target is wise—seeking deeper downside could run into structural support.
Contract Specs and Margin Notes
Understanding the contract structure is vital when applying risk management.
o Euro FX Futures (6E):
Contract size = €125,000
Tick size = 0.00005 USD per euro = $6.25 per tick
Initial margin (approximate, varies daily): ~$2,500–$3,000
o Micro EUR/USD Futures (M6E):
Contract size = €12,500 (1/10th of 6E)
Tick size = 0.0001 USD per euro = $1.25 per tick
Initial margin (approximate, varies daily): ~$300–$400
Application: Traders with smaller accounts can use M6E to size positions more precisely, while larger participants may choose 6E for liquidity. Micros provide flexibility to scale in/out of trades while maintaining strict risk per trade.
Risk Management Essentials
Risk management is not about avoiding losses—it is about ensuring that any loss remains controlled relative to potential reward. This trade idea highlights three core principles:
Stop placement by ATR: Volatility-based stops adjust naturally to current market conditions. Using 25% of a 2-day ATR prevents overexposure while respecting noise.
Position sizing: Traders should calculate how many contracts (6E or M6E) align with their personal risk tolerance.
Target discipline: While tempting to aim lower than the gap origin, technical evidence suggests price may encounter support there. Conservative targeting avoids overstaying a move.
Educational Takeaway
This setup demonstrates the power of multi-timeframe confluence. A weekly rejection signal provides context, while a daily gap gives tactical direction. Traders often gain an edge when higher timeframe sentiment (bearish rejection) aligns with lower timeframe imbalances (gap fill).
For students of price action, this is a reminder that candlestick patterns should never be taken in isolation. Instead, they should be validated by market structure, liquidity imbalances, or other confirming signals.
Conclusion
Euro FX Futures present a case study in how weekly rejection and daily gaps can combine to create a structured opportunity. While no outcome is certain, the confluence of signals here underscores the educational value of analyzing shadows and gaps together.
Traders can study this setup not only as a potential trade but also as a lesson in disciplined multi-timeframe analysis.
When charting futures, the data provided could be delayed. Traders working with the ticker symbols discussed in this idea may prefer to use CME Group real-time data plan on TradingView: www.tradingview.com - This consideration is particularly important for shorter-term traders, whereas it may be less critical for those focused on longer-term trading strategies.
General Disclaimer:
The trade ideas presented herein are solely for illustrative purposes forming a part of a case study intended to demonstrate key principles in risk management within the context of the specific market scenarios discussed. These ideas are not to be interpreted as investment recommendations or financial advice. They do not endorse or promote any specific trading strategies, financial products, or services. The information provided is based on data believed to be reliable; however, its accuracy or completeness cannot be guaranteed. Trading in financial markets involves risks, including the potential loss of principal. Each individual should conduct their own research and consult with professional financial advisors before making any investment decisions. The author or publisher of this content bears no responsibility for any actions taken based on the information provided or for any resultant financial or other losses.
XAUUSD: Bounce from 3615 Support LevelHello everyone, here is my breakdown of the current Gold setup.
Market Analysis
From a broader perspective, after a strong run-up within a prior Upward Channel, the price action for Gold has transitioned into a horizontal consolidation Range. This shift from a trending to a ranging market indicates a period of balance as buyers and sellers digest the previous impulsive move.
Currently, the price is in a corrective phase within this Range. After recently failing to break above the Resistance Zone, sellers have pushed the price down, and it is now approaching the major horizontal support at the bottom of the consolidation, near the Support 1 level.
My Scenario & Strategy
I think that this Range structure will continue to hold for now. The lower boundary, which aligns with Support 1 at 3615, is a significant area of historical support. This Support zone represents a high-probability area for buyers to step in and defend, just as they have in the past.
My scenario is that Gold will complete its drop to the lower part of the consolidation, testing the Support 1 level. Therefore, I expect that a successful defense of this support will lead to a rally back across the Range. My target for this move is 3700, which is placed within the major Resistance Zone at the top of the consolidation.
That's the setup I'm tracking. Thank you for your attention, and always manage your risk.

EURUSD: Correction will ContinuesHello everyone, here is my breakdown of the current Euro setup.
Market Analysis
From a broader perspective, we saw a significant bullish impulse on EURUSD after the price broke out of a multi-week upward wedge. This breakout carried the price well above the Support 1 level at 1.1780, culminating in a new local All-Time High before entering a corrective phase.
Following that peak, the market has pulled back and is now consolidating. Currently, it appears that the price is attempting to build support for another move higher, likely to re-challenge the recent highs.
My Scenario & Strategy
My scenario is a bearish one, built on the expectation of a failed retest of the recent ATH. I'm looking for the price to make one more push upwards towards the recent ATH. The key signal for this short idea would be a clear and strong rejection from that high, showing that buyers no longer have the strength to continue the trend.
Therefore, the strategy is to watch for this failure at the highs. A confirmed reversal would validate the short scenario. The primary target for the subsequent decline is the 1.1795 support zone, which aligns with the Support zone 1 area.
That's the setup I'm tracking. Thank you for your attention, and always manage your risk.

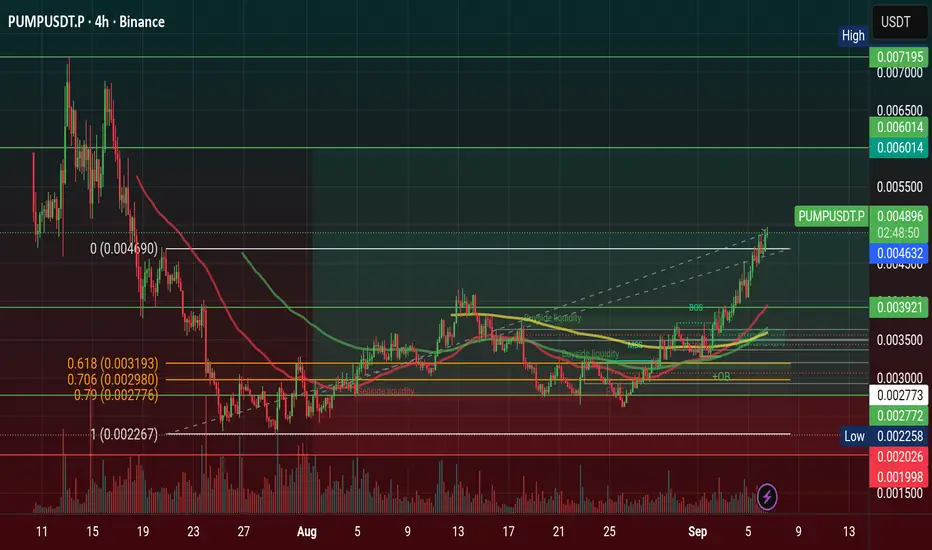
$PUMP Parabolic Starting & if Break ATH price hit $0.011 in 2026🚀 NYSE:PUMP Parabolic Starting & if Break ATH price hit $0.011 in 2026
IN 2026 PUMP will be happened break ATH and my Prediction $0.006 price area will be breaks after Price will stay accumulation in previous ATH areas. In 2026 price could hit $0.011 and 0.008 areas.
Pump.fun Executes $62M Token Buyback as Class-Action Lawsuit Looms
The platform generated more than $775 million in revenue since launch, according to DefiLlama, though income briefly slumped in late July, when weekly revenue fell to $1.72 million- its lowest lev el since March 2024. At its peak in May, weekly revenue topped $56 million, coinciding with a surge of Solana memecoins that briefly pushed SOL itself above $200, its highest level since late 2021.
Market Impact and User Growth
The buybacks appear to be lifting sentiment. PUMP has gained 12% in the past month and 9% in the past week, trading at $0.003522 — up 54% from an August low of $0.002282. The number of unique PUMP holders has climbed to more than 70,800, with smaller accounts holding under 10,000 tokens now making up nearly half of distribution, pointing to stronger retail participation. Blockchain explorer Solscan shows wallet activity on Pump.fun has nearly doubled since May, with daily active users averaging 48,000 compared with 25,000 earlier in the year.
#Write2Earn #PUMP #TrumpTariffs #highlight #SUBROOFFICIAL
Disclaimer: This article is for informational purposes only and does not constitute financial advice. Always conduct your own research before making any investment decisions. Digital asset prices are subject to high market risk and price volatility. The value of your investment may go down or up, and you may not get back the amount invested. You are solely responsible for your investment decisions and Binance is not available for any losses you may incur. Past performance is not a reliable predictor of future performance.
How to Trade Morning Star and Evening Star Candlestick Patterns Learn to identify and trade Morning Star and Evening Star candlestick formations using TradingView’s charting tools in this detailed tutorial from Optimus Futures.
Morning and Evening Stars are powerful reversal patterns that often mark turning points in the market. Recognizing them can help you anticipate when momentum is about to shift—and take advantage of new trading opportunities.
What You’ll Learn:
• How Morning Stars signal bullish reversals at the end of a downtrend
• How Evening Stars indicate bearish reversals after extended uptrends
• The three-candle structure of each pattern and what it means for trader psychology
• Why indecision candles (like dojis) play a critical role in confirming momentum shifts
• Using volume confirmation to validate Morning and Evening Star setups
• The importance of context: spotting these patterns at major support and resistance levels
• Setting effective stop losses at the high/low of the pattern for risk control
• Advanced entry tactic: waiting for retracement after confirmation to optimize risk/reward
This tutorial may help futures traders and technical analysts who want to harness candlestick reversal signals to identify potential market turning points.
The strategies covered could assist you in creating structured setups when strong buying or selling pressure appears at key chart levels.
Learn more about futures trading with TradingView:
optimusfutures.com
Disclaimer:
There is a substantial risk of loss in futures trading. Past performance is not indicative of future results. Please trade only with risk capital. We are not responsible for any third-party links, comments, or content shared on TradingView. Any opinions, links, or messages posted by users on TradingView do not represent our views or recommendations. Please exercise your own judgment and due diligence when engaging with any external content or user commentary.
This video represents the opinion of Optimus Futures and is intended for educational purposes only. Chart interpretations are presented solely to illustrate objective technical concepts and should not be viewed as predictive of future market behavior. In our opinion, charts are analytical tools—not forecasting instruments. Market conditions are constantly evolving, and all trading decisions should be made independently, with careful consideration of individual risk tolerance and financial objective

ETHUSD
📈 Conditional Trade Setup – ETHUSD (Long)
🔹 Bias: Bullish (Trendline Break)
🔹 Signal: Bullish divergence spotted ✅
🔹 Condition: Wait for 📦 Rectangle Breakout
🔹 Confirmation: A strong bullish candle must close above the Lower High
📊 Trade Plan (on chart):
🟢 Entry (EP): Marked on chart
🔴 Stop Loss (SL): Marked on chart
🎯 Take Profit (TP): Levels highlighted
⚠️ Patience: Only execute once breakout candle confirms above LH.

CRWV recap... high volume movethat earnings drop was absolutely amazing. I know it's not amazing to shareholders, but the volume move was swift and hit targets.
That buy today looks like a pop incoming at least. But do play with caution as the company sold off for a reason. The company is new & volatile so play the swings. Let's see if we can get 105-110 next week if catastrophe stays at bay over the weekend.
The kicker candlestick pattern is a great reversal pattern. Google it and check to see if trading view has more education and examples.
A Kicker Candlestick pattern consists of 2 candles to reverse the current trend. There must be space between the candles. continuation is below the kicking candle.
Enjoy

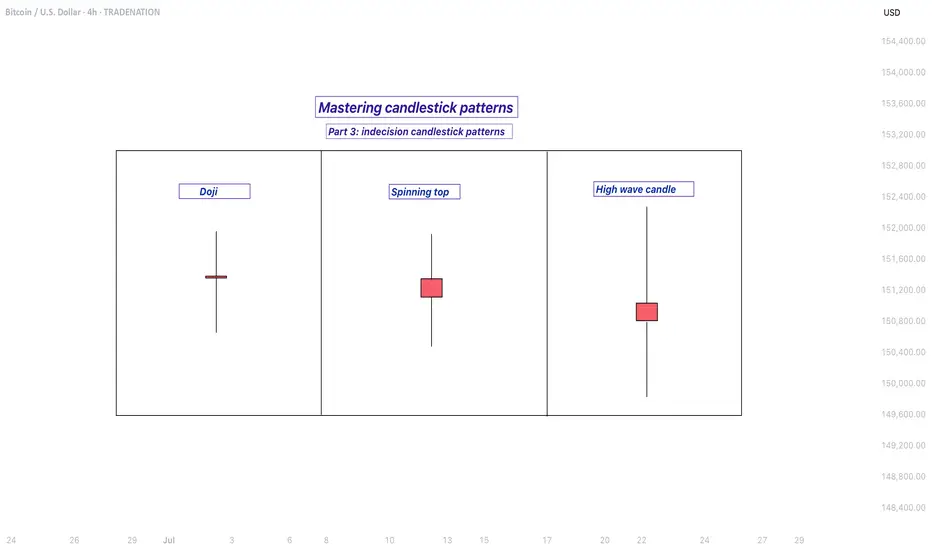
Mastering indecision candlestick patterns - How to use it!In this guide I will explain the indecision candlestick patterns. The next subjects will be discussed:
- What are indecision candlestick patterns?
- What is the doji?
- What is the spinning top?
- What is the high wave candle?
What are indecision candlestick patterns?
Indecision candlestick patterns are formations on a price chart that suggest uncertainty in the market. They appear when neither buyers nor sellers have full control, meaning the price moves up and down during the trading period but closes near where it opened. This creates a candle with a small real body and often long wicks on either side, showing that the market explored both higher and lower prices but ended up not committing strongly in either direction. These patterns are often seen during periods when traders are waiting for more information before making bigger moves.
What is the doji?
One of the most well-known indecision candles is the doji. A doji forms when the opening price and the closing price are almost identical, resulting in a very thin body. The wicks, which show the highest and lowest prices of the period, can be long or short depending on market activity. A doji tells us that buying and selling pressure were almost equal, which can happen during pauses in trends or before major reversals.
What is the spinning top?
Another type is the spinning top. A spinning top also has a small body, but unlike the doji, the open and close are not exactly the same. The wicks on both sides are typically of similar length, indicating that the market moved both up and down significantly before settling close to the starting point. This pattern reflects hesitation and a balanced struggle between bulls and bears.
What is the high wave candle?
The high wave candle is a more dramatic version of indecision. It has a small real body like the other patterns but features very long upper and lower shadows. This means the market swung widely in both directions during the period, but ultimately closed without making strong progress either way. The high wave candle signals strong volatility paired with uncertainty, which can often precede sharp moves once the market chooses a direction.
When you see these types of candles, they are essentially the market saying “I’m not sure yet.” They often appear at turning points or before big news events and can warn that the current trend may be losing strength. However, they are not guarantees of reversal or continuation on their own. Traders usually combine them with other technical signals or chart patterns to confirm whether the market will break out in one direction or the other.
-------------------------
Disclosure: I am part of Trade Nation's Influencer program and receive a monthly fee for using their TradingView charts in my analysis.
Thanks for your support. If you enjoyed this analysis, make sure to follow me so you don't miss the next one. And if you found it helpful, feel free to drop a like 👍 and leave a comment 💬, I’d love to hear your thoughts!
What Is the Evening Star Candlestick Pattern?What Is the Evening Star Candlestick Pattern?
Candlestick patterns offer traders a way to read price action and spot potential changes in momentum. One notable pattern is the evening star, a three-candle formation that signals the start of a possible downtrend. This article breaks down what the evening star looks like, how it works, and how traders typically use it.
What Is the Evening Star Candlestick Pattern?
The evening star is a three-candle pattern that traders watch for after a strong upward move. It’s considered a bearish reversal pattern, signalling that bullish momentum is fading. The setup consists of three candles:
- The first candle is a large bullish candle—it shows a clear upward direction.
- The second is much smaller. This middle candle—the star—reflects hesitation. Buyers and sellers are more balanced, and the market’s pace slows.
- The third candle acts as confirmation. It’s a solid bearish candle that closes deep into the body of the first.
The middle candle also often gaps up from the first, especially in stocks or indices, but gaps aren’t essential. What matters is the sequence: strength, indecision, reversal. The further the final candle closes into the body of the first, the stronger the pattern is considered.
Evening stars can appear on any timeframe, but many traders look for them on the daily chart where the signals tend to be clearer. It’s not a pattern to act on blindly—but in the right context, such as after a sustained bullish trend, it’s a useful sign that buyers might be losing control.
The Psychology Behind the Evening Star
It may be always useful to frame the formations like the evening star candle pattern in the context of market psychology.
Here, the first bullish candle signals buyer confidence. They drive prices higher and the candle closes strongly. The next candle is smaller, suggesting that momentum is slowing. Buyers aren’t pushing as hard, and sellers start to step in.
When the third candle closes strongly bearish, it confirms that sentiment is changing. Sellers are now in control, and previous buying strength fades. This shift often happens at the end of an extended upward movement, where fewer buyers are willing to bid the price up and begin closing positions.
How Traders May Use the Evening Star Candlestick Formation
The evening star may be a useful part of a trader’s toolkit, especially when it lines up with other pieces of analysis.
Opening and Closing a Trade
The evening star pattern candlesticks become more meaningful when they appear around known areas of resistance or previous swing highs. If the market’s been edging closer to a clear level—like a horizontal resistance line, Fibonacci retracement, or trendline—and then an evening star forms, it can add weight to the idea that the rally is weakening. Some traders also watch for patterns forming near round numbers or psychological price points.
If traders notice an evening star pattern occurring at a resistance level, they typically look for confluence using another indicator. The RSI might signal a bearish divergence, the price may be piercing an upper Bollinger Band, or it could also be bouncing from a 200-period EMA. Volume can be another factor—rising volume on the third candle can signal more participation behind the selling.
Once a trader has confidence that a bearish reversal is likely underway, they often use the candles following the third candlestick as an entry trigger. A stop loss might be set above the middle candle’s high, while take-profit targets might be placed at an area where a bullish reversal might occur, like a support level. Some might simply trail a stop to take advantage of the strong downtrend or exit when an indicator/candlestick pattern signals that bearish momentum is fading.
Marking Potential Trend Shifts
Some traders use the evening star to flag potential trend exhaustion. While they may not act on the signal (e.g. they are bullish overall and not willing to take shorts yet), the presence of an evening star can suggest the uptrend is vulnerable. They may prepare to buy a pullback, partially close an existing long position, or start watching for further bearish signals.
Example Trades
In the example above, we see a slight rally in AUD/USD in a broader downtrend (off-screen). Price initially pierces the upper Bollinger Band, with slight rejections visible in the upper wicks. After a brief dip, the market retests highs and finds resistance. At this point, the pattern forms, with confirmation coming from relatively weak candles afterwards. Price then closes through the midline of the Bollinger Bands, providing full confirmation of a bearish reversal.
In this second example, we can see a failed evening star. Here, Amazon (AMZN) gaps up over two consecutive days. That leads the 50-period EMA to slope up and cross above its 200-period counterpart—a clear bullish signal.
In this context, it may be better to ignore the signal. The market continues to move higher in an uptrend with consecutive bullish gaps, confirmed by the EMA crossover, indicating a lower probability the pattern will work successfully. Like any pattern, the evening star is expected to be more reliable when contextual factors align, such as in the AUD/USD example.
Strengths and Limitations of the Evening Star
The evening star has its strengths and limitations. To rely on the evening star in trading, it’s worth being aware of both sides.
Strengths
- Clear visual structure: The three-candle formation is straightforward, especially on higher timeframes.
- Logical: The pattern reflects an evident change in momentum that shifts from buying to selling pressure.
- Useful in a wider toolkit: When combined with other forms of analysis (resistance levels, overbought signals, strong volume), it can help traders pinpoint potential turning points and offer an entry.
Limitations
- Requires confirmation: On its own, the pattern doesn’t confirm a downtrend. It’s a potential signal, but not a guarantee.
- Less reliable in choppy markets: In sideways or low-volume markets, evening stars usually produce false signals.
- Subject to interpretation: Candle size, wicks, and placement can vary, which means not every setup is clean or tradable.
The Bottom Line
The evening star pattern offers traders a structured way to identify potential turning points in the market. Its three-candle formation makes it popular among those seeking greater confirmation than single-candle patterns.
FAQ
What Does an Evening Star Candle Pattern Mean?
It’s a three-candle formation that appears at the end of a solid uptrend. An evening star in trading indicates a potential bearish reversal or a short-term downward movement depending on market conditions and the timeframe used.
Is the Evening Star Bullish or Bearish?
The evening star is considered a bearish pattern that shows buyer exhaustion. A third long bearish candle reflects a change in the market sentiment.
How Do an Evening Star and a Hanging Man Differ?
The evening star is a three-candle pattern showing a gradual change in momentum. The hanging man is a single-candle pattern, with a small body and long lower wick. Both are bearish reversal signals, but the hanging man typically requires greater confirmation.
How Do a Shooting Star and an Evening Star Differ?
The shooting star is a one-candle pattern with a long upper wick and a small body that signals rejection at higher prices. The evening star is a three-candle pattern. Both formations reflect a shift from bullish to bearish sentiment.
This article represents the opinion of the Companies operating under the FXOpen brand only. It is not to be construed as an offer, solicitation, or recommendation with respect to products and services provided by the Companies operating under the FXOpen brand, nor is it to be considered financial advice.
USDJPYUSDJPY Is moving in range
Sell/Short from Resistance Buy/long from Support
This plans on playable befroe CPI data tomorrow / Untill Support Or resistance breaks, trade it between Support & Resistance
Manage risk as per your capital
support resistance
Candle stick cofirmation

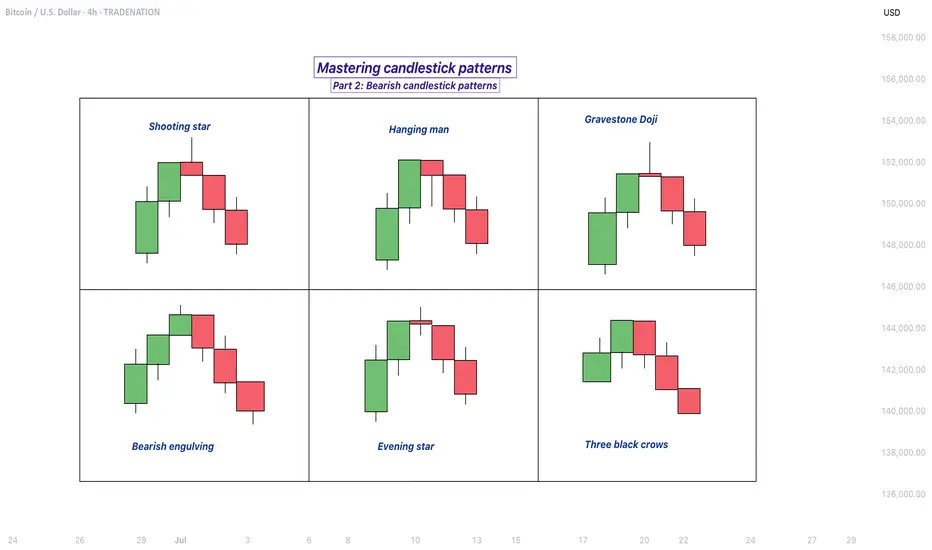
Mastering bearish candlestick patterns - How to use it!Bearish candlestick patterns are a cornerstone of technical analysis, relied upon by traders across financial markets to assess the likelihood of price reversals or continued downward trends. At their core, these patterns are visual representations of shifts in market sentiment, formed by the open, high, low, and close prices over one or several trading sessions. When recognized accurately and interpreted in context, bearish candlestick setups can alert market participants to the fading strength of buyers and the increasing presence of sellers, which often precedes downward price movements. Expanding on this, a comprehensive understanding of each pattern’s nuances, psychological underpinnings, and optimal trading applications can significantly enhance a trader’s analytical toolkit.
What will be discussed?
- What is a shooting star?
- What is a hanging man?
- What is a gravestone dojo?
- What is an evening star?
- What are the three black crows?
- How to trade the bearish candlestick patterns?
Shooting star
The shooting star pattern stands as a prominent candlestick configuration foreshadowing potential bearish reversals after an uptrend. This single-candle pattern is distinguished by a small real body situated near the lower end of the price range, a long upper shadow that is at least twice the length of the body, and little to no lower shadow. The psychological narrative implied by the shooting star is compelling: buyers initially control the session, pushing prices sharply higher, but by the close, sellers have overwhelmed this optimism, pulling the price back down to near or below the opening point. This abrupt shift in control suggests that the bullish momentum is waning, priming the market for a price correction or reversal.
Hanging man
The hanging man, while visually similar to the hammer pattern of bullish reversals, is distinctly bearish because of its position at the top of an established uptrend. This single-candle pattern features a small body at the upper part of the trading range and a markedly long lower shadow, again with minimal or absent upper shadow. During the session, substantial selling pressure drives prices down, accounting for the extended lower shadow, yet buyers temporarily regain some control, recovering much of the loss by the close. Despite this late-session recovery, the appearance of the hanging man warns traders that sellers are growing more aggressive – especially if the next candle confirms the weakness with a lower close.
Gravestone doji
A classic and somewhat ominous formation, the gravestone doji is a specialized form of doji candlestick that carries even greater weight when it appears after a rising market. Here, the open, close, and low are all clustered near the session’s low, forming a long upper shadow with no lower shadow. This structure vividly illustrates a dramatic shift in sentiment: buyers propel prices higher during the session, only to be met by intense selling which pushes prices back to the opening level by the close. This failed rally, marked by the upper wick, reflects the exhaustion of buying interest and the potential onset of bearish dominance.
Bearish engulfing
Turning to multi-candle setups, the bearish engulfing pattern is a powerful, two-bar reversal pattern. The initial candle is bullish and typically a continuation of the prevailing uptrend, but the second candle is bearish and must open above and close below the body of the first candle, “engulfing” it completely. The transition from a relatively small upward move to a much larger downward move highlights a rapid escalation in sell-side enthusiasm. Importantly, the larger the second candle and the greater the volume accompanying it, the more reliable the signal.
Evening star
The evening star expands the analysis further into a three-candlestick formation, representing a storyline of shifting market dynamics. The pattern commences with a long bullish candle, followed by an indecisive small candle (the star) that gaps above the previous close, and concludes with a large bearish candle that closes deep into the first candle’s body. The evening star is especially meaningful because it narrates a transition from bullish exhaustion to bearish control over three sessions, making it a robust signal of a pending trend reversal. The reliability of the evening star increases if the bearish candle is accompanied by high volume, confirming a surge in selling pressure.
Three black crows
Among the most striking bearish signals is the three black crows pattern. It comprises three consecutive large bearish candles, each opening within the body of the previous candle and closing successively lower. This pattern demonstrates relentless selling over several sessions, erasing prior gains and indicating that bearish sentiment is in full swing. Collectively, the three black crows can shift market psychology significantly when they appear after a lengthy uptrend, especially if accompanied by increased trading volume.
How to trade the bearish candlestick patterns?
Effectively using bearish candlestick patterns in a trading strategy requires more than mere recognition of shapes. The context in which these patterns emerge matters greatly; traders should analyze preceding price action, the scope of the trend, and any converging signals from other technical tools such as momentum oscillators or volume indicators. Confirmation is a best practice, waiting for a subsequent session that continues in the bearish direction can filter out false signals and decrease the chances of whipsaw trades.
In practice, traders may use these patterns to identify short-selling opportunities, define entry and exit points, or adjust stop-loss levels to protect profits as a trend appears to reverse. Risk management is crucial, as no pattern is infallible. Position sizing, stop-loss placement, and ongoing evaluation of the broader market environment all contribute to the prudent use of candlestick analysis. By integrating these patterns into a comprehensive market analysis framework, traders are better positioned to interpret crowd psychology, anticipate significant reversals, and navigate the complexities of price movement with a higher degree of confidence and skill.
-------------------------
Disclosure: I am part of Trade Nation's Influencer program and receive a monthly fee for using their TradingView charts in my analysis.
Thanks for your support. If you enjoyed this analysis, make sure to follow me so you don't miss the next one. And if you found it helpful, feel free to drop a like 👍 and leave a comment 💬, I’d love to hear your thoughts!