Candlestick Patterns - How to read them like a ProOverview
Candlestick charts serve as a cornerstone in technical analysis, presenting price activity in a visually digestible format. By examining how prices move over a given timeframe, traders gain key insights into potential market direction, sentiment shifts, and trend strength.
Mastering candlestick interpretation is essential for identifying bullish or bearish sentiment, as well as for spotting possible trend reversals or continuations. Still, candlesticks alone don’t paint the full picture—using them without broader context increases the risk of false signals.
---
What You'll Learn
What are candlestick charts?
Common bearish candlestick patterns
Common bullish candlestick patterns
How to apply candlestick analysis in trading
---
What is a Candlestick Chart?
A candlestick provides a snapshot of an asset’s price behavior during a specific time interval, whether it's one minute, one hour, or one day. This format allows traders to quickly assess how the price has moved within that period.
Each candle reveals four price points:
* Open – the price at the beginning of the interval
* Close – the price at the end of the interval
* High – the highest price reached
* Low – the lowest price during that time
Anatomy of a Candlestick:
* Body: The thick section between the open and close. A green (or white) body means the close was higher than the open (bullish), while red (or black) means the opposite (bearish).
* Wicks (or Shadows): Thin lines extending from the body to indicate the high and low.
* Upper wick: Marks the highest traded price
* Lower wick: Marks the lowest traded price
---
Bearish Candlestick Patterns
Understanding bearish candlestick patterns helps traders identify moments when buying momentum might be running out—setting the stage for a potential downward shift.
Evening Star
A three-candle formation that signals a shift from buying pressure to selling dominance. It starts with a strong bullish candle, followed by a small-bodied candle of indecision, and concludes with a large bearish candle that cuts deep into the first. This pattern often appears at the end of an uptrend.
Bearish Engulfing
This setup includes a small bullish candle followed by a large bearish candle that completely swallows the previous one. It indicates that sellers have seized control, potentially marking the beginning of a downward trend.
Shooting Star
With a small real body near the low and a long upper wick, this pattern reflects strong early buying that is ultimately rejected by the close—suggesting fading bullish momentum.
Gravestone Doji
This candle opens, closes, and hits its low all around the same price, leaving a long upper wick. It suggests that bulls pushed higher during the session but were overpowered by bears by the close.
Three Crows
Three consecutive bearish candles, all approximately the same size. These indicate that a sell off is coming soon.
---
Bullish Candlestick Patterns
Bullish patterns can alert traders to possible reversals after a downtrend or strengthen conviction during an uptrend.
Morning Star
This three-candle formation marks a potential turning point from bearish to bullish. It begins with a strong bearish candle, followed by a smaller candle showing indecision, and ends with a large bullish candle breaking upward—signaling buying strength is returning.
Bullish Engulfing
This two-candle pattern begins with a bearish candle, then a larger bullish candle that completely envelops the previous body. It reflects a sharp transition in sentiment, suggesting renewed buying pressure.
Dragonfly Doji
A single candle where the open, close, and high are all very close, with a long lower wick. It shows sellers pushed prices lower but buyers stepped in and brought them back up—an early sign of possible reversal.
Hammer
A classic bullish reversal signal that features a small real body near the top and a long lower shadow. It indicates a battle where sellers initially dominated, but buyers managed to close near the open price.
Three soldiers
Three consecutive bullish candles, all approximately the same size. These indicate that a big buy is coming soon.
---
Trading with Candlestick Patterns
Candlestick patterns become more meaningful when they align with major chart areas—such as previous support or resistance, trendlines, or retracement zones. A bullish signal at a support level can hint that the downward pressure is fading, while a bearish pattern at resistance may warn of an upcoming decline.
To increase the reliability of your trades, combine candlestick patterns with other forms of technical analysis:
* Support & Resistance Zones: These are price levels where the market has historically reacted. Candlestick patterns forming near these zones have stronger potential implications.
* Fibonacci Levels : These help identify likely retracement areas. When a candlestick pattern forms near a key Fibonacci level like 61.8%, it adds strength to a potential reversal setup.
* Liquidity Areas: Clusters of orders (buy or sell) tend to create strong reactions. When patterns appear in these zones, they often precede more decisive moves.
* Technical Indicators : RSI, MACD, Moving Averages, and Stochastic RSI can provide confirmation. For instance, a bullish reversal pattern that appears when RSI is oversold strengthens the signal.
💡 Tip: Don’t rush into trades based on one candlestick alone. Always wait for the next candle or price confirmation (e.g., a break of a previous high/low) to validate your signal.
---
Thanks for Reading!
✨ If you found this helpful, show some love by liking or commenting!
🔔 Don’t forget to follow for more technical breakdowns and trading insights coming soon!
Candlestickpattern

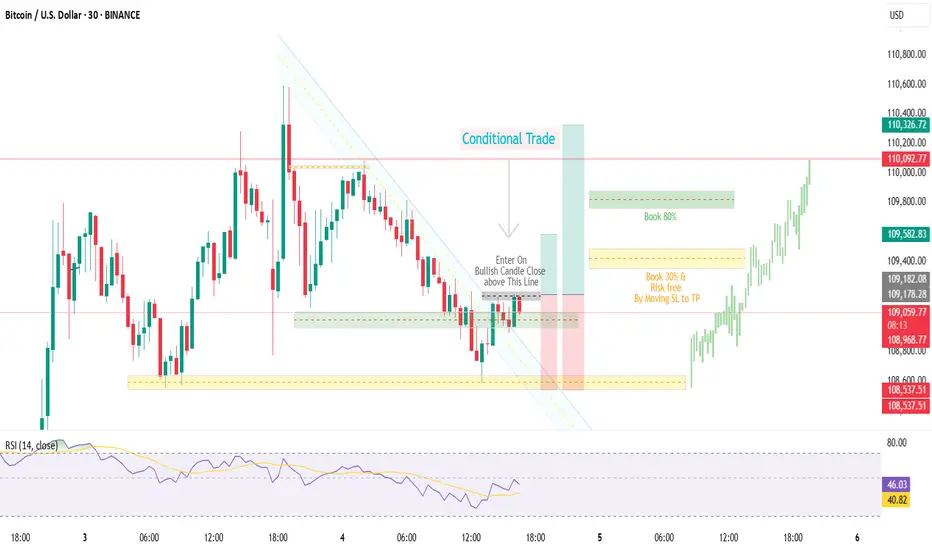
BTCUSDBTCUSD | Quiet Market Play – Conditional | Trade Based On Bearish Candle Closure
After a sharp upward move, price is now losing momentum and consolidating.
Currently entering a short position after breaking the resistance
Trade includes full risk management, marked on chart. 🔴📉

BTCUSD BTCUSD | Quiet Market Play Conditional | Trade Based On Candle Closure
After a sharp impulsive move, price is now in consolidation.
Currently entering a long position after support And trenline confirmation
Trade includes full risk management, marked on chart.🟢📈
EURUSD📉 EURUSD – 30min Short Plan
📊 Structure: LLs & LHs forming – bearish trend confirmed
🕯️ Pattern: Bearish Engulfing at Lower High
🎯 Entry: instant
📌 Trade 1
– 🎯 TP1: 1:1
– ⚠️ Risk: 1%
📌 Trade 2
– 🎯 TP2: larger reward
🛠️ Execution:
– Place both trades at same entry
– Trail SL after TP1 hit
📎 Bias: Bearish

EURUSDEURUSD
30m Time Frame Bullish setup, Candle Stick Pattern
Move SL To Entry once reach first target.

Buy IOC short term target 155, 165 & Medium Term tgt 185, 250 Indian Oil Corporation does business in the entire hydrocarbon value chain - from Refining, Pipeline transportation and marketing of Petroleum products to R&D, Exploration & production, marketing of natural gas and petrochemicals. It has the leadership position in the Oil refining & petroleum marketing sector of India.
The company aims to strengthen EV mobility infrastructure by setting up charging points and battery-swapping facilities at its fuel stations. It has also signed a binding term sheet with Panasonic Group to form a JV for manufacturing cells in India.
The company’s R&D is focused on emerging fields such as nanotechnology, Solar, Bioenergy, Hydrogen, etc. It has an effective patent portfolio of 1636. It spent Rs 946 Cr in FY24 on R&D.
The company’s R&D is focused on emerging fields such as nanotechnology, Solar, Bioenergy, Hydrogen, etc. It has an effective patent portfolio of 1636. It spent Rs 946 Cr in FY24 on R&D.
Market Cap ₹ 2,07,370 Cr.
Annual Sales - ₹ 758,106 Cr
Dividend Yield - 8.20 %
Stock P/E - 17.0
Industry PE - 29.2
Debt to equity - 0.82
ROCE - 7.37 %
EPS - ₹ 9.63
Fundamentally, this big company is trading at a very low valuation. The Crude Oil price is expected this year to be on lowest, so we can expect good profit margin and this company is into green energy business so it should have PE multiple of that business as well. We Expect growth in EPS by 30% to 12.5 And re-rating of PE multiple to 20 so that give the share price to ₹ 250 which gives return of 70.88% from current price level of 146.30.
Technically, this is very bullish on weekly, daily timeframe. Price is trading above all short term, medium term averages. It has formed a bullish candlestick pattern on daily and weekly chart, so we expect immediate strong upside to 155, 165 and eventually 185 level and investment target of 250 levels.

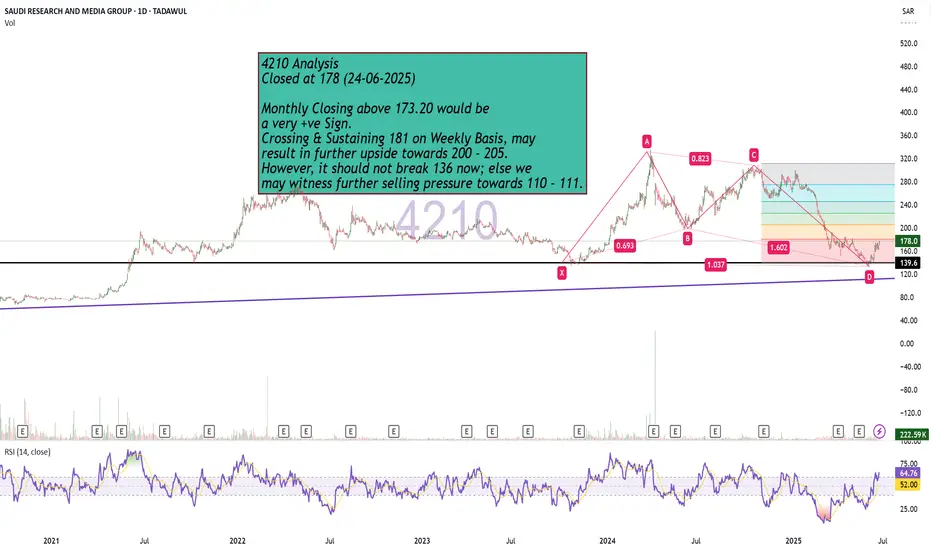
Bullish Monthly Candle Expected?4210 Analysis
Closed at 178 (24-06-2025)
Monthly Closing above 173.20 would be
a very +ve Sign.
Crossing & Sustaining 181 on Weekly Basis, may
result in further upside towards 200 - 205.
However, it should not break 136 now; else we
may witness further selling pressure towards 110 - 111.
$XAU Showing Bearish Flag Pattearn & Dropped $3K Support area...TVC:XAU Showing Bearish Flag Pattearn & Dropped $3K Support area. Price dropping now and back to $3K price level area. price FVG touch and Strong support $3K Price Level area. Here is many support Holder.
Stoploss: $3,536
Entry: $3,377
1st Target point $3,377
2nd Target point $3,249
3rd Target point $3,028
Disclaimer: This article is for informational purposes only and does not constitute financial advice. Always conduct your own research before making any investment decisions. Digital asset prices are subject to high market risk and price volatility. The value of your investment may go down or up, and you may not get back the amount invested. You are solely responsible for your investment decisions and Binance is not available for any losses you may incur. Past performance is not a reliable predictor of future performance. You should only invest in products you are familiar with and where you understand the risks. You should carefully consider your investment experience, financial situation, investment objectives and risk tolerance and consult an independent financial adviser prior to making any investment.

3 Line Strike Pattern: What It Means and How to Use It3 Line Strike Pattern: What It Means and How to Use It in Trading
Candlestick patterns are crucial tools for traders, offering valuable insights into market sentiment and potential price movements. Among these patterns, the Three Line Strike setup is particularly sought after by traders in forex, stock, commodity, and index markets. This article explores the intricacies of the Three Line Strike, explaining how to identify it on charts, highlighting its unique characteristics, and discussing how to incorporate it into trading strategies.
Three Line Strike Pattern: An Overview
The Three Line Strike is a candlestick pattern used in technical analysis to trade trend continuations. However, it often appears ahead of trend reversals. The pattern consists of four candlesticks and can be found in up- and downtrends.
Bearish Three Line Strike
The bearish 3 Line Strike candlestick pattern suggests a continuation of a downtrend. It starts with three consecutive bearish candles, each opening and closing lower than the previous one. This is followed by a large bullish candle, which opens lower and closes above the open price of the first bearish candle. This pattern reflects the strength of the downtrend. Still, it may appear at the bottom of the downtrend and signal a trend reversal.
Bullish Three Line Strike
The bullish 3 Line Strike candlestick pattern suggests the potential continuation of a solid uptrend. It starts with three consecutive bullish candles, each opening and closing higher than the last. This is followed by a large bearish candle, which opens higher and closes below the close of the first bullish candle. This pattern indicates that the solid uptrend may continue, but it may signal the market will turn down if it’s formed at the peak of the uptrend.
Analysing Three Line Strike Patterns
As the Three Line Strike pattern can provide both reversal and continuation signals, it’s vital to combine it with other analytical tools, including trend indicators like moving averages and oscillators like the Relative Strength Index. Also, traders consider the overall trend on higher timeframes.
- Entry: To enter a trade using the Three Line Strike, traders identify the overall trend. They may wait for the pattern to be formed and the following candle to close. If the following candle is bearish, traders usually open a sell position. If it is bullish, they consider an opportunity to go long. However, traders also may enter the market at the closure of the pattern’s fourth candle.
- Stop Loss: Risk management is crucial, and traders typically set their stop-loss levels above/below the fourth candle, considering the trend strength. Alternatively, they may place the stop-loss order below or above the nearest swing point or support/resistance level, considering market volatility and risk tolerance.
- Take Profit: Traders aim to secure their potential profits by setting profit targets based on the risk/reward ratio. This could be at the next significant support or resistance level or based on technical indicators, including Fibonacci retracements.
A trader finds a bullish 3 Line Strike setup on the daily chart of Qualcomm stock. However, this time, it serves as a reversal signal. They enter the short position at the close of the candle, following the pattern. Their stop loss is above the setup, with the take profit at the next support level.
A bearish Three Line Strike setup is formed on the hourly chart of Brent Crude Oil. A trader takes a long position at the close of the fourth candlestick. Their stop loss is below the formation, with the take profit placed at the next resistance level.
Psychology Behind the Three Line Strike Pattern
The effectiveness of the Three Line Strike pattern relies on understanding the underlying psychological factors influencing market participants. Greed, fear, hope, and anxiety drive buying and selling decisions.
- Initial Sentiment: The first few candlesticks in a Three Line Strike candlestick pattern represent the prevailing sentiment in the market. Typically, this sentiment is characterised by either greed (in an upward trend) or fear (in a downward trend), depending on the market direction prior to forming the pattern.
- Potential Reversal: Although this pattern is considered continuation, in most cases, it provides a reversal signal. A strong fourth candle that engulfs three smaller candlesticks reflects the change in the market sentiment. The reversal signal triggers market participants to reassess existing positions and strategies.
- Reaction: Those who were previously aligned with the old trend may feel fear or anxiety, leading them to unwind their positions to avoid potential losses. Meanwhile, contrarian traders, driven by a sense of opportunity and confidence, may enter new positions in anticipation of the emerging trend reversal, fueled by their belief that market sentiment is shifting.
Application in Trading Strategies
Applying the 3 Line strike pattern in trading strategies encompasses various elements beyond just its recognition. Let's delve into how traders implement additional steps to enhance their overall trading performance.
- Seeking Additional Confirmation: Traders often seek additional confirmation from other technical indicators such as the Relative Strength Index (RSI), Moving Average Convergence Divergence (MACD), or Bollinger Bands. These indicators offer complementary insights into market dynamics, validating the signals generated by the Three Line Strike pattern.
- Strategic Placement and Timeframe Alignment: Traders may align the pattern with key support or resistance levels on higher timeframes to validate its significance and potential reversal points. Through multi-timeframe trading, traders may gain a more comprehensive understanding of market trends to analyse future price movements.
- Entry and Risk Management: Traders should place their entry and exit points carefully. As the pattern may provide continuation and reversal signals, incorporating disciplined risk management techniques might help traders protect their capital and minimise their potential losses.
Caveats to the Pattern
High volatility periods can amplify the occurrence of false signals and erratic price movements, potentially leading to misguided trades. Conversely, during periods of low volatility, price action may be sluggish, and confirmations could be delayed. Therefore, it's important for traders to adapt their strategies accordingly.
Another important consideration is the possibility of false breakouts. Despite the apparent formation of a Three Line Strike pattern, there's a risk of the price briefly breaching the pattern's boundaries before reverting to its original direction. These false breakouts can deceive traders into entering premature trades, resulting in losses. To mitigate this risk, traders can exercise patience and vigilance, waiting for strong confirmation signals before committing to a trade.
Key Differences Between Three Line Strike and The Three Black Crows/Three White Soldiers
The key differences between the Three Line Strike pattern and the Three Black Crows/Three White Soldiers patterns lie in their trading formations and implications:
Aspect - Three Line Strike Pattern
Formation - Consists of four consecutive candlesticks, with the fourth candlestick completely engulfing the previous three.
Implication - Indicates either a trend continuation or a reversal in market sentiment, either from bullish to bearish or vice versa.
Aspect - Three Black Crows/Three White Soldiers
Formation - Consists of three consecutive candlesticks with progressively lower (crows) or higher (soldiers) closing prices.
Implication - Reflects a strong momentum in the direction of the prevailing trend, suggesting a continuation of the trend rather than a reversal.
The Bottom Line
The Three Line Strike is a complicated pattern as it may provide continuation and reversal signals. Despite its complexity, it often appears on a price chart, making it a valuable tool for traders. Mastering price action chart analysis is a gradual process. However, with skill, traders can potentially improve their trading efficiency.
FAQs
What Is the 3 Strike Rule in Trading?
The 3 strike rule in trading refers to the Three Line Strike pattern. The pattern consists of three consecutive up/down candles followed by a fourth long bearish/bullish candle that opens above/below the previous candle’s close but closes below/above the first candle's open. It’s believed to provide continuation signals, but it often appears before a trend reversal.
What Is the Three Strike Strategy?
The Three Strike Strategy refers to the 3 Line Strike candlestick pattern. It’s based on the assumption that the pattern will be followed by either a reversal or a continuation of the trend. Traders often wait for the candlestick to close above/below the pattern for an entry point, place a profit target, considering the closest resistance/support levels, and potentially limit losses by placing a stop-loss order below/above the pattern.
This article represents the opinion of the Companies operating under the FXOpen brand only. It is not to be construed as an offer, solicitation, or recommendation with respect to products and services provided by the Companies operating under the FXOpen brand, nor is it to be considered financial advice.

XAU/USD – Technical AnalysisThe chart reflects a sustained bearish phase within a well-defined descending channel, yet current price action suggests a potential trend shift may be underway.
🧠 Key Observations:
Price Compression Near Channel Support:
The market is testing the lower boundary of the descending channel, indicating possible exhaustion of selling momentum.
Ichimoku Cloud Analysis:
Price remains below the cloud, confirming bearish structure for now. However, cloud thinning ahead signals a weakening trend, which often precedes a reversal.
Projected Recovery Path:
A forecasted move is highlighted, suggesting a break above $3,360–$3,380, targeting the upper cloud resistance near $3,400. This level aligns with prior structure and volume interest.
Volume Profile (left):
Strong volume nodes align with support zones, reinforcing the potential for a bounce if momentum shifts.
📌 Strategy Insight:
While bearish momentum remains in control, signs of stabilization and potential reversal are emerging. Traders should wait for:
A confirmed break above the cloud, or
A bullish engulfing with volume support to validate long entries.
✅ Summary:
Trend remains bearish, but the setup shows early signs of accumulation and reversal. A breakout from the cloud and descending channel could trigger a shift toward $3,400+ in the near term. Monitoring phase active.

XAU/USD Technical Analysis 📊 XAU/USD Technical Analysis (June 18, 2025)
🟢 Current Market Overview
Price: $3,381.19
The market is currently trading within a defined range, showing consolidation above a strong support zone.
🔍 Key Technical Levels
Support Zone: $3,360 – $3,375
This level has been tested multiple times and held firmly, indicating strong buying interest 📈.
Resistance Zone: $3,435 – $3,455
Price has previously rejected this zone, suggesting active sellers in this area ⚠️.
🧠 Price Action Insight
The recent price structure shows a pullback into support after a strong bullish move.
The current consolidation suggests accumulation before a potential breakout.
A bullish reversal pattern seems to be forming near support, pointing toward a possible rally toward resistance.
📈 Projected Move
📍 Scenario: Bounce from support zone → Break toward resistance.
The marked projection curve suggests price may retest support, then rally to the $3,440–$3,455 resistance area.
🧾 Trading Outlook
Bias: Bullish (above $3,360)
Entry Zone: $3,365 – $3,375
Target: $3,440 – $3,455
Invalidation: Break and close below $3,355 (would indicate weakness) 🚫
📅 Fundamental Context
Multiple high-impact USD events are approaching 🇺🇸 (noted at the bottom of the chart). These could cause volatility and may act as catalysts for the breakout.
✅ Conclusion
The market is currently in a bullish accumulation phase above strong support. As long as this level holds, a move toward the resistance zone remains the high-probability scenario. Monitor closely for confirmation via bullish candlesticks or volume increase.

What Is a Morning Star Pattern & How Can You Use It in Trading?What Is a Morning Star Pattern, and How Can You Use It in Trading?
The morning star candlestick is a popular price action pattern that technical analysts and traders use to identify potential trading opportunities. It indicates a reversal from a bearish to a bullish trend and is a valuable addition to any trader's toolkit. In this article, we will cover all the technical aspects of the morning star candlestick pattern.
What Is the Morning Star Candlestick Pattern?
The morning star in technical analysis is a reversal formation that appears at the end of a downtrend and signals a trend reversal. It consists of three candles.
To identify it on the chart, you should look for the following:
1. Downtrend: The market should be in a downtrend, and the first candle should be long and bearish.
2. Indecision: The second candle is usually expected to have a gap down, but gaps are uncommon in forex. Therefore, a small-bodied candle is considered sufficient. It's worth noting it can be either bullish or bearish, but if it’s bullish, the signal is stronger.
3. Significant increase: The third candle should be strong and bullish and close above the midpoint of the first bearish one. If it forms with a gap up, the buy signal is considered stronger.
When Morning Star Candlestick Patterns Occur
Traders can identify the morning star candlestick pattern in stocks, forex pairs, commodities, and cryptocurrencies*. It may also be observed across various timeframes, from minutes to weeks.
Generally speaking, a morning star pattern can be considered more reliable when it appears on a higher timeframe. For instance, a morning star candlestick pattern has more significance when it occurs over three days vs three minutes, given the increased amount of price action and market participation reflected over longer periods.
Psychology Behind the Pattern
The morning star reversal pattern reflects a shift in market sentiment from bearish to bullish. Initially, a strong bearish candle indicates prevailing selling pressure. The second candle, with its small body, suggests indecision as the market stabilises and neither bulls nor bears dominate. This pause indicates that sellers are losing momentum. The third morning star candle, a strong bullish one, confirms the shift as buyers take control, driving prices higher. This pattern signals that the downtrend is likely exhausted, and a potential reversal is underway due to increasing buyer confidence.
Trading with the Morning Star
Traders can use the following steps to trade this setup:
1. Identify the setup: Look for a setup on the chart formed after a solid downtrend.
2. Confirmation: After identifying the formation, traders should confirm it before entering a long position.
3. Enter a long position: Consider entering a long position once the formation is confirmed.
4. Determine a take-profit target: Although candlesticks don’t provide specific entry and exit points, traders may consider the closest resistance level to take potential profit.
5. Monitor the trade: Continuously monitor the trade and adjust the stop-loss and take-profit levels as needed based on market conditions.
What Is the Morning Star Candlestick Strategy?
The morning star trading strategy leverages the formation's ability to signal a bullish reversal after a downtrend. The formation's reliability increases when it occurs at a support level and is confirmed by a momentum indicator like the RSI or MACD.
Entry:
- Traders look for the full morning star to form at a support level.
- They then look for a confirmatory bullish signal from a momentum indicator, such as RSI showing oversold conditions, a bullish MACD crossover, or a bullish divergence in either.
- Traders may wait for additional confirmation, like RSI moving back above 30, or enter on the close of the third candle in the pattern.
Stop Loss:
- A stop loss might be set below the swing low of the setup.
- Alternatively, traders may place the stop loss beyond the lower boundary of the established support level.
Take Profit:
- Profits might be taken at a predetermined risk-reward ratio, like 2:1 or 3:1.
- Traders also often aim for an opposing resistance level where a further reversal might occur.
Morning Star and Other Formations
Traders should not confuse the morning star candle formation with other formations, such as the evening star, which is the complete opposite.
Doji Morning Star
In a traditional morning star reversal pattern, the candle that appears in the middle of the formation has a small real body, meaning there is a clear difference between the opening and closing prices.
In a morning doji star formation, the second candlestick has characteristics of a doji, where the opening and closing prices are very close to each other, resulting in a very small real body. This reflects the indecision as neither bulls nor bears can take control of the market.
The doji setup is less common than the traditional formation, but it still signals a potential upward movement after a prolonged downtrend.
Evening Star
In contrast to a morning setup, an evening star is a bearish setup occurring after an uptrend. It also consists of three candles – a long bullish one, a small-body one (it can also be a doji), and a long bearish one that closes below the midpoint of the first bullish candle. This suggests that the market is about to turn down.
Benefits and Limitations of the Morning Star Candle
The morning star is a useful tool for traders seeking to identify potential market reversals, but it does come with some benefits and limitations.
Benefits
- Strong Reversal Signal: Indicates a bullish reversal after a downtrend, helping traders anticipate upward moves.
- Broad Applicability: Effective across various financial instruments such as forex, stocks, commodities, and cryptocurrencies*.
- Timeframe Flexibility: It can be observed on different timeframes, from intraday to weekly charts.
Limitations
- False Signals: Like all patterns, it can produce false signals, especially in volatile markets.
- Confirmation Needed: A morning star pattern entry requires confirmation from additional indicators or formations to improve accuracy.
- Experience Required: Identifying the formation correctly and interpreting its signals requires experience and a good understanding of price action.
Final Thoughts
While candlestick formations such as the morning star can be useful for traders to identify potential trading opportunities, it is crucial to remember that they are not foolproof and should not be the sole choice of market participants when making their trading decisions. Traders should also incorporate technical indicators and develop risk management techniques to potentially minimise losses.
FAQ
What Is a Morning Star in Trading?
The meaning of a morning star in trading refers to a bullish reversal formation consisting of three candles. It appears at the end of a downtrend, indicating a potential shift to an uptrend. The setup includes a long bearish candle, a small-bodied candle, and a long bullish candle.
Is the Morning Star Bullish or Bearish?
It is a bullish candlestick pattern that indicates a potential reversal from a downtrend to an uptrend in the market. It suggests that the selling pressure is subsiding, and buying pressure is beginning to take over.
What Does the Morning Star Pattern Indicate?
It is a three-candle price action, often indicating a bullish reversal in the market. It suggests that selling pressure has been exhausted, and buyers are starting to gain control of the market.
How Do You Read the Morning Star Pattern?
To read the morning star formation, traders should look for the following characteristics: a long bearish candle formed in a solid downtrend and followed by a bullish or bearish candle with a small real body, which in turn is followed by a long bullish candle closing above the midpoint of the first one.
What Is the Opposite of Morning Star?
The opposite of a morning star is the evening star, a bearish reversal pattern. It appears at the end of an uptrend, signalling a potential shift to a downtrend. The morning and evening stars are similar, except the latter mirrors the former, consisting of a long bullish candle, a small-bodied candle, and a long bearish candle.
*Important: At FXOpen UK, Cryptocurrency trading via CFDs is only available to our Professional clients. They are not available for trading by Retail clients. To find out more information about how this may affect you, please get in touch with our team.
This article represents the opinion of the Companies operating under the FXOpen brand only. It is not to be construed as an offer, solicitation, or recommendation with respect to products and services provided by the Companies operating under the FXOpen brand, nor is it to be considered financial advice.

CHAMBAL FERTILIZERS FOR SWING TRADECHAMBAL FERTILIZERS a good opportunity for swing trade plan, entry and exit point mention, add your watchlist and observe.
This is for Education purpose only...

A Follow up to: “Adjustments for Better Readings & VSA vs BTC"When a trend approaches its end, we typically observe the formation of a buying or selling climax. That was certainly the case during Wyckoff’s era. Everything he described—market manipulation, signals, footprints—remains relevant today. But you know what that also means: if it's out there, it’s old news.
Yes, this is still happening, but we need to acknowledge that this information is no longer exclusive. And when a method becomes well-known—especially among retail traders—it can be used against them. Wyckoff himself hinted at this: the manipulators can and do use these same technical patterns to deceive. His real message?
“Keep an open mind.”
📉 In our current BTC chart, we’re seeing a textbook example of potential manipulation. A selling climax is visible—normally a sign of trend exhaustion and a bullish reversal. But is that really the case here? Did the downtrend truly end?
On the 1-Hour timeframe, both the RSI and volume indicators suggest otherwise: a bearish continuation seems more likely.
🧱 We're also witnessing a real-time formation of a Double Top pattern, taking shape since June 6. Measured by body candle spreads (excluding wicks), we observe four touches within a key price rectangle. These align with a known candlestick pattern: the Tweezer Top, commonly associated with bearish reversals.
What’s more, all of this is happening within a supply zone—actually three marked zones on the chart. The most recent zone shows signs of offloading pressure, amplified by both the Double Top and bearish candlestick formations.
And I haven’t even touched on the rejection wicks or how bearish volume spikes are gaining strength. That’s where the principle of Effort vs. Result comes in—remember, nothing in the market is free.
📊 In line with our past two posts, note how price action (PA) shows equal highs while RSI diverges, reinforcing earlier signals. The signs are stacking up.
So, the critical question now is:
Are we heading below the $100.718 level for a confirmed Head & Shoulders pattern?
Or is this just a retest before another move?
If this way of reading the market resonates with you and you want to go deeper—whether it’s building confidence or spotting signals before they play out—I work with a small circle of traders sharing TA privately on a daily basis. Feel free to reach out.
Till next time be well and trade wisely!


Types of Engulfing Candles!In trading, an Engulfing candle (or Engulfing pattern) is a two-candle reversal pattern that can indicate a potential change in market direction. It is commonly used in technical analysis in both bullish and bearish contexts.
Types of Engulfing Candles
1. Bullish Engulfing Pattern:
Occurs during a downtrend.
The first candle is bearish (red or black), showing continued selling pressure.
The second candle is bullish (green or white) and completely engulfs the body of the first candle (its open is lower and close is higher).
This pattern signals a potential reversal to the upside.
2. Bearish Engulfing Pattern:
Occurs during an uptrend.
The first candle is bullish.
The second candle is bearish and completely engulfs the first candle's body (its open is higher and close is lower).
This pattern signals a potential reversal to the downside.
Key Characteristics
The second candle’s body must fully engulf the first candle’s body (wicks/tails are not necessary to engulf).
The stronger the engulfing candle (in terms of size and volume), the more significant the signal may be.
Often more reliable when confirmed with volume or used in conjunction with other technical indicators (e.g., RSI, support/resistance levels).
Example:
Bullish Engulfing Example:
Day 1: Bearish candle opens at $100 and closes at $95.
Day 2: Bullish candle opens at $94 and closes at $101 — it completely engulfs Day 1's body.
This would suggest a potential shift from sellers to buyers.

What is a Bearish Breakaway and How To Spot One!This Educational Idea consists of:
- What a Bearish Breakaway Candlestick Pattern is
- How its Formed
- Added Confirmations
The example comes to us from EURGBP over the evening hours!
Since I was late to turn it into a Trade Idea, perfect opportunity for a Learning Curve!
Hope you enjoy and find value!

AUD/USD Price Action Analysis – Range Trading Opportunity📉 AUD/USD Price Action Analysis – Range Trading Opportunity 🔁
⚙️ Market Structure Overview:
The AUD/USD pair is currently exhibiting a well-defined range-bound market structure between the Support Zone (0.63800 – 0.64000) and the Resistance Zone (0.65200 – 0.65400).
🟩 Support Zone
📍 Identified by multiple price rejections and bullish reversals (marked with ⬆️ arrows).
💡 This area represents strong buying interest, making it a potential long-entry zone on bullish confirmation.
🟥 Resistance Zone
📍 Marked by two sharp rejections (⬇️ arrows) and upper wicks.
💡 This zone has served as a supply area, where sellers overpower buyers, signaling potential short opportunities.
🔄 Current Scenario:
Price is approaching the support zone again after rejecting the resistance area. Based on historical behavior:
📉 Short-term Bearish Momentum is in play until support is tested.
📈 Potential Bullish Reversal is likely if support holds — aligning with previous bounce behavior.
🔮 Trade Ideas:
📈 Bullish Setup:
📍Entry: Near support zone (~0.63850)
🎯Target: Resistance zone (~0.65250)
🛑Stop-loss: Below support (~0.63650)
📉 Bearish Setup (Breakdown Scenario):
📍Entry: On confirmed break below support (~0.63800)
🎯Target: Lower structure zones (TBD based on breakout leg)
🛑Stop-loss: Above broken support
📅 Key Risk Events:
🔔 Multiple high-impact USD and AUD economic events approaching.
🧭 Traders should monitor fundamentals closely for increased volatility and breakout potential.
🧠 Summary:
📌 The AUD/USD pair is currently respecting a range-bound structure.
🧱 Buying from support and selling from resistance remains the most probable high-probability strategy.
📊 Range trading suits this setup until a confirmed breakout or breakdown occurs.
🔔 Like & Follow for more clean, structured trade setups and zone-based price action ideas!

Professional Analysis: XAU/USD – GOLD Price Forecast :
📈 Professional Analysis: XAU/USD – GOLD Price Forecast 🟡
🗓️ Date: May 28–29, 2025 | ⏱ Timeframe: Intraday (Hourly)
🔍 Instrument: Gold vs. USD (XAU/USD)
📊 Technical Chart Summary
🟥 Resistance Zone:
📌 Level: $3,350 – $3,365
🛑 Price has rejected this zone multiple times, marking it as a strong supply area.
📉 Each test of resistance led to a pullback — showing seller strength 💪.
🟩 Support Zone:
📌 Level: $3,280 – $3,295
🛡 Multiple higher low bounces suggest this zone is being defended by buyers.
🔁 Price has formed 3 reaction lows, indicating accumulation 📥.
🔄 Structure & Pattern Recognition
🔺 Descending followed by Ascending Swings
⛳ Market shows a reversal attempt after forming a potential double bottom / triple test at support.
📈 Bullish structure forming with the latest swing creating a higher low.
📉 Past wave = Bearish Correction
📈 Current projection = Potential bullish impulse if the support holds.
📐 Projection & Price Action Forecast
📍 Current Price: $3,297.175
📈 Expected Move: Bounce off support → climb toward $3,330–$3,350 🔼
🧠 Rationale:
Price testing support again
Market respecting horizontal range
No clean breakdown yet
📊 Bullish Scenario (Primary)
🔁 Rebound off support
🎯 Target: Resistance zone ($3,350)
✅ Entry: Above $3,300 with bullish candle close
🛑 SL: Below $3,280
📉 Bearish Breakdown (Alternate)
❌ Break below $3,280
🎯 Target: $3,260 or lower
⚠️ Wait for confirmation candle
🔚 Conclusion
🟡 Gold (XAU/USD) is trading within a well-defined range with buyers stepping in near $3,290 and sellers near $3,355.
📌 Based on current technicals, there’s a higher probability of an upward move, unless support breaks decisively.
🛠️ Pro Tip:
💡 Use RSI + Volume to confirm momentum on breakout. Look for bullish divergence or volume surge near the bounce.

CADCHF - Sell Short - Trendline and Candle stick confluences. Market is making a series of LH and LLs- Market has rejected from trend line resistance. Bearish Engulfing candle formation is a strong confluence of market bearish trend.
we can instant enter in the market, SL would be slightly above Last confirmed LH and TPs would be with R:R of 1:1 and 1:2 respectively.

Bullish Engulfing Pattern: A Strong Reversal SignalBullish Engulfing Pattern: A Strong Reversal Signal
The bullish engulfing pattern is a two-candlestick formation that suggests a possible reversal from a downtrend to an uptrend in the financial market. This particular pattern holds immense value for traders and technical analysts as it equips them with the means to discern potential buying opportunities. In this article, we will explain how traders implement this pattern in their trading strategies.
What Is a Bullish Engulfing Pattern?
The bullish engulfing is a technical analysis pattern consisting of two candles. This formation emerges when a large bearish candlestick is succeeded by a larger green one that entirely engulfs it.
What does the bullish engulfing mean? The bullish engulfing indicates a potential shift in market sentiment, suggesting that buying pressure might surpass selling pressure in the near future and highlighting a possible reversal from a downtrend to an uptrend.
Traders can find the bullish engulfing candlestick pattern across various financial instruments, including currencies, stocks, cryptocurrencies*, ETFs, and indices.
Bearish Engulfing vs Bullish Engulfing
The bullish engulfing pattern has a counterparty - bearish engulfing. The bearish engulfing pattern occurs during an uptrend, indicating a change in market sentiment and potential price reversal to the downside. It consists of two candles, where the second is larger and bearish and completely engulfs the body of the preceding candlestick.
How Can You Trade the Bullish Engulfing Pattern?
Here are some steps traders consider when trading with the bullish engulfing:
- Identification: Look for a clear bullish engulfing setup on a price chart at the end of a downtrend.
- Entry Point: Although candlestick patterns don't provide precise entry and exit points as chart patterns do, there are general rules you could use.
The entry point could be set slightly above the high of the bullish engulfing formation. In the conservative approach, traders enter the market after several candles close higher. In a risky approach, traders open a buy position after the pattern is formed.
- Exit Point: A stop-loss level could be below the low of the engulfing candle or below a nearby support level. A take-profit level could be based on a trader’s risk/reward ratio or key resistance levels.
- Risk Management: You can consider a risk management strategy to potentially limit losses. Traders focus on appropriate position sizing and risk-to-reward ratios to maintain a balanced approach to trading.
- Trade Monitoring: Once you have entered the trade, monitor price action and market conditions. Pay attention to any sign of reversal confirmation or potential obstacles that may invalidate the signal.
- Stop-Loss and Take-Profit Adjustment: As the trade progresses, you may consider adjusting your stop-loss level to protect potential returns. Similarly, you may consider adjusting your take-profit level if the price signals a strong uptrend.
Live Market Example
Let's consider an example of a bullish engulfing on the forex chart. The bullish engulfing candle in the example below is marked with 1 and 2. The trader sets the entry point above the green candle and a stop-loss level below it. The take profit is at the closest resistance level.
How Do Traders Confirm a Bullish Engulfing Candlestick Pattern?
Confirming this pattern enhances the reliability of its signals and helps traders make informed decisions. Here are key steps to confirm it:
- Volume Analysis: Traders typically look for increased buying trading volume accompanying the candle. Higher volume suggests stronger buyers’ interest and validates the reversal signal.
- Follow-Up Candlesticks: Waiting for subsequent closes can confirm the upward momentum. A series of higher closes strengthens its credibility.
- Support Levels: If it forms near a significant support level, this adds context to the reversal, as buyers are stepping in at a critical price point.
- Technical Indicators: Complementary indicators like the Relative Strength Index (RSI), Stochastic Oscillator, or a pair of moving averages can confirm the shift in sentiment.
- Market Context: Traders assess the overall market trend and news to ensure the formation aligns with broader market conditions.
Bullish Engulfing and Other Patterns
Let’s take a closer look at how this pattern compares to other chart formations, like the piercing and harami.
What Is the Difference Between a Bullish Engulfing and a Piercing Pattern?
A bullish engulfing pattern occurs when a large bearish bar is followed by a larger candlestick that completely overtakes the former's body. This indicates a strong potential reversal from a downtrend to an uptrend.
In contrast, a piercing formation also signals a potential reversal but is slightly weaker. It forms when a bearish candle is followed by a bullish candle that closes above its midpoint but doesn’t envelop it entirely.
What Is the Difference Between a Bullish Engulfing Pattern and a Bullish Harami Pattern?
The bullish harami pattern consists of a large red candle followed by a smaller green candle that is completely contained within the body of the red candle. This formation suggests a potential reversal but is generally considered less strong than the bullish engulfing candle pattern, as the latter completely envelops the previous bearish bar, showing more decisive buying pressure.
Final Thoughts
While this pattern offers valuable insights into potential trend reversals, it's essential to complement it with technical indicators and robust risk management for effective use. Also, be sure to explore other patterns as they may look very similar but provide different signals.
FAQ
What Is a Bullish Engulfing Pattern?
A bullish engulfing pattern is a two-candlestick formation in technical analysis that suggests a potential reversal from a downtrend to an uptrend. It occurs when a large bearish candlestick is followed by a larger bullish candlestick that completely engulfs the body of the preceding bearish candle.
How Reliable Is the Bullish Engulfing Pattern?
The reliability of the bullish engulfing pattern as a reversal signal depends on various factors, including the overall market context, confirmation from other technical indicators, and the timeframe being analysed. While it can be a strong indication of a potential trend reversal, it is not foolproof and should be used in conjunction with other tools and fundamental analysis.
What Is a Bullish Engulfing Candle Trading Strategy?
The bullish engulfing candle strategy involves identifying this pattern at the end of a downtrend as a signal for a potential sentiment shift. Traders typically enter a buy position slightly above the high of the closing bar, with stop-loss levels set below the low or beneath nearby support levels. Take-profit levels are determined based on risk/reward ratios or key resistance levels.
Do Wicks Matter in Engulfing Candlesticks?
Yes, wicks matter in the formation. The wicks provide insights into price rejection and volatility. For a strong confirmation, the absence of long upper wicks suggests sustained buying pressure, reinforcing its validity as a reversal signal.
*Important: At FXOpen UK, Cryptocurrency trading via CFDs is only available to our Professional clients. They are not available for trading by Retail clients. To find out more information about how this may affect you, please get in touch with our team.
This article represents the opinion of the Companies operating under the FXOpen brand only. It is not to be construed as an offer, solicitation, or recommendation with respect to products and services provided by the Companies operating under the FXOpen brand, nor is it to be considered financial advice.

AUDCAD - SNIPER PRECEISE SHOT SELLING ENTRY - FIB GOLDEN LEVELHI Guyz, Based on sentiments of traders across the globe , 93 % of the traders are currently looking at selling the AUDCAD. I anticipate this would retrace to the 0.382 Level of FIB and take this opportunity to short sell.
Formation of Shooting Star candle stick pattern further confirms the possibility that HH is formed and now it will take corrective move.
STOP LOSS and TP1, TP2 and TP3 are defined with R:R of 1:1, 1:2 and 1:3 respectively.
Happy Trading and Thanks Me later !
Regards,
ProTradeProfessor!

Hammer Candlestick: Meaning and SignalsHammer Candlestick: Meaning and Signals
Technical analysis is a commonly used approach in the financial markets. It involves studying historical price data to make informed trading decisions. Among the various tools and formations employed in technical analysis, the hammer candlestick pattern stands out as a powerful tool. This article will delve into the meaning of the hammer candlestick pattern and explain how traders can interpret it on a forex, stock, and crypto* price chart.
What Is a Hammer Candle?
A hammer is a candlestick that is found on trading charts. It occurs at the end of a downtrend and acts as a bullish reversal signal.
To identify a bullish hammer candle on a price chart, traders do the following:
- Look for a significant downward movement: They begin by searching for a notable decline in an asset’s price.
- Observe the candle shape: The setup is characterised by a small body near the top of the candle and a long lower shadow. The lower shadow must be at least two times the length of the body. The colour of the candle doesn’t matter, but if it’s a green hammer candlestick, meaning it closed higher than it opened, the signal may be stronger.
- Analyse the context: Traders usually look for areas of support nearby as they may increase the setup's reliability.
Bullish Hammer Pattern: Trading Rules
Here are the common steps traders take when trading with a hammer:
- Confirm validity: Traders ensure that the hammer meets the criteria discussed earlier, such as a significant market decline followed by a candle with a small real body near the top and a large lower wick.
- Determine the entry point: Once the bullish hammer candlestick is confirmed, traders identify an appropriate entry point. Candlesticks don’t provide specific entry points. However, traders usually wait for the subsequent bar to close above and enter the trade if the market moves higher.
- Set stop-loss and take-profit levels: Traders place a stop-loss order below the low of the hammer to potentially limit risks. Traders determine a suitable take-profit level based on their trading approach, such as at the nearest resistance level or in accordance with the risk/reward ratio.
Trading Example
A trader spots a hammer on the hourly chart of the EURUSD pair. They wait for the candle to close above the hammer to enter the market. Their stop loss is below the hammer’s lower shadow, with the take profit calculated in accordance with the 1:2 risk/reward ratio.
How Can You Confirm the Hammer Candlestick?
Confirming the hammer candlestick pattern enhances the reliability of trading decisions. Beyond its basic identification, several techniques and indicators help validate its potential bullish reversal signal.
- Volume Analysis: A significant increase in trading volume during the formation of the hammer candlestick suggests stronger confirmation. Higher buying volume indicates heightened interest and participation, reinforcing the potential reversal.
- Support Levels: The presence of a strong support level near the hammer adds credibility to the pattern. Support levels act as psychological barriers where buying interest may increase, boosting the likelihood of a reversal.
- Subsequent Candlesticks: Observing the price action of the next few candlesticks after the hammer can provide further confirmation. A bullish candle closing above the high of the hammer enhances its validity.
-Double Hammer Pattern: While rare, a double hammer candlestick pattern where two candles appear consecutively can offer strong confirmation of a bullish movement.
- Trend Indicators: Utilising trend indicators like moving averages can help confirm the hammer. A rising moving average confirming the upward trend or a hammer forming in line with a broader trend adds weight to the potential reversal.
- Divergence: Identifying divergence between the price and momentum indicators, such as the Relative Strength Index (RSI) or Moving Average Convergence Divergence (MACD), can strengthen the pattern's reliability.
Hammer and Other Candlestick Patterns
Let’s compare the hammer to other candle formations you can spot on price charts.
Inverted Hammer
The inverted hammer is similar to the hammer but has a different appearance. It is characterised by a small body near the bottom of the candle and a long upper wick. The inverted hammer signals a potential bullish reversal as buyers start to gain strength and push the market up. The small body and small lower shadow reflect the rejection of lower prices, suggesting a shift in market sentiment from bearish to bullish.
Doji
In contrast to the red or green hammer candlestick pattern, the doji features a small real body with equal or close opening and closing prices and long upper and lower wicks. It represents market indecision, where neither buyers nor sellers have gained a clear advantage. While the hammer is potent during the downtrend, the doji can occur after both uptrends and downtrends, and it signals market consolidation or a potential trend reversal.
Shooting Star
The shooting star formation emerges at the top of an uptrend and suggests a potential bearish reversal. It is identified by a small real body near the bottom of the candle and a long upper wick, implying a rejection of higher prices and potential exhaustion of buying pressure.
Hanging Man
The hanging man emerges after an uptrend and suggests a potential bearish reversal. It resembles the hammer with a small real body near the top and a long lower wick, but the crucial difference is that it occurs in an uptrend. The hanging man implies that sellers are starting to exert influence, potentially leading to a reversal in the market.
Limitations of the Hammer Pattern
While the hammer is a valuable tool in technical analysis, it is not without its limitations.
- False Signals: It can sometimes produce false signals, leading to premature or incorrect trade entries. In certain market conditions, such as strong downtrends or highly volatile environments, the hammer may be less effective. Its success rate can vary across different assets and market scenarios.
- Dependence on Confirmation: The reliability of the hammer significantly depends on additional confirmation tools and indicators. Without these, alone it might not provide sufficient confidence for trading decisions.
- Short-Term Nature: The hammer primarily signals short-term price movements and typically can’t be used to anticipate medium or long-term price trends.
The Bottom Line
Successful implementation of the hammer formation requires experience, practice, and the use of additional technical analysis tools and indicators. Traders never rely solely on the hammer’s signals but integrate it into a comprehensive trading strategy.
FAQ
What Is a Hammer Candlestick?
A hammer is a specific setup found in charts that indicates a potential reversal to an uptrend. It is formed when a financial instrument opens at a certain price and experiences a significant decline during the trading period but eventually rallies back and closes near its opening price.
Is a Hammer Candlestick Pattern Bullish?
Yes, the hammer candlestick pattern is generally considered bullish. It signifies a potential trend reversal after a downtrend, as buyers enter the market and drive the price higher from its lows. The long lower shadow indicates that the buying pressure is strong and can potentially lead to further upward movement in the market.
Can a Hammer Candle Be Bearish?
A hammer candle is generally considered a bullish reversal signal, signalling a potential upward price movement after a downtrend. There is no bearish hammer. If the market continues to move lower after it forms, it just means that bearish market conditions were stronger and didn’t allow buyers to change market sentiment.
What Is the Hammer Candle Rule?
The hammer candle rule states that it must occur after a significant downtrend, have a small real body near the top of the candle, and feature a long lower shadow at least twice the length of the body. This pattern indicates a potential bullish reversal if confirmed by subsequent price action.
What Is the Hammer Strategy?
The hammer trading strategy involves identifying a candlestick at the end of a downtrend, confirming its validity with additional indicators or signals, and then entering a long position. Traders typically set stop-loss orders below the hammer's low and determine take-profit levels based on risk/reward ratios or nearby resistance levels.
*Important: At FXOpen UK, Cryptocurrency trading via CFDs is only available to our Professional clients. They are not available for trading by Retail clients. To find out more information about how this may affect you, please get in touch with our team.
This article represents the opinion of the Companies operating under the FXOpen brand only. It is not to be construed as an offer, solicitation, or recommendation with respect to products and services provided by the Companies operating under the FXOpen brand, nor is it to be considered financial advice.
