Will Ripple "leave a dent in the universe"?They called us crazy, when we bought xrp at the bottom, in the midst of court cases. What they don't see is that, many TODAY major companies that changed the world (e.g. Apple, Amazon, MSFT etc.) had long term court cases with the SEC before "leaving a dent in the universe". In our opinion, Ripple is next in line.
#xrp #crypto #bitcoin #ripple #banking #blockchain #finance #money #stablecoin #financialsystem
Contains IO script

All Binance Coins Watchlist 2025 JULY If you want to create a full list of all coins from the exchange you use, you can:
1. Go to Screeners
2. Set these filters:
a. Exchange (eg. Binance)
b. Quote currency - USDT
c. Symbol type - Perpetual
3. Keep Scrolling till the end of the list so that all coins are populated. There should be about 400+ coins.
4. Select one of the coins, then click Ctrl A to select all.
5. Right click > Add to an existing Watchlist or Create a new watchlist.
Here's my list i created on 4th July 2025. You can import it if you want.
www.tradingview.com

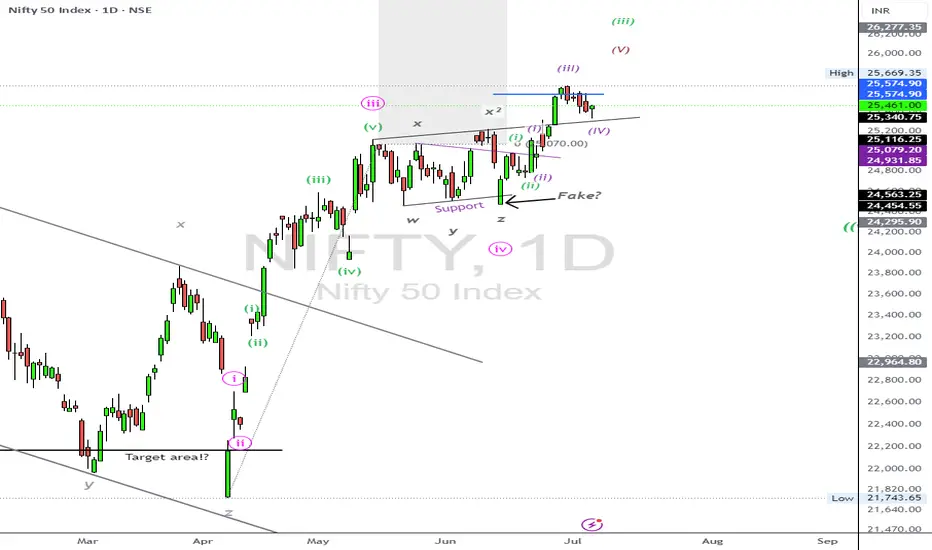
NIFTY50.....The path is clear! Or?Hello Traders,
the NIFTY50 is bouncing around the resistance level @ 25669 and 25116! Of course, a wide range, but that's the truth! I have labelled the chart as to see, but the pattern is not that clear as it seems!
Chart analysis; details!
The last multi-week low @ 21743 points was labeled as a wave z of 4! Since, the count is arguing a new impulse is underway with targets well above the latest ATH @ 26227! This, of course, is my main count I'm following.
But! The correction, started on September 27th 2024 and last 'til April 7th 2025, can morph into a wave b of a long term correction. The first correction (September to April) in fact was a wave a in this case, the actually one a wave b, with a leg (Wave) c to come. There is no rule how long (in terms of percent) this correction can extend, only a guideline. This one says, the maximum to be allowed is the 1.618 Fibo-Extension of wave a!
Anyway!
The bulls like to see new high's above the latest @ 26277, which is a long way to go. For this idea, it is important not to touch the area of the wave (i) pink @ 25317! If this were the case, the count is no longer valid. Following my interpretation of a "possible" wave b, that extent, the path would be set to a new ATH in the coming 1–2 weeks, 'cause both path tell exact this scenario!
Anyway! We will see how the market will meet the decision in the coming week.
Act with patient and carefully!
Have a great weekend.....
Ruebennase
Please ask or comment as appropriate.
Trade on this analysis at your own risk.
Bitcoin takes a deeper dive on wave 4!The Daily: Dormant Bitcoin wallets wake after 14 years to move billions of dollars in BTC, House GOP declares ‘Crypto Week,’ and more!

XRP/USDT Trade Setup – 15minLondon session raided Asia's lows, grabbing liquidity and creating the conditions for a bullish reversal. This setup aligns with the NY session's typical continuation behavior following a London manipulation move.
Post-raid, price structure shifted bullish, indicating smart money accumulation. A clear fair value gap (FVG) formed, and entry was taken upon confirmation of bullish order flow.
Entry: 2.227
Stop Loss: 2.200
Take Profit: 2.400
Risk-Reward Ratio: 9.23R
Narrative:
London session swept Asia lows (liquidity engineered).
Break in market structure confirmed shift.
Entry aligned with FVG and order block mitigation.
Targeting inefficiency fill and liquidity above recent highs.
Note:
This trade is for journal purposes only and not financial advice.
Always perform your own analysis and manage risk accordingly.

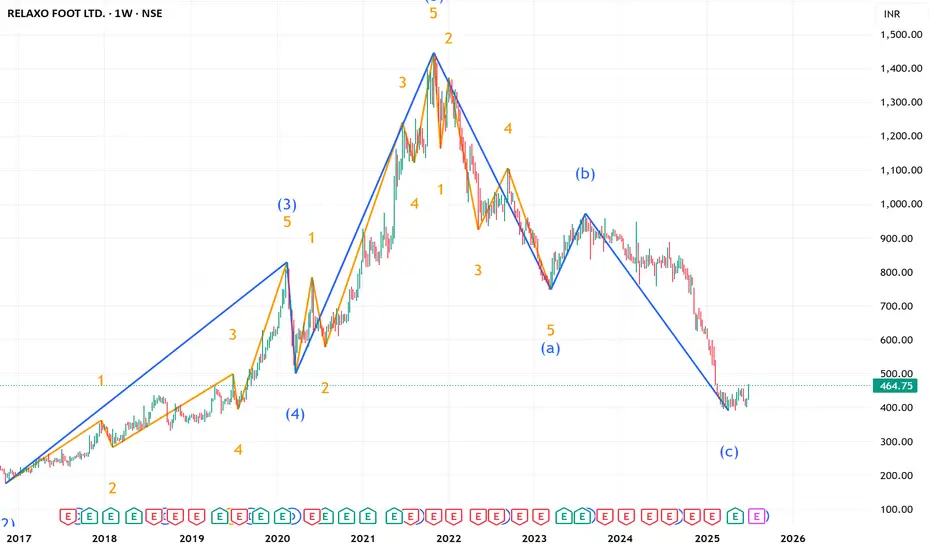
RELAXO ---Ready For UP SIDE---- ( LONG TERM Investment ) RELAXO Weekly counts indicate a Excellent bullish wave structure.
Both appear to be optimistic and this stock invalidation number 52 week low
target short / long term are already shared as per charts
correction wave leg seems completed
Investing in declines is a smart move for long-term players.
Buy in DIPS recommended
Long-term investors prepare for strong returns over the next two to five years.
Every graphic used to comprehend & LEARN & understand the theory of Elliot waves, Harmonic waves, Gann Theory, and Time theory
Every chart is for educational purposes.
We have no accountability for your profit or loss.
B SOFT Ready To FLY ? ( LONG TERM IDEA ) !!!
B SOFT DAILY counts indicate a bullish wave structure.
Both appear to be optimistic, and this index invalidation number
target are already shared as per charts
Investing in declines is a smart move for long-term players.
Long-term investors prepare for strong returns over the next two to five years.
Every graphic used to comprehend & LEARN & understand the theory of Elliot waves, Harmonic waves, Gann Theory, and tTme theory
Every chart is for educational purposes.
We have no accountability for profit or loss.

ACC BULL waves started BIG Giant Ready to Roll !!!ACC daily counts suggested DUAL match for Eillot waves + Harmonics bullish Wave structure
both looks bullish implus started for this stock
LONG TERM investors get ready for good returns in future for 2 to 5 yrs
all charts shown to understand elliot waves theory + harmonics waves + gann theory + time theory
all charts are education purpose!!!!!
we don't any responsibilities for profit /loss

TRX - Getting Out with a small LossIt seems that some sellers came in before resistance level. I am sure sure about the outcome so I am getting out with a small loss


BITCOIN enroute towards $112+!If wave 4 gets rejected from the wicks of wave 1...It's likely off to the races towards new highs on a wave 5 north!
That's a good trade set up on any Instrument!

LTCUSD - 3M CHARTYou tell me where the target of this 3M chart is. The higher the timeframe, the higher the probability to get the price targets…. Fundamentals are lined up. LFG!

ASIAN PAINTS --- Ready to Rock ? Looking Wise InvestmentASIAN PAINTS
weekly counts suggests if 2179 weekly close maintain than we assume completion 2
so impulse wave may start soon!!!!
its monopoly stock in his sector
long term buyers should definitely do their own analysis
open to test levels already shown in picture
invalidation for this pattern 2179 ( weekly close)

July Doesn't Disappoint - S&P Nasdaq Dow Russell All RunningS&P All Time Highs
Nasdaq All Time Highs
Dow Jones closing in on All-Time Highs (and outperforming both S&P and Nasdaq recently)
Russell 2000 playing catch up and moving higher
This is melt-up at its finest
Since US/China Trade Agreement and Middle East Ceasefire Agreement, markets have used
these two events as further catalysts to continue the upside runs
Stochastic Cycle with 9 candles suggesting a brief pause or pullback in the near-term, but
a 3-5-10% pullback is still an opportunity to position bullish for these markets
I'm only bearish if the markets show that they care with price action. The US Consumer isn't breaking. Corporate Profits aren't breaking. Guidance remains upbeat. Trump is Pro Growth and trolling Powell on the regular to run this economy and market HOT demanding cuts (history says that's a BUBBLE in the making if it's the case)
Like many, I wish I was more aggressive into this June/July run thus far, but I'm doing just fine with steady gains and income trades to move the needle and still having plenty of dry powder
on the sidelines for pullbacks
Markets close @ 1pm ET Thursday / Closed Friday for 4th of July
Enjoy the nice long weekend - back at it next week - thanks for watching!!!

TRX - No weakness yet went Long on PRL signal No obvious signs of weakness on the waves.
Up waves larger than down waves and no abnormal SIs
Therefore I went long after the 1st resistance break on PRL signal, target the 2md resistance.
Enjoy!

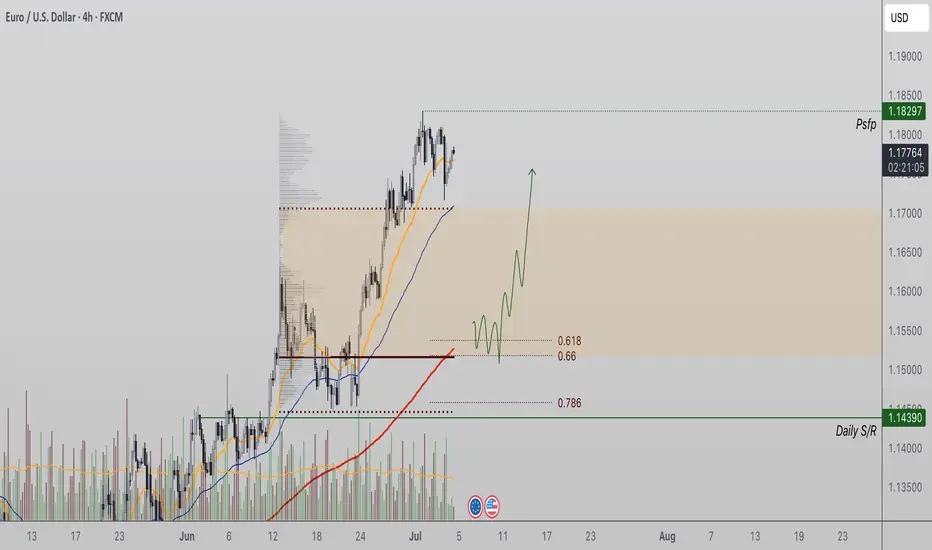
EURUSD Healthy Correction Could Set Up Next Bullish LegEURUSD continues to trade within a strong bullish structure, marked by a consistent sequence of higher highs and higher lows across multiple timeframes. The pair recently tested a significant resistance zone around $1.18, which acted as a swing high and has since been defended by sellers. This rejection has led to a short-term pause in the uptrend, with price now consolidating around the value area high, a critical area on the volume profile that typically precedes either continuation or a corrective move.
From a technical standpoint, a pullback from the current level would be healthy, especially given the extended nature of the recent move. The ideal retracement zone lies between the 0.618 Fibonacci level, the point of control (POC), and the 200-period moving average — all of which converge to form a strong demand region. A revisit of this zone would offer a textbook opportunity for the formation of a higher low, which would preserve the existing bullish structure and invite renewed buying interest.
A correction into this region would not indicate weakness but rather reinforce the strength of the trend. It allows for momentum reset and offers a more sustainable base for the next potential move higher, potentially targeting a breakout above the $1.18 swing high.
As long as price action remains above the previous higher low and these key support zones hold, the bullish bias remains intact, and traders may look for long opportunities on signs of a reversal within the corrective zone.
BTCUSD 4 hr. takes a deeper wave 4 dive!If wave 4 gets rejected from the wicks of wave 1...It's likely off to the races towards new highs on a wave 5 north!

CL "OIL" dropping towards $60/bbl.1). Oil Trading Lower as OPEC+ Likely to Agree on Another Big Production Increase for August! 2). Banks are "Selling!" 3). Volume position is falling!

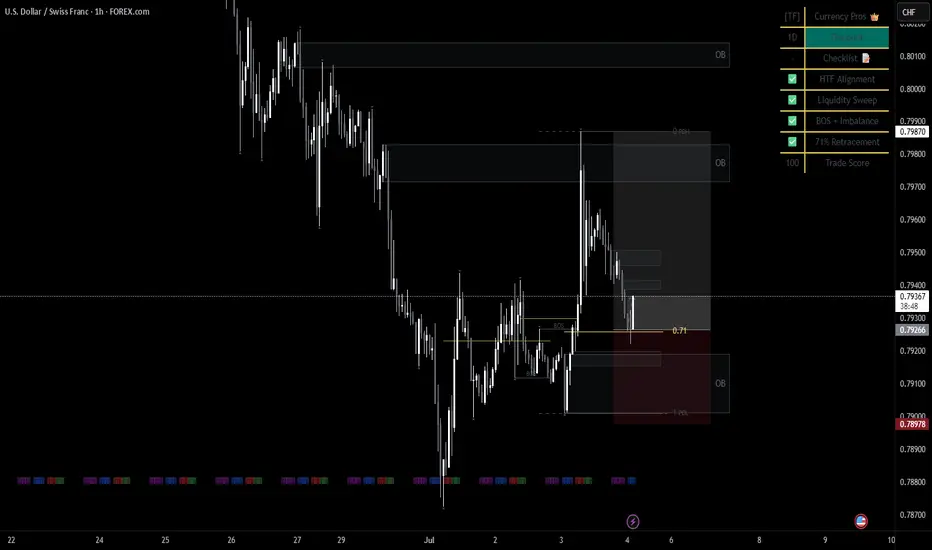
BUY USDCHFa few confirmations that influenced this trade. BOS, 71 fib & HTF alignment. I believe this will play out beautiful by Monday. lets goooooo
APOLLO TYRES ---Ready to Fire UP ? Elliot wave weekly counts 2APOLLO TYRES ---Ready to Fire UP ? Elliot wave weekly counts 2 wave begins
APOLLO TYRES ---Ready to Fire UP ?
weekly counts suggest if sustain abv 439 on weekly basis
than impulse wave may start shortly
EW theory consists multiple possibilities /different structure
this is our educational analysis

NZDUSD wave 4 south is likely over!1). Volume spiked with very likely long positions! 2). Banks are "Buying!" 3).US employment came-out low, weakening $ further against the KIWI!

Gold Latest Market Trend AnalysisThe data released by the U.S. Bureau of Labor Statistics showed that the U.S. seasonally adjusted non-farm payroll employment in June was 147,000, with the consensus forecast at 110,000. The previous value was revised up from 139,000 to 144,000. The annual rate of average hourly earnings in June stood at 3.7%, below the expected 3.90%, while the prior figure was revised down from 3.90% to 3.8%.
Following the release of the non-farm payroll report, interest rate futures traders abandoned their bets on a Federal Reserve rate cut in July. Currently, the market-implied probability of a Fed rate cut in September is approximately 80%, down from 98% prior to the report. On Thursday, gold exhibited a seesaw pattern, surging initially to hit resistance near $3,365 per ounce before retreating. During the U.S. session, it broke below support levels and further declined to hover around $3,311, where it staged a rebound. Gold remains in a high-range consolidation under selling pressure.
you are currently struggling with losses,or are unsure which of the numerous trading strategies to follow,You have the option to join our VIP program. I will assist you and provide you with accurate trading signals, enabling you to navigate the financial markets with greater confidence and potentially achieve optimal trading results.
Trading Strategy:
sell@3350-3355
TP:3320-3325

USDZAR: Sell Trigger on 4HGood morning and happy weekend everyone,
today I bring the chart of the UsdZar pair which shows a sell trigger via my LuBot Ultimate indicator which goes in favor of the short-term trend and the bearish market structure, both on the 4H and on the Daily, highlighted by the color of the candles in red.
The signal is also confirmed by the reversal signals shown above and a close below the previous 2 candles.
The indicator automatically shows exit levels that I will follow for my trade as the stop loss is far enough away to give the market room to breathe if it needs it and to avoid unnecessary stops. Stop which will subsequently be approached if the market moves in the direction of the trade.
The take profit is at the right distance given that we are close to a support zone indicated by the green area of the indicator.
Finally, the EVE indicator below has not shown any major excesses of volatility so we could still expect a strong movement before a possible reversal.
FX:USDZAR FOREXCOM:USDZAR SAXO:USDZAR FX_IDC:USDZAR OANDA:ZARJPY OANDA:EURZAR OANDA:GBPZAR OANDA:CHFZAR SAXO:AUDZAR SAXO:NZDZAR
