Curve

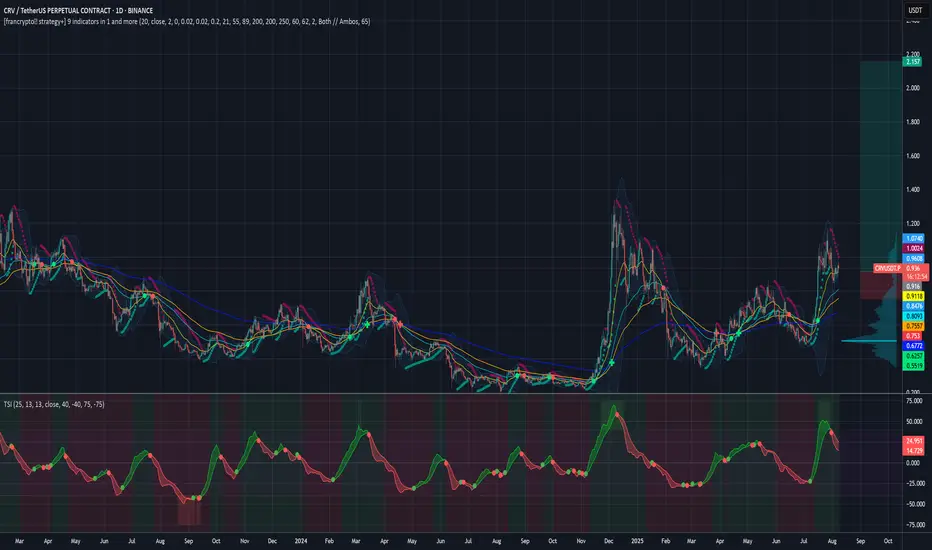
CurveCrv usdt daily analysis
Time frame daily
Risk rewards ratio >3.2 👈👈
Target 1.12$
Crv is dropping smoothly after it's powefull pump
You can see that crv is in the two downtrend yellow lines
If crv can break this famous pattern, with a good news in crypto market my analysis will happen

CRV 1D Analysis - Key Triggers Ahead☃️ Welcome to the cryptos winter , I hope you’ve started your day well.
⏰ We’re analyzing CRV on the 1-Day timeframe .
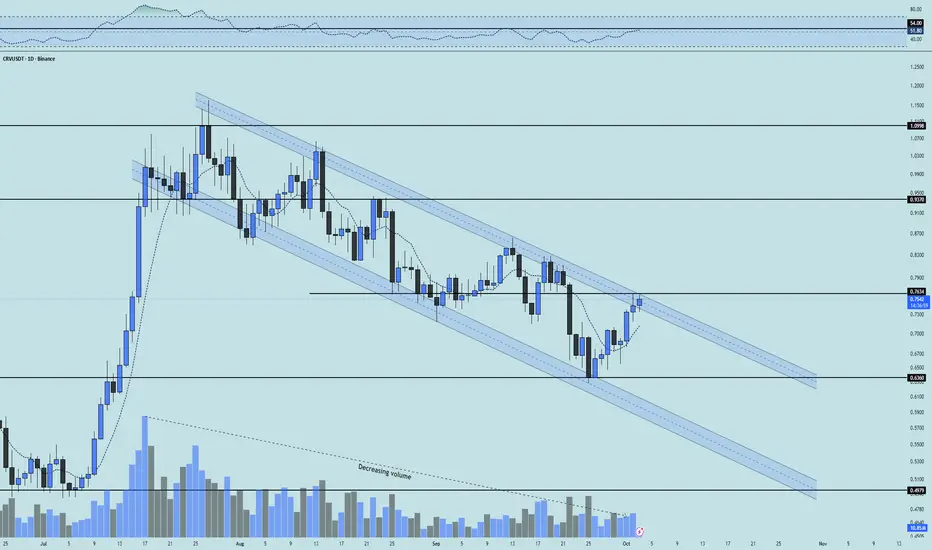
👀 On the daily timeframe for CRV, we can see that after a strong rally, the coin entered a corrective descending channel. Now there are signs of a potential breakout from this channel on this timeframe. If the channel’s upper boundary is broken — which overlaps with the key resistance at 0.7634 — we can say a new bullish trend is starting for this coin. That would mean it’s leaving this compression and correction phase and forming a new upward structure. On the USDT pair, CRV has already managed to build a higher low, and on the BTC pair, it is also gaining momentum for a move. This coin can be added to your watchlist for trading opportunities.
🧮 Looking at the RSI oscillator, after a long period fluctuating below the 50 zone, it is now heading toward its resistance near 54. If RSI pushes through this level, it could break that oscillation resistance and continue higher.
🕯 Since the start of the correction, trading volume has declined, but some long-term holders are still keeping this coin and adding more. These informed buyers may resume accumulation once the descending channel is broken. Pay attention: with an increase in volume, this coin could experience a sharp rally. Recent candles also show stronger buying pressure compared to earlier ones.
💸 On the BINANCE:CRVBTC trading pair, we see a similar descending channel as the USDT pair. If the descending channel breaks on the USDT chart, a similar breakout could occur here, drawing whale attention and fueling a pump with strong growth potential for CRV. A major resistance lies at 629 on this pair; breaking that level would significantly increase the chance of a channel breakout and a strong upward move.
🧠 For trading this coin, a long scenario exists: if the CRV/BTC pair breaks resistance, strong buying volume could flow into CRV. On the USDT pair, if the channel top is broken, with a daily candle close above the prior day’s wick and RSI confirming above 54, a new bullish structure could form for this coin.
❤️ Disclaimer : This analysis is purely based on my personal opinion and I only trade if the stated triggers are activated .

TradeCity Pro | CRV Testing Key Support Zone for Trend Reversal👋 Welcome to TradeCity Pro!
In this analysis, I will be reviewing the CRV coin, one of the popular DEXs, with a market cap of $954 million, currently ranked 81 on CoinMarketCap.
📅 Daily Timeframe
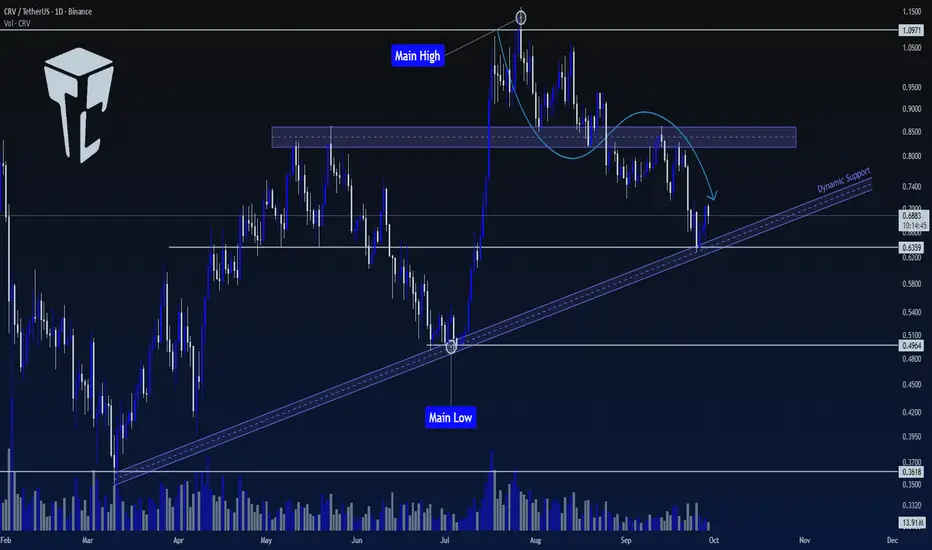
In the daily timeframe, this coin is in an uptrend with a trendline, and the price has currently reached it.
🔍 In higher cycles, the trend of this coin is bullish. However, in lower cycles, after being rejected from 1.0971, a downward movement has started, and it has corrected to the 0.6359 level.
✔️ This level is currently overlapping with the trendline and forms an important support zone.
✨ If this PRZ zone breaks, we can confirm the bearish reversal for CRV, and a short position can be opened. This trigger is one of the first signals for a trend change, and the main trend change will be confirmed after breaking 0.4964.
📈 For a long position, we will have to wait until a proper bullish structure is formed. If the price moves sharply, we will confirm the bullish trend after stabilization above the zone.
❌ Disclaimer ❌
Trading futures is highly risky and dangerous. If you're not an expert, these triggers may not be suitable for you. You should first learn risk and capital management. You can also use the educational content from this channel.
Finally, these triggers reflect my personal opinions on price action, and the market may move completely against this analysis. So, do your own research before opening any position.
TradeCityPro | CRV: Key Support Test in DeFi Token👋 Welcome to TradeCity Pro!
In this analysis, I want to review the CRV coin for you. It is one of the DeFi projects under Ethereum with a market cap of 1.17 billion dollars, currently ranked 72 on CoinMarketCap.
📅 Daily Timeframe
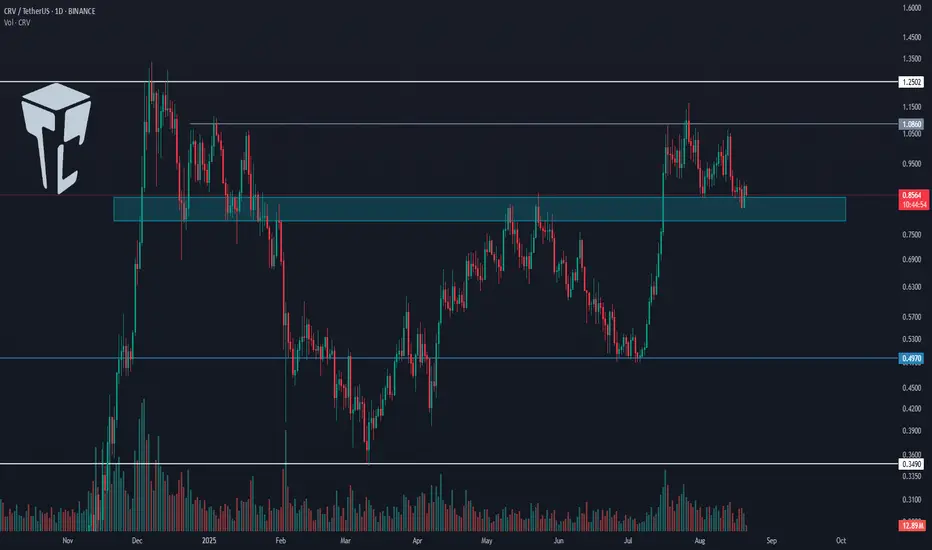
In the daily timeframe, CRV has a very important support zone, and right now the price is trading near this area.
✔️ The overall trend of CRV can currently be considered bullish because the main highs and lows it has formed are higher highs and higher lows, and at the moment, the price is in the corrective phase of this trend.
⚡️ If the support zone is broken, this corrective phase will deepen, and the price could move toward lower levels. The main supports for this coin in the daily timeframe are 0.497 and 0.349.
💥 Considering the ongoing bullish trend, long positions are currently more logical. If CRV gets supported at this zone, we can look for triggers in lower timeframes to open positions.
📈 The main triggers for long positions on this coin are the breakouts of 1.086 and 1.2502.
📝 Final Thoughts
Stay calm, trade wisely, and let's capture the market's best opportunities!
This analysis reflects our opinions and is not financial advice.
Share your thoughts in the comments, and don’t forget to share this analysis with your friends! ❤️
Curve (crv)Crv usdt Daily analysis
Time frame 2hours
Risk rewards ratio >2.3 👌👈
Technical analysis
CRV is caught in a triangle. In similar cases, the price breaks out from the bottom or top of the triangle.And we'll have to wait and see where it comes from.
But why is my analysis a bullish one?
This bullish analysis is solely for the purpose of examining market sentiment.
Given the positive news we hear in the cryptocurrency market and the positive sentiment of buyers in this market, we come to this bullish analysis.
Risk rewards ratio is another good point for this analysis
Ratio 2.3 makes me a brave heart analyzer.
Only by introducing a false selling pressure can this analysis be failed. So , I put my LS in correct place. Of course I know the power of stop hunters.

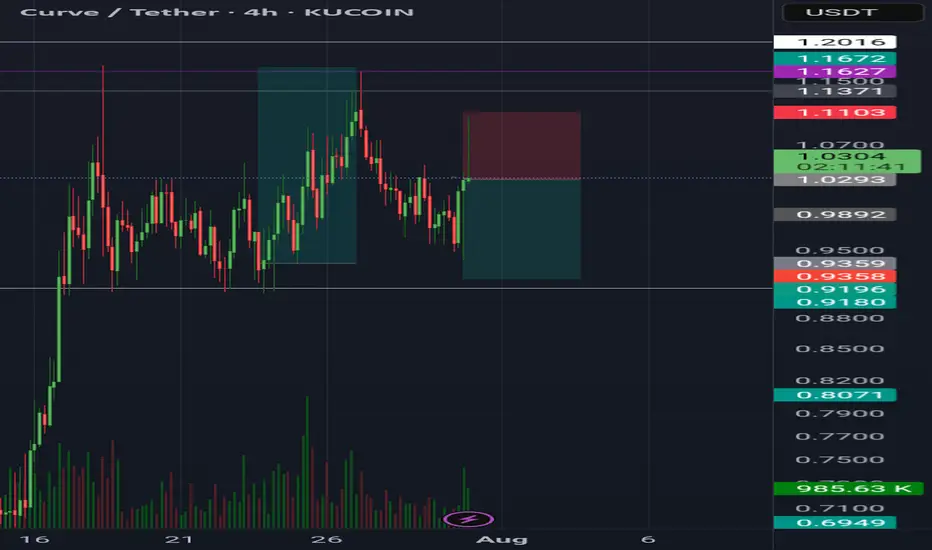
Curve (CRV)Crv usdt Daily analysis
Time frame 4hours
Risk rewards ratio >2.5 👈👌
Target = 0.8$
Moving up and down in the uptrend tunnel

CurveCrv usdt daily analysis
Time frame 4 hours
Risk rewards ratio >1.3
Target 0.92$
Short position because of earthquake in the Russia
Bullish on CRVUSDTCRV has gained massive volume in the last days and therefore now sits on a high volume node. Trading volume and accumulation both went up big. We trade above major EMAs. Everything bullish so far. This bullishness will lead to further growth in the next weeks with very ambitious targets in the very near future. You wont be disappointed!
For more trade ideas check and insights check our profile.
Disclamer: only entertaining purpose, no financial advice - trading is risky.
Curve Enters Bullish Trend (TAC-S7)Curve started dropping in Jan. 2022. The chart doesn't look great at a first glance but there is some positive news.
The downtrend that started in Jan. 2022 ended in August 2024. This date marked the all-time low. After August, there was a higher low in November (2024) and then again a strong higher low in March 2025. That's the good news. The good news is that the market switched from lower lows to higher lows. So, what was then a downtrend can now turn into an uptrend, the next advance and higher high will make it so.
Long-term weekly time frame CRVUSDT is trading above EMA55 and EMA89. Boom. These levels were first conquered in late 2024 then the drop and recovery above this year signals that the bulls are now in control.
So everything is clear in a way, all that is missing is the next bullish wave. This is what we are expecting and this is what is certain to happen next.
As soon as Curve-Tether moves up, producing a high higher than December 2024, this will confirm the change of trend. The first time an uptrend shows on the chart since 2021.
Namaste.

Once Crvusd confirms the invh&s breakout the target is .8737Currently firmly above the neckline of this inverse head and shoulders pattern. Could definitely still find a way back below the neckline but if it does return to the neckline and maintain it as support that is a solid place to go long or add to a position for my own personal strategy. *not financial advice*

Curve (CRV) Structure Analysis (1D)BINANCE:CRVUSDT formed a rounded bottom (cup) and a minor rectangle, and it's currently attempting to break above the local $0.83 resistance.
Key Levels to Watch
• $0.64: Current support and minor rectangle lower boundary
• $0.83: Current resistance, cup and rectangle upper boundary
• $1.00: Measured target from the minor rectangle pattern
• $1.30: Measured target from the cup pattern (within a key supply zone)
Other Important Levels
• $0.20: Key demand zone, and 2024 low
• $0.40-$0.50: Key S/R dating back to November 2022, aligned with the cup bottom
• $1.20-$1.30: Main supply zone, dating back to February 2023
A daily close above $0.83 with volume would confirm the breakout and trigger the targets.

Curve DAO - crvCurve is a DeFi ecosystem consisting of several core products:
Curve DEX is a decentralized exchange best suited for stablecoins and pegged assets that uses an automated market maker (AMM) to manage liquidity.
crvUSD decentralized stablecoin issuance app allows you to borrow stablecoin against secure assets such as ETH and BTC with collateral liquidation protection.

CRVUSDT Long after Liquidity SweepPrice Action & Range:
The price has been in a downtrend, forming a range low and a range high.
There is a clear liquidity curve, showing a gradual decline in price before stabilizing.
The price recently tested the range low, where manipulation occurred (highlighted in grey).
A potential bullish reversal is anticipated, aiming toward the range high.
Key Levels:
Range Low: The lowest price level in the marked range, acting as strong support.
Range High: The highest price level in the marked range, acting as resistance.
Two intermediate target levels are indicated.
Manipulation Zone:
A grey box at the range low signifies market manipulation, likely a stop-hunt or liquidity grab before a move up.
Future Price Projection:
An upward arrow suggests a forecasted price increase toward the range high.
1M Candle Overview:
The right side of the chart includes a monthly (1M) candlestick, showing significant volatility with a large wick.
Summary:
The chart suggests that CRV is currently at a strong support level, and after a manipulation event, the price is expected to rally towards the range high.
The analysis aligns with a liquidity-based trading strategy, aiming to capture the next big move.

Curve DAO CRV price analysis🤑 Did it really happen?) CRYPTOCAP:CRV price has finally “really” come out of the 3-year down trend. A confident breakout, on high volumes, "just like a book says".
💰 Now OKX:CRVUSDT price has hit the mirror level, so we can assume that the correction may be delayed to gain strength to break higher.
A correction in the range of $0.43-0.67 fits into the canons of wave analysis and will not break the structure and growth trend.
And the global 5th wave of growth #Curve DAO token can be expected at least to $4.10-5.50
_____________________
Did you like our analysis? Leave a comment, like, and follow to get more

BTC - Steady... steady... almost there!BTC in the short term is looking very much like a WXYXZ is forming. We should therefore see a low, which could temporarily breach the lower trend line. In fact, it'd make for a bullish signal if it did - so watch this carefully. If we see it ping back within the channel, then the formation will likely complete. Next thing we'll need to look for us the breakthrough of the upper trend line. This would then lead to higher higher and the completion of wave 5 of 1 which we have long been looking for. I'm not going to take any actions here until either trend line is decisively broken leading to a trend change. Looks good though, follow for more.

CRV is looking good for a short term dip and runCRV is looking good for a short term dip in alignment with BTC price action. I will be accumulating CRV on dips as the HTF charts point to larger price appreciation potential.
My first target after the dip is 1.42 and 2.81 and my banana zone target is $10.

CRV Long- It has hit our HTF Sellside Liquidity Target and an all time low.
- Market is in fear mode right now
- Bitcoin dumping
- CRV Stops have been ran.
- We are trading below the Monthly opening which is great for buying if we are bullish

CRV appears to breaking up from double bottom necklineIf you zoom in you can see the previous daily candle closed on the neckline with exact body support and now the current candle is having a nice bullish impulse, which suggests that it could validate the double bottom relatively soon. If it has a few days of correction n this zone it will also form a right shoulder to an inv h&s pattern that would then materialize with a neckline slightly above this double bottom neckline as I hypothesized my previous curve idea which I will provide a link to below. That inv h&s pattern would then have a slightly higher breakout target than this double bottom will should it materialize. For now the double bottom is the one to focus on as it seems very close to validating. Curve is likely overextended at this point so it could easily go back and forth on the neckline here before the real lift off. *not financial advice*

Is #CRVUSDT About to Explode? Here’s Why You Can’t Afford to MisYello, Paradisers! Are you prepared for what could be a massive game-changer in the market? Let’s dive into our latest analysis of #CRVUSDT and see what’s brewing!
💎#CRVUSDT is hovering around a critical support zone at $0.2944, showing strong potential for a bullish continuation We’ve been closely monitoring #CURVE as it follows a falling wedge pattern, and after a perfect breakout, it has successfully completed a retest of the descending resistance signals that the bulls might be gearing up for action. The next key level to watch? The internal minor resistance at $0.5249.
💎If #CRV can hold its ground at this level, we could witness a significant bullish rally, echoing previous major market moves. A decisive breakout above the crucial $0.5249 resistance could set the stage for a surge toward even higher resistance zones.
💎But remember, caution is key. If momentum fades at this critical juncture, a pullback to the lower demand area around $0.2431 is on the table. A daily close below this level could invalidate the bullish outlook and lead to further declines.
💎Stay sharp and keep a close eye on the price action. The next move could define the trajectory of #CRVUSDT in the coming days.
Stay focused, patient, and disciplined Paradisers.
MyCryptoParadise
iFeel the success🌴

CRV built a burj khaifa on its goldencrossCRV easily could just keep going parabolically vertical here but this would also be a very nice place to catch its breath and attempt to complete the right shoulder to an inv h&s pattern. Just in case I will be watching this trendline to see if it can break above it in the next few candles or not *not financial advice*

Curve DAO (CRV)Curve Finance is an Automated Market Maker based Decentralized Exchange (DEX) that focuses on allowing users to swap between assets that have very similar underlying value at the lowest slippage.
Anyway, it seems CRV is oscillating in a wide sideways channel. Currently, CRV is at the bottom of this channel, a good place for both spot and future traders to consider. Let's see what happens.
