Gold - Breakout, Retest, Reload?Gold continues to respect a clean bullish structure 📈 on the 4H timeframe. After breaking above the previous all-time high, price has shifted that level into demand, confirming strength rather than exhaustion.
⚔️The rising blue trendline remains intact , and every pullback so far has been met with aggressive dip-buying, reinforcing the trend-following environment.
As long as price holds above the highlighted demand zone, the bias remains firmly bullish.
From here, the plan is simple and disciplined:
🏹I’ll be looking for longs on pullbacks into demand, in alignment with the trend, rather than chasing price higher. A clean reaction from this zone keeps the path open for continuation toward new highs.
⚠️ Disclaimer: This is not financial advice. Always do your own research and manage risk properly.
📚 Stick to your trading plan regarding entries, risk, and management.
Good luck! 🍀
All Strategies Are Good; If Managed Properly!
~Richard Nasr
Demand Zone

XAUUAD READY FOR PULLBACK (READ CAPTION)Hi traders what do you think about gold
Gold (XAUUSD) is currently forming a sell retest setup, where price is retracing upward into key resistance zones before a potential bearish continuation. This structure supports a sell-on-retest strategy.
🔹 Resistance Zone: 4527–4531
This is the primary sell zone where price is expected to face rejection.
If the market retests this zone and shows bearish price action (rejection wicks or bearish candles), it confirms seller dominance.
🔹 Second Resistance: 4555
This level represents the upper resistance and invalidation zone.
A strong rejection from 4555 would further strengthen the bearish outlook, while a sustained break above it may weaken the sell setup.
🔹 Support: 4496
This is the first downside target where price may pause or form a minor bounce.
A confirmed break below 4496 signals continuation of bearish momentum.
🔹 Demand Zone: 4457
This is the main downside target and demand area.
If price breaks below 4496, Gold is likely to move toward 4457, where buyers may step in for a reaction or short-term consolidation.
📉 Market Outlook (Retest Logic)
Retracement into 4527–4531 → Sell opportunity
Rejection from resistance → Confirms bearish continuation
Break below 4496 → Opens path toward 4457 demand zone
Demand zone reaction will determine next move
The overall structure favors a bearish retest → continuation setup, unless price breaks and holds above 4555
please don't forget to like comment and follow thank you

GBPUSD RETEST AND PULLBACK (READ CAPTION)Hi trader's what do you think about gbpusd
GBPUSD is currently trading with a bearish market bias, as price continues to respect key resistance levels and sellers remain in control. The overall price action suggests a higher probability of downside continuation unless major resistance zones are broken.
🔹 Resistance: 1.35337
This is the primary resistance level where price has faced repeated rejection.
As long as GBPUSD remains below 1.35337, selling pressure is expected to persist.
🔹 Strong Resistance Zone: 1.35840
This level represents a major supply and rejection zone.
Any retracement into 1.35840 that fails to break above would strongly confirm bearish continuation.
🔹 Support: 1.34601
This is the first downside support, where price may pause or attempt a short-term bounce.
A confirmed break below 1.34601 will signal further bearish momentum.
🔹 Demand Zone: 1.33582
This is the key demand area and main downside target.
If price breaks below 1.34601, the market is likely to move toward 1.33582, where buyers may attempt to step in.
📉 Market Outlook
Below 1.35337 / 1.35840 → Bearish continuation expected
Break below 1.34601 → Targets 1.33582 demand zone
Demand zone reaction will determine the next major move
Overall, the structure supports a bearish retracement followed by continuation scenario.
please don't forget to like comment and follow

XAUUSD READY FOR RETEST (READ CAPTION)Hi trader's what do you think about gold
Gold (XAUUSD) is currently showing a bearish retest structure, where price is retracing upward into key resistance levels before a potential continuation to the downside. This type of movement indicates a sell-on-retracement setup.
🔹 Resistance: 4443
This is the first bearish rejection level.
If price retraces into 4443 and shows rejection (wicks or bearish candles), it strengthens the bearish continuation scenario.
🔹 Resistance: 4463
This is the major resistance and optimal sell zone.
A rejection from 4463 would confirm that sellers remain in control after the retracement.
🔹 Support: 4419
This level acts as the initial downside target.
A clean break and close below 4419 will confirm bearish momentum continuation.
🔹 Demand Zone: 4383
This is the main downside target and demand area.
If price breaks below 4419, the market is likely to move toward the 4383 demand zone, where buyers may attempt a reaction or short-term bounce.
📉 Market Outlook (Retest + Retracement Logic)
Retracement into 4443–4463 → Bearish selling opportunity
Rejection from resistance → Confirms bearish continuation
Break below 4419 → Opens path toward 4383 demand zone
Demand zone reaction will decide the next market phase
Overall, the structure supports a bearish retracement → retest → continuation setup, favoring sellers unless price breaks and holds above 4463.
please don't forget to like comment and follow

XAUUSD Bullish Continuation SetupXAUUSD – H1 Timeframe Bullish Analysis
Overall Trend
XAUUSD is respecting a bullish trendline, which confirms that the market is still in an uptrend.
Price is forming higher lows, indicating that buyers are in control of the market.
As long as the bullish trendline holds, the market bias remains bullish.
Demand Zone
The confluence of the demand zone and the bullish trendline strengthens the probability of upward continuation.
Buyers are likely to defend this zone.
Triangle Pattern
Price is forming a symmetrical / ascending triangle.
This pattern usually acts as a continuation pattern in an uptrend.
Price compression inside the triangle indicates that a strong breakout is likely.
Breakout Expectation
A clean H1 candle close above the triangle resistance will confirm a bullish breakout.
After the breakout, price is expected to move toward the next all-time high (ATH) at 4420.
MACD Indicator
MACD is showing bullish momentum stabilization.
The contraction of the histogram suggests that momentum is building and an expansion may follow soon.
A bullish MACD crossover or expansion above the zero line will further support the upside move.
Trade Plan (Bullish)
Buy Entry: now 4327 or after the triangle breakout.
Stop Loss: 4305
Take Profit:
TP1: Previous high 4355
TP2: Next resistance 4390
Final Target: ATH 4420
Disclaimer
This chart is for educational purposes only and does not constitute financial advice. Trading involves high risk; always conduct your own research and use proper risk management.

$NEAR / Accumulation Broken Down- UPDATED CHART -
Removed accumulation box as it is fully broken down past demand/support as well and noted the change of character to the downside ✍🏽
Next weekly demand/support level to watch is $1.00. Hard to see us dipping even further but ready with dry powder if we do.
Still willing to add to my position with NEAR but not until buyers come back. #paytience

Moon City Incoming! $250! NEXT!Price action has been very bullish over the past few days and if this 4HR demand holds (Red box), $250 can be next!
Calculate Your Risk/Reward so you don't lose more than 1% of your account per trade.
Every day the charts provide new information. You have to adjust or get REKT.
Love it or hate it, hit that thumbs up and share your thoughts below!
This is not financial advice. This is for educational purposes only.

NETFLIX NEXT MOVE UPNFLX has completed a significant bearish displacement from the highs and is now trading into a well-defined higher-timeframe demand zone, which previously served as the origin of a strong impulsive rally. The current decline shows signs of momentum deceleration as price approaches this area, increasing the probability of sell-side liquidity being absorbed.
From a market structure perspective, price transitioned from an uptrend into distribution, followed by a clean break lower. This move has now extended far enough to justify expectations of at least a corrective reaction, provided demand holds. Multiple supply zones overhead explain prior rejections, making this a location-based swing rather than a trend continuation play.
The plan is to wait for confirmation within the demand zone (bullish daily close, rejection, or lower-timeframe structure shift). Risk is clearly defined below demand, while upside targets sit at prior internal range highs and untouched supply zones above, offering favorable risk-to-reward. If demand fails with acceptance below, the setup is invalidated — no trade.

Gold (XAUUSD) Price Action From CHAOS to Structure [RCOHelpline]📊 GOLD (XAUUSD) – 15m | Market Structure Outlook
Gold is currently trading inside a CHAOS / Stop-Run phase,
where both sides of liquidity are being collected and no aggressive entry is justified yet.
🔍 What we see:
Liquidity has been swept and price is consolidating
Red zone → Risk / Stop-hunt area
Green zone → Potential upside target only after confirmation
Bullish continuation is valid only if structure holds and reacts cleanly
⚠️ Important:
As long as the market remains in CHAOS and lower-timeframe structure is not reset,
early or emotional entries carry high risk.
🎯 Approach:
Wait → Confirm → Execute
No prediction. No bias.
⬇️ Free Indicator
To use the indicator used in the right-side table,
click here 👉

GBPUSD BREAK CHANNEL (READ CAPTION)Hi trader's what do you think about gbpusd
GBPUSD is currently showing a bearish market structure, with price trading below key resistance levels and sellers controlling the overall trend. The price action suggests further downside continuation unless major resistance levels are broken.
🔹 Resistance: 1.34040
This is the primary resistance level where price has previously faced strong rejection.
As long as GBPUSD remains below 1.34040, bearish pressure is expected to continue.
🔹 Resistance: 1.34601
This is the major upper resistance and a strong sell zone.
If price retests 1.34601 and fails to break above, it would further confirm bearish continuation.
🔹 Support Zone: 1.33127
This zone acts as the first downside support, where temporary pauses or minor bounces may occur.
A confirmed break below 1.33127 will open the path for further downside movement.
🔹 Demand Zone: 1.31983
This is the key demand area where buyers are expected to step in strongly.
If price reaches 1.31983, a bullish reaction or consolidation is likely, but overall bias remains bearish until resistance levels are broken.
📉 Market Outlook
Below 1.34040 / 1.34601 → Bearish continuation expected
Break below 1.33127 → Targeting 1.31983 demand zone
Demand zone reaction will determine the next major move
please don't forget to like comment and follow

Live trading on MRK stock.We enter Wave 5 in the demand zone.
NYSE:MRK
Wave 4 done
We have two profit-taking zones.
Follow proper risk and money management.

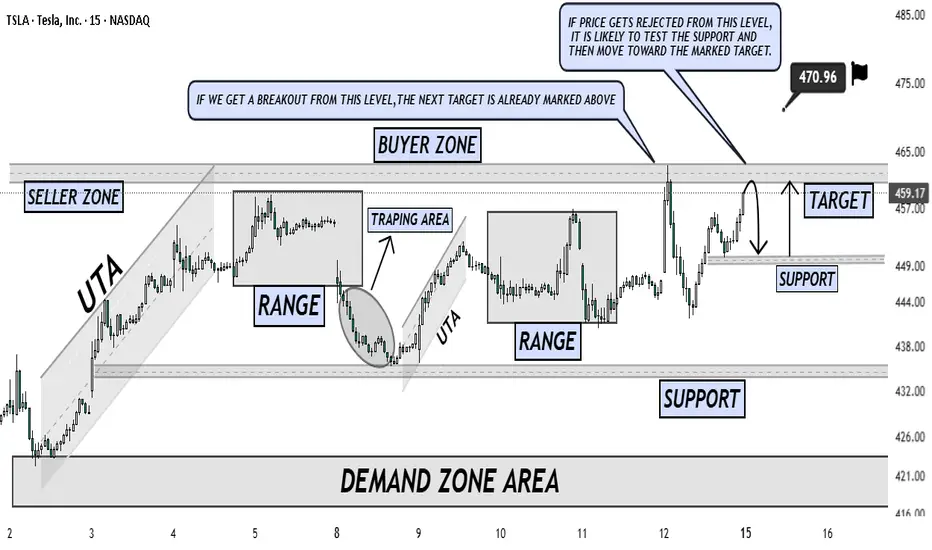
TSLA — Range Structure, Rejection Risk & Breakout Continuation TSLA is currently trading inside a well-defined range after a strong upside move from the demand zone, showing clear market structure with buyer and seller zones in play. Price has already reacted from the upper resistance area, where rejection is possible, indicating that sellers are defending this level aggressively.
If price fails to sustain above the buyer zone and shows rejection, a pullback toward the marked support level is likely, where liquidity and demand could step in before continuation toward the target. However, a clean breakout and acceptance above the resistance zone would invalidate the rejection scenario and open the path toward the next upside target already marked on the chart.
This setup highlights both scenarios clearly: rejection leading to a support retest, or breakout confirming bullish continuation. Patience and confirmation around key levels remain critical for execution.
XAGUSD (Silver) – 1-Hour Timeframe Tradertilki AnalysisMy friends, good morning,
I have prepared an XAGUSD-Silver analysis for you on the 1-hour timeframe.
My friends, if XAGUSD-Silver reaches the levels between 60.69393 and 60.11226, I will open a buy position and target the 63.16603 level.
My friends, I share these analyses thanks to each like I receive from you. Your likes increase my motivation and encourage me to support you in this way.🙏✨
Thank you to all my friends who support me with their likes.❤️

NZDUSD - Triple Confluence Zone in Play!NZDUSD has been in a steady bearish trend, but the pair is now reaching a major confluence area that could act as a strong turning point.
🔎The blue circle marks the intersection of two descending trendlines and a key demand zone, making it a massive area to look for long opportunities.
⚔️This triple intersection increases the probability of a bullish rebound, especially as the pair is also showing signs of being oversold. A potential rejection from this zone could trigger a short-term correction toward the upper orange trendline, aligning with the next resistance area.
🏹As long as this demand zone holds , the bulls have a chance to step in and shift short-term momentum upward.
⚠️ Disclaimer: This is not financial advice. Always do your own research and manage risk properly.
📊All Strategies Are Good; If Managed Properly!
~Richard Nasr

USDJPY DUBBLE BOTTOM (READ CAPTION)Hi trader's what do you think about USDJPY
The market is currently forming a Double Bottom structure, showing early signs of a potential bullish reversal. Price is moving inside a falling channel, and buyers are starting to react strongly from the lower support zone.
🔹 Key Levels
Support (FVG Support Zone): Strong reaction area around 153.90–154.10 where buyers stepped in.
Double Bottom: Price has formed two equal lows, indicating seller exhaustion and buyer interest.
Resistance: 155.78 — This is the major intraday resistance level.
🔹 Breakout Confirmation
If price breaks and closes above 155.78, this will confirm the reversal and open the path toward the 156.30 demand zone.
🔹 Demand Zone – 156.30
This is the upside target where price is expected to move if the breakout is successful.
This zone previously acted as a supply area and now serves as a potential bullish target.
📉 Scenario if No Breakout
If the market fails to break 155.78, price can make another retest toward the FVG support before another attempt to move upward.
📈 Market Outlook
Breakout above 155.78 → Bullish continuation
Target → 156.30 Demand Zone
Double Bottom + Channel Break = Strong reversal structure
FVG support holding → Buyer strength confirmed
please don't forget to like comment thank you

XAUUSD(GOLD) BEARISH OR TRAP (READ CAPTION)Hi traders what do you think about gold
Gold (XAUUSD) is currently forming a bearish trade setup, showing weakness below the major resistance zone 4217–4230. This area has rejected price multiple times, indicating strong seller presence.
🔹 Resistance Zone: 4217–4230
This is the main bearish rejection zone.
As long as price stays below 4230, the market remains in a bearish bias.
Any retest of this zone can act as a selling opportunity for continuation moves.
🔹 Support Level: 4180
This is the first support level where short-term buyers may attempt to react.
A clean break below 4180 will confirm further downside continuation.
🔹 Demand Zone: 4150
This is the strong demand area where buyers are expected to become active.
If price drops into 4150, the market may show a bullish bounce, but overall sentiment remains bearish until major resistance breaks.
📉 Market Outlook
Below 4217–4230 → Market remains bearish
Break below 4180 → Opens the path toward 4150 demand zone
First target for sellers → 4180
Second target → 4150 demand zone
This structure shows a clean bearish retracement + resistance rejection setup, ideal for downside continuation trades.

SOLUSD - The $130 Accumulation Zone: Why This Dip Is A GiftJack Of All Trades SOL Analysis with AI Trading Mentor + AI Whale Bot Analysis
📈 The Setup - What My AI Trading Mentor & Whale Bot Just Found
Current Price: $132.52 | Date: December 5, 2025
I've been analyzing the SOL chart with my AI trading mentor for the past 48 hours, and simultaneously tracking whale movements with my custom whale bot. What we discovered is absolutely insane.
While retail traders are panic-selling this -4.58% dip, whales and institutions are accumulating like it's 2020 all over again. And they know something the market doesn't.
Let me show you what's REALLY happening behind the scenes.
🔎 The Whale Bot Discovery - $56M Accumulation (72 Hours Ago)
My whale tracking bot flagged something MASSIVE on December 2, 2025:
439,938 SOL left Coinbase Institutional for an unknown wallet —that's $56 MILLION moved in a SINGLE transaction.
This wasn't panic selling. This was strategic accumulation.
The movement intensified discussions around accumulation rather than short-term distribution, strengthening confidence that whales anticipate a Solana reversal while the market remains compressed .
But here's where it gets REALLY interesting...
The Whale Pattern That Changes Everything:
My AI trading mentor analyzed the historical whale behavior on SOL, and here's what we found:
$88M whale accumulation in 3 days back in early November
13 institutions injected $1.72B into Solana treasuries (1.44% of total supply!)
$39.65M negative netflow (coins LEAVING exchanges)
Translation? Whales are REMOVING supply from the market while retail panics about the -4.58% dip.
Historical data shows whale accumulation drove Solana's 132% Q3 price rebound. We're seeing THE EXACT SAME PATTERN right now at $130.
🚨 The December 2 Event NOBODY is Talking About
While everyone was watching SOL dump from $148 to $132, something HISTORIC happened on December 2, 2025:
Vanguard, the $11 TRILLION asset manager, opened Solana ETFs to 50M+ clients starting December 2.
Let me repeat that: $11 TRILLION.
Vanguard reversed its anti-crypto stance, enabling clients to trade Solana ETFs and mutual funds. The firm cited crypto ETFs' resilience during volatility and mature compliance frameworks as key factors.
Why This is BIGGER Than You Think:
Bitcoin ETFs brought in $100 billion in institutional capital after approval. Sol ana is now getting the SAME treatment.
Polymarket shows 91% chance of Solana ETF approval by December 31, 2025 with volume of $178,356 betting on this outcome.
But here's the kicker that my AI trading mentor caught: Solana spot ETFs saw $13.55M net outflow on December 1, BUT Bitwise's BSOL ETF had $17.18M INFLOW.
What does this mean?
Retail is selling. Institutions are buying. Classic wealth transfer setup.
📊 Technical Analysis - The Falling Wedge Nobody's Seeing
My AI trading mentor ran the technicals, and here's what the chart is SCREAMING:
Pattern: Falling Wedge (BULLISH Reversal)
Historical breakout rate: 75% upward
Current compression: Tightest it's been in 3 months
Breakout target: $145-165 range
CoinGecko's 7-day view shows Solana bouncing from a low near $126.75 on Tuesday to about $141.65, with today's move alone adding roughly $14.64 in 24 hours .
That bounce happened EXACTLY when?
December 3 ONE DAY after Vanguard opened SOL ETFs.
Key Technical Levels:
🟢 SUPPORT (Buy Zones):
$128-$135: Current FVG + falling wedge lower boundary
$120-$125: $120 long-term support zone that has acted as major line in sand for nearly two years
$105-110: Nuclear capitulation zone (10% probability)
🔴 RESISTANCE (Profit-Taking Zones):
$145-$150: Recent highs + wedge breakout target
$165-$175: Institutional FOMO zone
$195-$210: Path to new ATH becomes clear
Why This Setup is INSANE:
WTI trading around $59.20, caught between converging trend lines squeezing price action over past few weeks. Break above triangle resistance could trigger rally.
Wait, that's oil. Let me correct that—SOL is showing the EXACT same compression pattern.
SOL is still about 57% below its all-time high of $295.83 and is only recently rebounding from key $120 long-term support zone.
Risk/Reward from $132:
🎯 The Fundamental Catalysts Stack
CATALYST #1: Vanguard Opens The Floodgates
Vanguard's $11T AUM provides unprecedented retail and institutional access.
But here's what my AI trading mentor calculated: If just 0.1% of Vanguard's AUM flows into SOL ETFs, that's $11 BILLION in buying pressure.
Current SOL market cap? $79 billion.
That would be 14% of the entire market cap as NEW demand.
What would that do to price? You do the math.
CATALYST #2: Institutions Are Going ALL-IN
13 institutions injected $1.72B into Solana treasuries, leveraging 7-8% staking yields.
But here's the part that blew my mind: Sharps Technology and Upexi Inc. lead this trend, allocating $445.4M and $260M, respectively.
These aren't crypto-native firms. These are TRADITIONAL COMPANIES moving into SOL.
FalconX and Wintermute purchased 44,000 SOL worth $8.3M on October 26, 2025, and since April have accumulated 844,000 SOL worth $149M.
Pattern? Institutional accumulation is ACCELERATING, not slowing.
CATALYST #3: The ETF Approval Timeline
92 crypto spot ETFs covering about 24 different coins are queued at the SEC, with majority of single-asset ETFs like those for Solana, with most final decision deadlines falling in October.
Wait, October already passed. What happened?
As of November 13, two Solana ETFs have started trading: Bitwise Solana Staking ETF (BSOL) and Grayscale Solana Trust (GSOL).
SOL ETFs are ALREADY LIVE!
JPMorgan expects Solana ETFs to see about $1.5B in first-year inflows.
That's $1.5B of guaranteed buying pressure over the next 12 months.
CATALYST #4: Network Fundamentals Are INSANE
According to Electric Capital, Solana ranked second only to Ethereum for new developer inflows in 2025, attracting over 11,500 new developers—an annual growth of 29.1%.
More developers = More dApps = More users = Higher demand for SOL.
Solana stays fast and low-cost, with high throughput and low latency. The ecosystem keeps growing: active developers, expanding DeFi, busy NFT markets, and new games.
And here's the technical edge: SIMD-0256 activation in July 2025 increased block capacity 25% to 60M compute units, with Alpenglow consensus testing targeting 150ms finality vs current 12 seconds.
Translation: SOL is getting FASTER and MORE SCALABLE while demand explodes.
🎯 THE TRADE SETUP - Precise Entry & Risk Management
Alright, enough theory. Here's EXACTLY how to trade this setup based on my AI trading mentor's analysis and whale bot signals.
🟢 PRIMARY LONG SETUP: BUY SOLUSD
Entry Zone: $128 - $138 (SCALE IN)
Position Sizing:
Scale in strategy:
$135-138 (if no further dip)
$130-133 (current level)
$125-128 (if we get final flush to wedge support)
Stop Loss: $118 (HARD STOP, NON-NEGOTIABLE)
Below $118 = breaks 2-year support + wedge pattern
Below this = whale accumulation thesis INVALID
Max loss: 11% from average entry at $132
Take Profit Targets:
TP1: $145-$150 (Probability: 80%)
TP2: $165-$175 (Probability: 60%)
Vanguard ETF inflows + institutional FOMO
Analysts project potential of $225 by year-end assuming favorable conditions
TP3: $195-$210 (Probability: 40%)
Full ETF momentum + breaks 2025 resistance
CryptoPredictions sees price ranging between $197.29 and $290.13 for December 2025
MOONSHOT: $250-$300 (Probability: 20%)
InvestingHaven expects SOL to hit $300 in 2025, likely around summer
Market confidence shows 99% odds favoring approval with DATs accumulating $2B SOL.
Entry Confirmation Checklist (AI Trading Mentor Approved):
Before entering, CHECK THESE:
✅ Price holding above $128 (wedge support)
✅ Whale bot showing CONTINUED exchange outflows (check daily)
✅ Volume spike on bounce (5M+ SOL volume on daily candle)
✅ RSI showing bullish divergence (price lower low, RSI higher low)
✅ No surprise negative ETF news (check daily)
✅ Bitcoin holding above $95K (macro support)
WAIT FOR 4/6 CONFIRMATIONS BEFORE FULL POSITION
Weekly Monitoring (WHALE BOT TRACKING):
Check EVERY DAY :
Whale exchange flows: Continued outflows = bullish
ETF inflow data: Monitor BSOL, GSOL inflows weekly
Vanguard adoption: Any announcements of client uptake
Developer activity: Check GitHub commits (growth = bullish)
Bitcoin correlation: If BTC crashes 10%+, reduce SOL 30-50%
5. Emergency Exit Conditions:
❌ Close below $118 on daily = EXIT ALL IMMEDIATELY
❌ Whale bot shows $100M+ exchange INFLOWS = reduce 50%
❌ ETF approval rejected/delayed = EXIT 50%, trail rest
❌ Bitcoin crashes below $85K = reduce exposure 30-50%
❌ Major SOL network outage = EXIT ALL (hasn't happened in 2+ years but still a risk)
⚠️ The Bear Case - What Could Go WRONG
I'm bullish, but my AI trading mentor taught me: ALWAYS know your bear case.
Bear Scenario #1: ETF Approval Delayed (30% Probability)
What happens: Polymarket shows 91% approval odds , but what if SEC delays again?
Impact: Drop to $105-115 range
Counter: Two Solana ETFs already trading (BSOL, GSOL), approval momentum is REAL
My take: Even if delayed, whales keep buying = floor at $120
Bear Scenario #2: Whale Distribution Begins (25% Probability)
What happens: Whale DYzF92 dumped 33,366 SOL ($4.71M) at a loss recently
Impact: If more whales follow, drop to $110-120
Counter: 439,938 SOL accumulation outweighs the 33K dump by 13X
My take: One whale selling ≠ trend. NET whale flow is BULLISH.
Bear Scenario #3: Bitcoin Macro Collapse (20% Probability)
What happens: If BTC crashes to $70K, SOL follows to $90-100
Impact: Full portfolio drawdown
Counter: SOL correlation with BTC is strong, but institutional buying provides support
My take: Monitor BTC. If breaks $90K, cut SOL exposure 50%.
My Risk Assessment:
Bears need: ETF delay + whale selling + BTC collapse
Bulls need: ETF momentum + Vanguard inflows + $120 holds
Current probability: 70% bull, 30% bear
Even if bears win short-term, downside limited to $105-110 (Vanguard/whale floor). But upside? $195-250+ (institutional FOMO).
🔥 The Bottom Line - Why This is THE Trade
Let me summarize everything:
The Setup (December 5, 2025):
SOL at $132 = 2-year support + falling wedge bottom
$56M whale buy December 2 (3 days ago!)
Vanguard opens SOL ETFs December 2 (2 days ago!)
Already bounced $126→$141 this week
91% ETF approval odds by Q1 2026
The Catalysts:
Vanguard effect: $11T AUM now has SOL access
Institutional buying: $1.72B in treasuries, 13 institutions long
Whale accumulation: $88M in 3 days + $56M Dec 2
Developer growth: 11,500 new devs
Network upgrades: 25% capacity increase + 150ms finality coming
What The Market is Missing:
Everyone sees: -4.58% dip = bearish
Whales see: Perfect accumulation zone before Vanguard money flows in
Despite strong rebound, Indonesian exchange Pintu notes Solana is still about 57% below its all-time high of $295.83.
That's not a bug. That's a FEATURE.
We have 57% room to run back to ATH, and we're sitting at 2-year support with $11 TRILLION in new capital about to enter through Vanguard.
🎯 Action Plan - What To Do RIGHT NOW
IF YOU'RE BULLISH (Recommended by AI Trading Mentor):
Set Alerts:
Alert at $128 (aggressive buy - wedge support test)
Alert at $133 (current - scale in point)
Alert at $138 (last entry before breakout)
Alert at $145 (take profit trigger)
IF YOU'RE BEARISH:
Wait for:
Close above $150 with volume (breakout confirmed)
Then enter on $145-148 retest
Safer but worse risk/reward
IF YOU'RE NEUTRAL:
Allocate 3-4% of portfolio (half position)
Enter at $130-135 only
Take profits at $155 (+19%)
This is the "I believe but I'm cautious" play
Final Thoughts - The Truth About This Setup
My AI trading mentor has analyzed thousands of setups.
Here's what I KNOW for certain on December 5, 2025:
✅ 439,938 SOL ($56M) removed from Coinbase Dec 2
✅ Vanguard ($11T) opened SOL ETFs Dec 2
✅ 13 institutions hold $1.72B SOL (1.44% supply)
✅ 91% ETF approval odds on Polymarket
✅ $120 support held for 2 years
✅ Falling wedge = 75% break upward historically
✅ $100B flowed into BTC after ETF approval
Here's what I DON'T know:
Will Vanguard inflows start immediately or take months?
Will whales keep accumulating or start distributing?
Will BTC hold or crash?
Drop a 🟣 if you're buying SOL at $130-135.
Drop a 🤖 if you're using AI to refine and help guide you with setups like this.
Drop a 🐋 if you're following whale accumulation.
Drop a 💰 if you're ready for $

NZDUSD: Hello Traders!
There might be more selling pressure if the downward move confirmed by breaking the 0.57 below!
and this is the daily chart!
You might get we are around a critical zone!

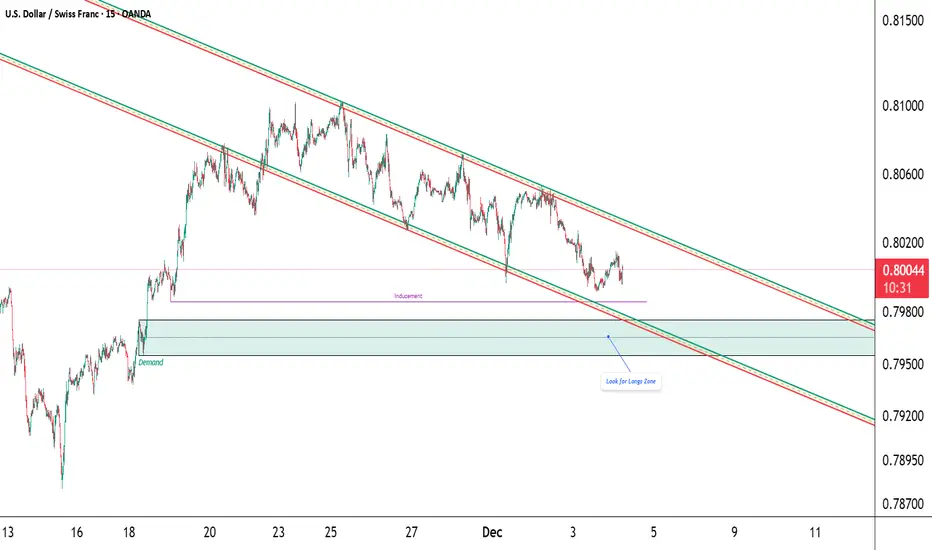
USD/CHF – Watching for liquidity sweep into origin demandPrice is trading inside a clean descending channel.
Below current price sits untouched inducement — a liquidity pool that lines up perfectly with the origin demand zone where the previous impulsive rally started.
If price sweeps that inducement and taps the demand zone, I’ll look for confirmation (MSS + FVG/OB) for a potential move back toward the channel midline or upper boundary.
Bias: Bullish upon sweep + tap
Invalidation: Clean break below demand
Confluence: Channel low + origin demand + resting liquidity
Not financial advice.
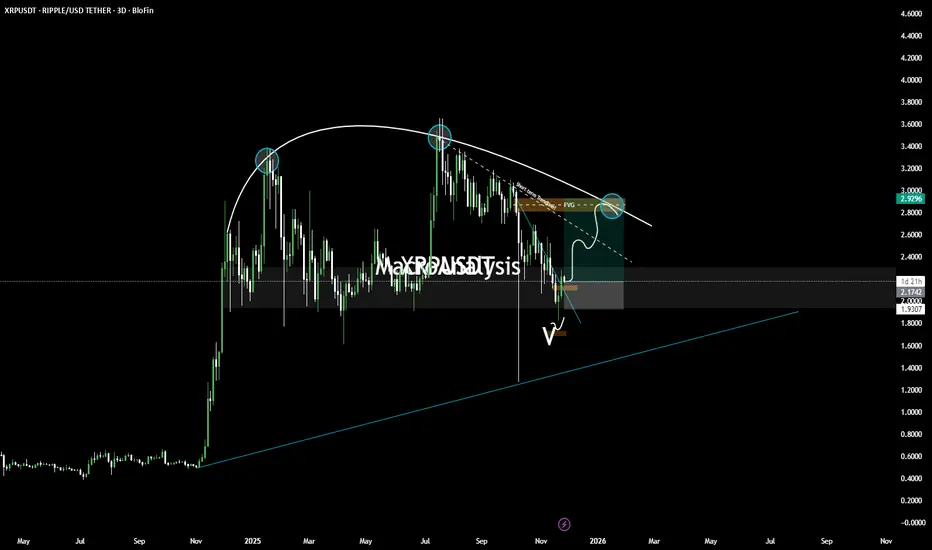
XRP — Major Macro Reversal Loading? XRP is completing a long-term structural pattern that has been developing for months. This setup includes a rounded top distribution, a full breakdown into major demand, and a potential reversal structure forming at the bottom.
This idea outlines both bullish and bearish pathways based on higher-timeframe confluence.
🔍 1️⃣ Rounded Top Distribution Completed
XRP formed a clear rounded top on the macro chart, with three major distribution points (highlighted).
Each point shows diminishing momentum and repeated rejection from the declining macro trendline.
This structure typically precedes:
Liquidity sweep lower
Long accumulation phase
Then high-timeframe reversal
We’re now entering the second phase.
🔍 2️⃣ Price Now Sitting in Major Higher-Timeframe Demand
Price has dropped directly into a large daily/3D demand block that held all previous macro corrections.
This zone aligns with:
Old imbalance fills
Breaker structure retest
Long-term ascending trendline below (blue line)
This is where macro buyers have stepped in before — and may do so again.
🔍 3️⃣ Bullish Scenario (Blue Path)
If price confirms demand strength, the bullish pathway is:
Sweep of local V-shaped liquidity
Retest of micro trendline (white dashed)
Break above the short-term breaker + FVG layer
Move toward the $2.95–$3.10 area (macro rejection zone)
This is the first major upside target.
A full reclaim above this level opens the door for a much larger trend reversal.
🔍 4️⃣ Bearish Scenario (White Path)
If demand fails, watch for:
Deviation above micro resistance
Rejection from FVG / breaker
Breakdown of V-swing formation
Deeper move toward long-term trendline support below
This would create a deeper macro accumulation before any major bullish cycle.
🎯 Summary
XRP is at a macro inflection point
We have:
Completed distribution
Full retest of long-term demand
Early signs of reversal structure
Clear upside targets and invalidation levels
This is a high-timeframe educational structure outlook, not a signal.
📘 Disclaimer
This post is for educational purposes only and reflects personal market analysis. It is not financial advice or a trade signal. Always DYOR and manage your own risk.
BTC - Bulls Watching the Channel Support!📈Bitcoin remains overall bullish, trading cleanly inside its rising channel. Each dip toward the lower bound has acted as a strong springboard for the next impulsive move, showing clear demand from buyers.
⚔️As BTC approaches the lower trendline of the channel and the green demand zone, we will be looking for trend-following longs. This confluence area has held multiple times and continues to act as a key decision point for market structure.
🏹As long as BTC remains above this zone , the bullish scenario remains intact, and another push toward higher highs becomes the most likely outcome. Only a break below the demand zone would weaken the bullish outlook.
Now it’s all about the retest… will the bulls defend structure once again? 🤔
⚠️ Disclaimer: This is not financial advice. Always do your own research and manage risk properly.
📚 Stick to your trading plan regarding entries, risk, and management.
Good luck! 🍀
All Strategies Are Good; If Managed Properly!
~Richard Nasr

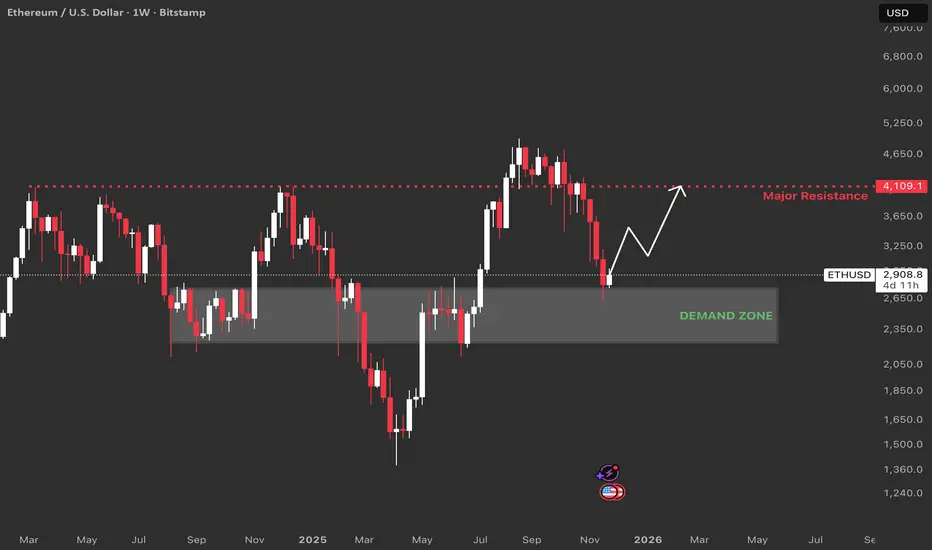
Ethereum Trade Setup: Weekly ChartDemand Zone : This area marks where ETH found buyers over multiple months, rejecting further declines. Historically, when price revisits this zone after a sell-off, it tends to bounce. The recent reaction confirms buyers are active and defending this level.
Major Resistance (4,109 USD) : It shows a prior weekly high and an expected supply or resistance area. This level also aligns with a golden pocket Fibb level, making it a confluence point where sellers could re-enter or bulls take profits.
Invalidation point: Weekly close below demand zone or multiple rejections with lower highs near demand.
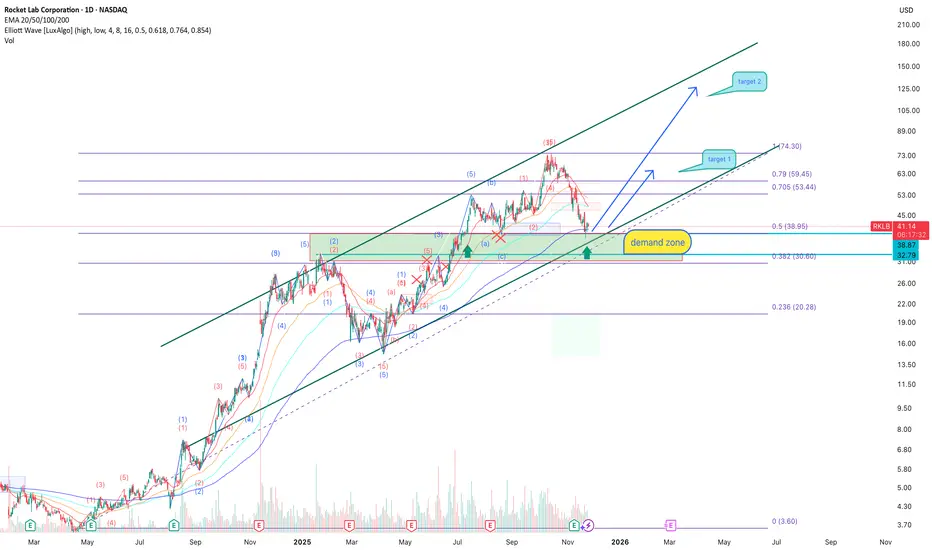
RKLB: demand zone may launch the next rallyRocket Lab remains one of the strongest long-term stories in the small-launch sector. The company continues expanding production capacity, scaling its launch cadence, securing new government contracts, and increasing recurring revenue from satellite services. The global demand for small-satellite deployment is growing faster than supply, and RKLB is steadily becoming the second major player after SpaceX in the commercial-launch and orbital-services niche. Additional growth in spacecraft manufacturing and analytics strengthens the company’s strategic positioning. From a long-term fundamental perspective, the recent price decline looks more like a technical correction inside a broader bullish cycle, rather than a structural reversal. For mid- and long-term investors, this area historically acts as a key accumulation zone -especially when fundamentals align with major technical supports.
Technically, price has held a major demand zone between 38–33 USD - the same zone that previously generated strong upward impulses. The correction stopped right at the 0.5 Fibonacci retracement (38.95), and buyers are showing absorption on lower timeframes. Price remains inside the broader ascending channel, while EMA 20/50 are stabilizing above the demand level, suggesting momentum may soon shift upward again. A clean entry setup forms once the market breaks and confirms the 0.705/0.79 Fibonacci cluster, opening the road toward the first target at 59.45 and then the extended target at 74.30. The bullish scenario remains valid as long as price stays within the demand zone and above the long-term trendline.
Fundamentally, the engine is already running -now all the chart needs is technical ignition to send RKLB back into the upper band of the long-term channel.