USOIL Near Final Leg USOIL is forming a clear corrective pattern inside a falling channel. Price is currently in the final leg of wave (5) of (C), suggesting one more dip is likely before reversal.
The downside target lies near 5,000–5,200 , where support from the channel base aligns. Once this level holds, a strong bullish reversal is expected, marking the end of the correction and the start of a new upward trend.
Stay Tuned!
@Money_Dictators :)
Elliottwaveprojection

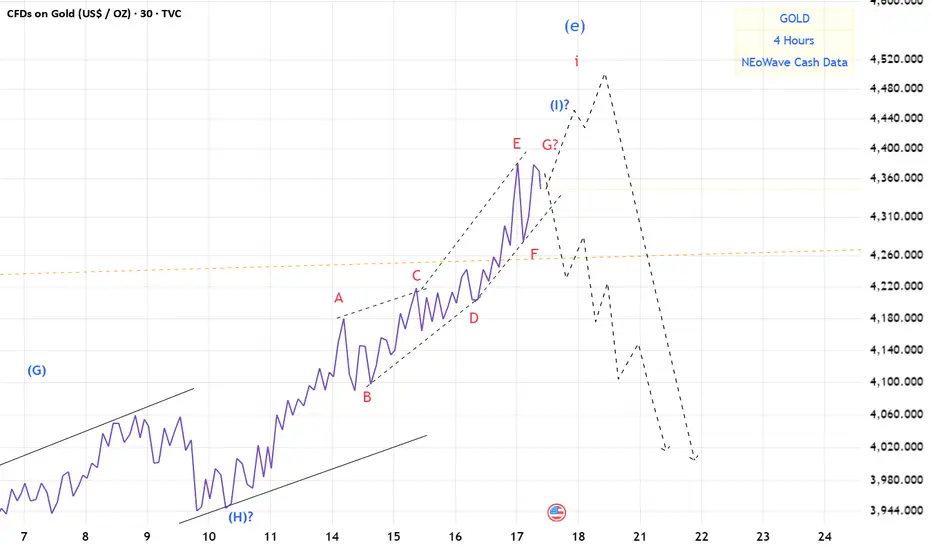
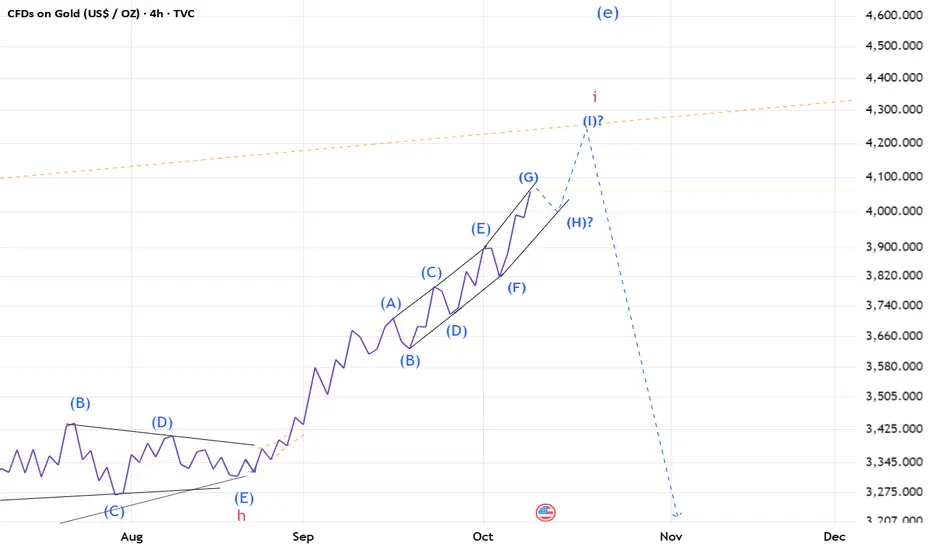
Gold(based on NEo wave)maybe here is the end of wave i.
based on Dow theory good news on top.
crazy people are buying gold.
I think soon we will see crash of gold.
market will not be bullish forever.
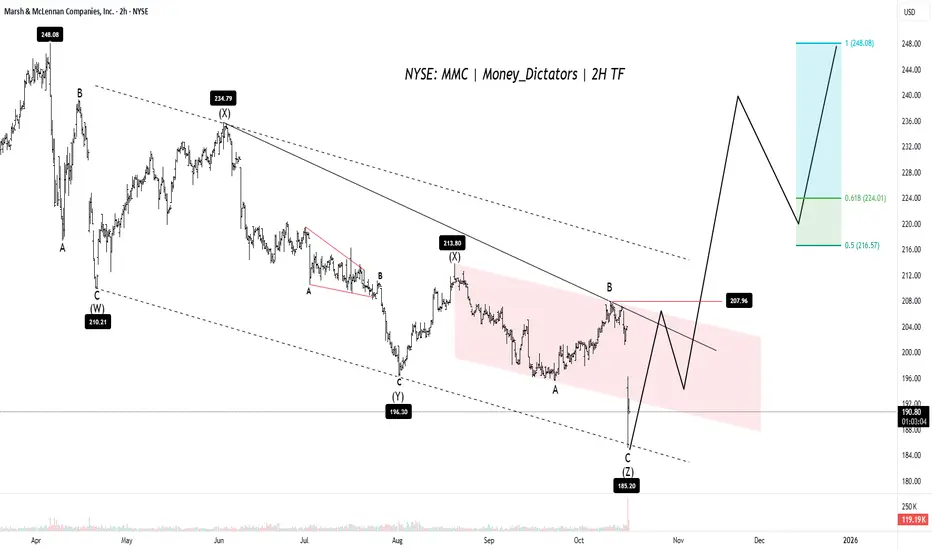
What Should You Expect From MMC?MMC is nearing the end of a recent price drop. The price is currently in its final downward phase, expected to bottom out around $184 to $186. Targets are 219, 234 & 245. Bulls can take control at wave B point(Resistance - $207).
If the price successfully holds above this $184–$186 support, the analysis predicts it will trigger a new, major upward trend. To officially confirm that the correction is over and a strong bullish trend has begun, the stock needs to break out above the $207 to $210 level. Once that breakout happens, the price is expected to rise sharply, potentially hitting the previous high of $248.
However, if the price drops below $184, this positive outlook will be invalidated, and the stock is expected to continue its downward correction.
Stay Tuned! Thank you:)
@Money_Dictators
Nifty 50 Is Showing Sign of ReversalIn previous chart, Expected upsurge accomplished:
Nifty has reached the optimal supply zone and is expected to decline, at least up to 24,584 . The retracement of wave A (0.786) could act as a strong resistance for a reversal. The lower boundary lies at 24,120 , while 24,377 marks the low of wave (W). It’s better to consider the lower boundary as the potential maximum downside level.
Once the reversal level is identified, we will proceed toward the bullish path.
Stay tuned!
@Money_Dictators
Thanks :)

NAS100 Forecast: A Fresh Bullish Impulse Toward New HighsThe NAS100 index is currently moving within a classic Elliott Wave structure. After completing wave (3), the market entered a correction phase that formed wave (4). This correction appears to have ended in the highlighted support zone, where buyers stepped in strongly. The five-wave pattern before wave (4) confirms a solid bullish trend. Now, the index seems to be preparing for the final upward move wave (5). This wave often represents the last push of a rally before a larger correction starts. As long as the price stays above the recent support near 24,400 , the next targets could be seen around 25,200–25,600 . In simple terms, the market is expected to continue its uptrend after a short pullback, following the typical Elliott Wave sequence of five upward waves and three corrective ones.

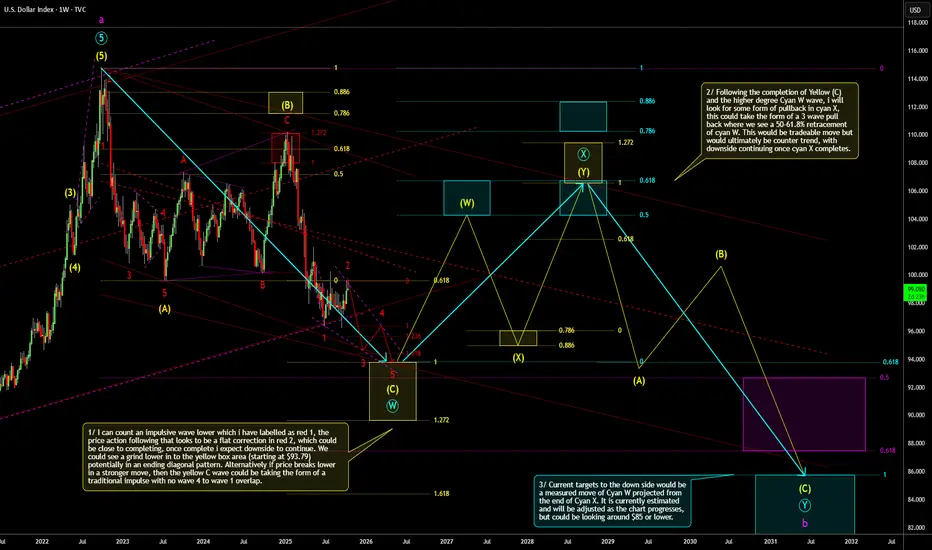
DXY Weekly Outlook (Count 3)This is a weekly timeframe outlook of the TVC:DXY . This is in alignment with my previously posted outlook which so far is playing out close to how I expected. This shows the wider view of what I think could be playing out. Still targeting the same yellow zone for a potential termination of the yellow (C) wave, after which we could see a counter trend consolidation. Current price action on the lower timeframe looks like it is forming a bearish flat correction which could be wave 2 in red. I'll look get a lower time frame update together, when time allows. More comments on the chart.
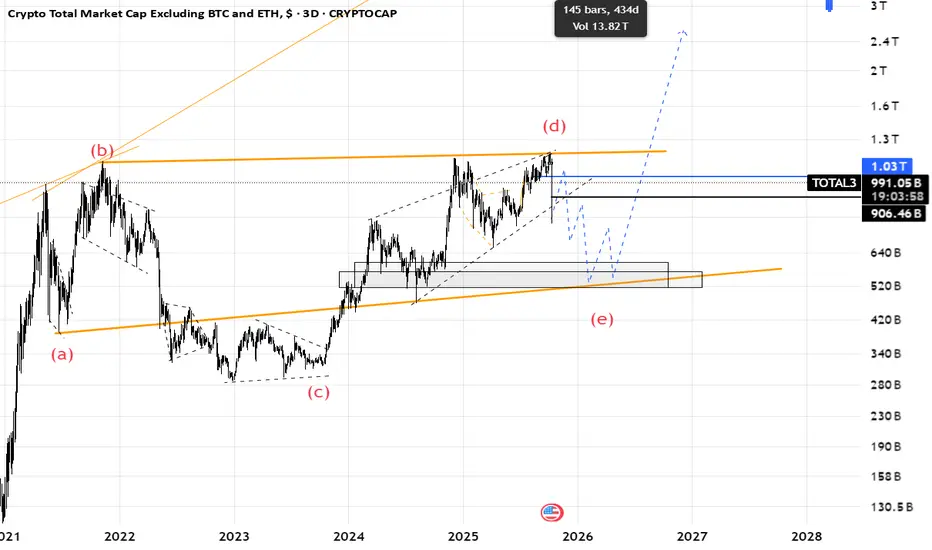
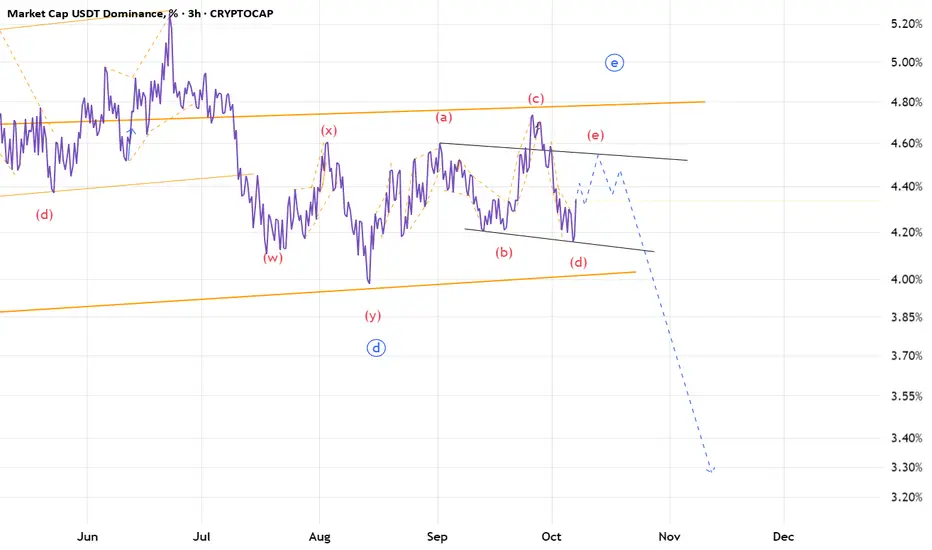
Total3(based on NEo wave)I thought wave (e) is finised but I was wrong.
now I think its the start of wave (e) and we should afraid of altcoins.
when wave (e) is finished altcoins will start to pump.
every upward is a chance to sell.
there is another scenario that I will share it on next post.
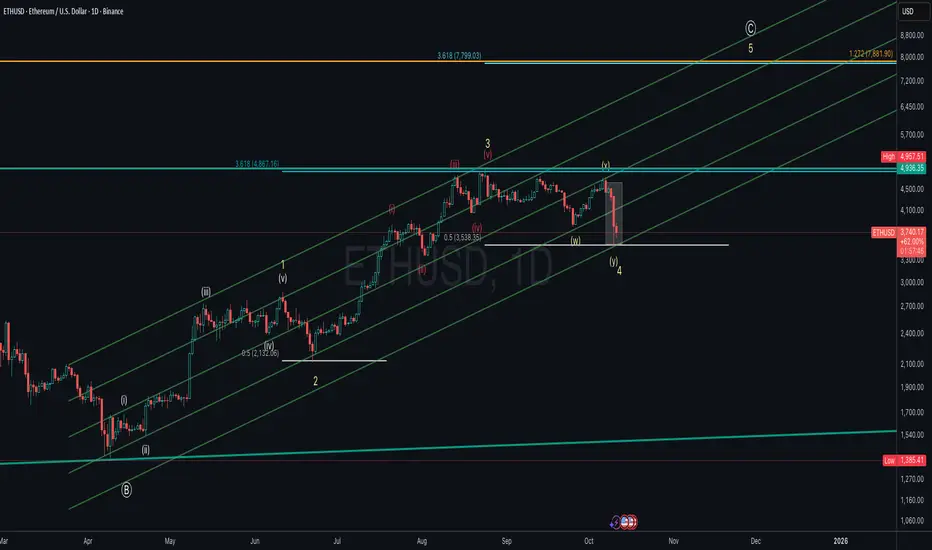
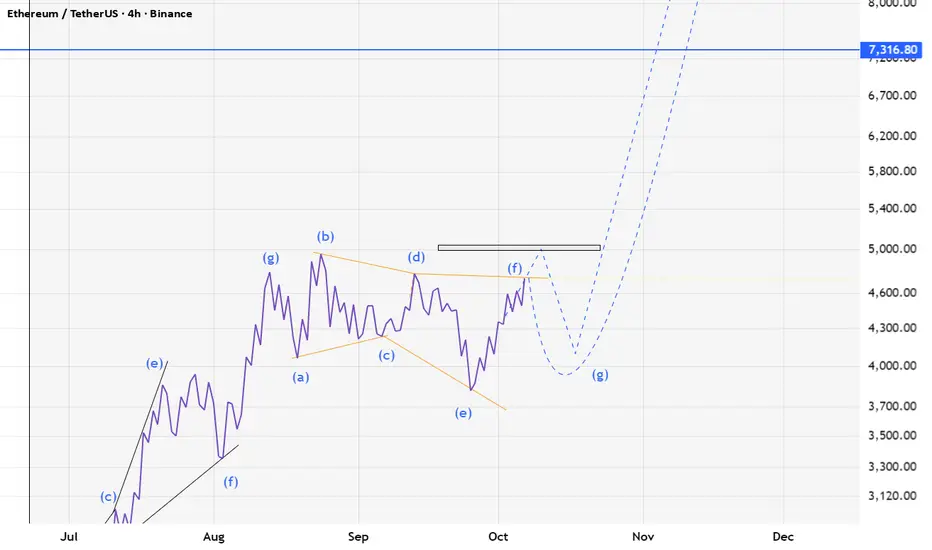
ETHUSD – Wave 4 Correction Near Completion? Preparing for the FiEthereum (ETHUSD, Log Mode) appears to be completing a Wave 4 corrective structure (W–X–Y) within the broader impulsive cycle from the March lows.
Wave 4 found strong support near the 0.5 retracement level around $3,500, aligning with the lower parallel channel of the wave 3 advance.
A potential Wave 5 rally could begin once confirmation of reversal is seen, with upside targets projected at:
$4,867 (3.618 extension of Wave 1)
$7,800–$7,900 (1.272 extension of the macro structure)
If ETH breaks below $3,500, it could invalidate this immediate bullish count and suggest a deeper correction.
Key Levels:
Support: $3,530 / $3,350
Resistance: $4,867 / $7,800
Invalidation: Below $3,500
Watching for signs of a Wave 4 bottom to confirm the start of Wave 5, potentially leading Ethereum into new all-time-high territory in the coming months.
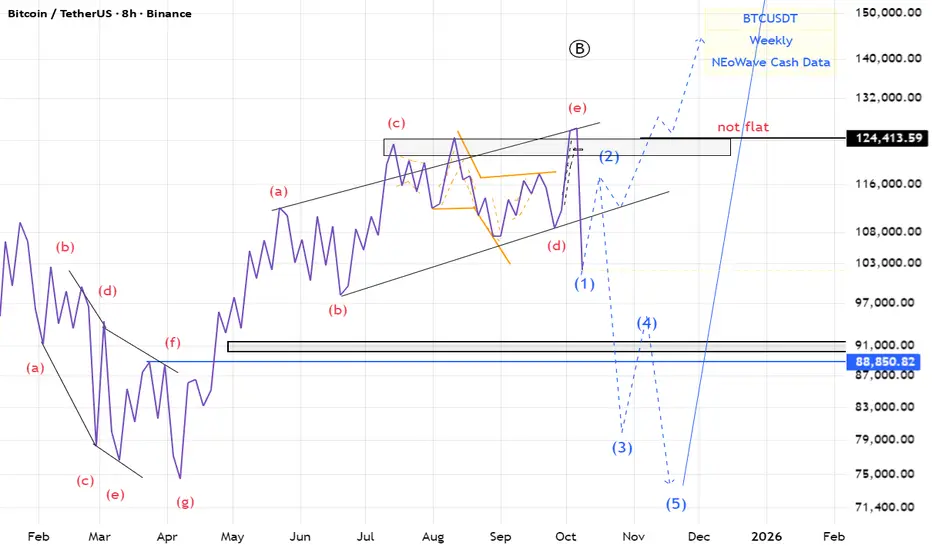
BTC(based on NEo wave)there is a good possibility for the irregular flat.
I think 2-3 month we will see the red market
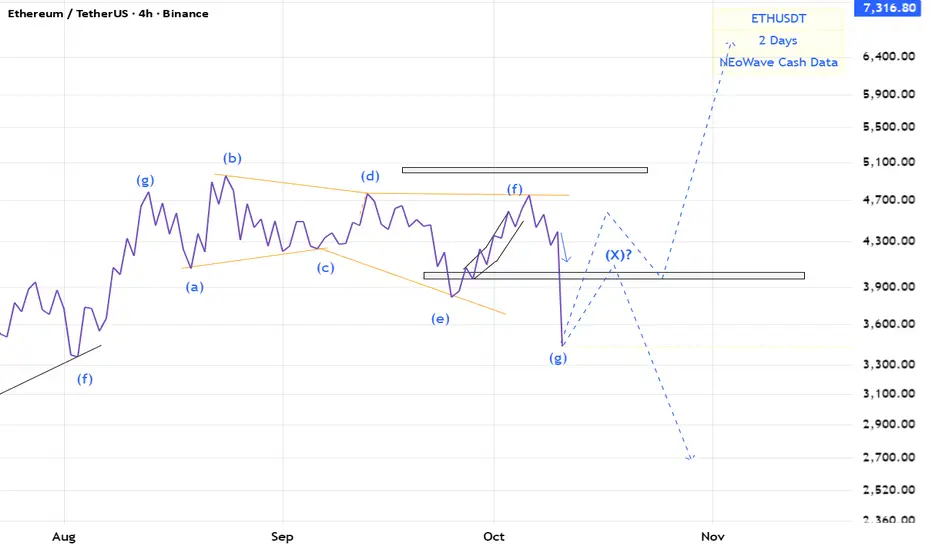
ETH(based on NEo wave)stop loss touched and now there are 2 ways for eth.
we need a post pattern confirmation for bullish wave.
or there is an x wave an correction stills go on.
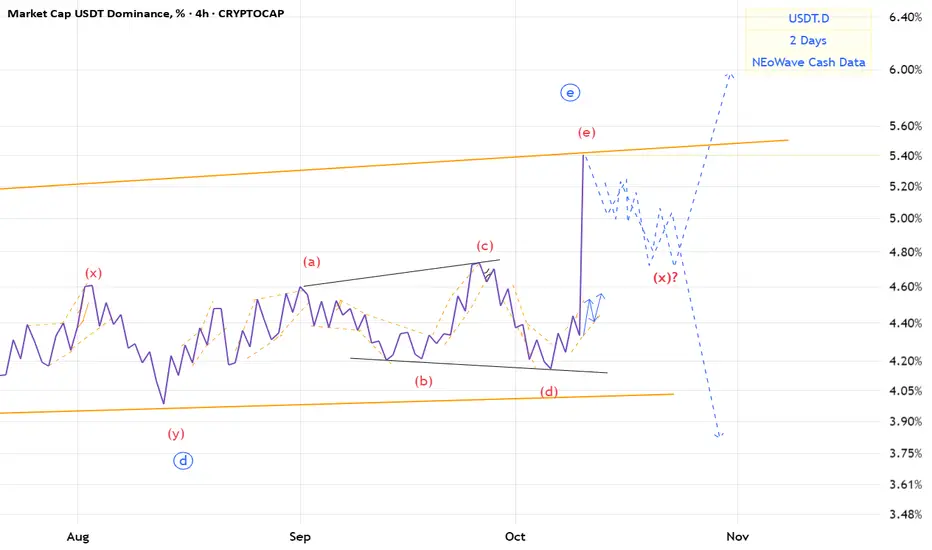
USDT.D(based on NEo wave)The e wave that I wanted made a descending triangle.
we should wait for it becouse it may make an x wave or a post pattern.
ETHUSD: Reversal Expected Near 4100The bullish outlook remains unchanged. We are expecting the price to reverse near 4100 . The sharp move on wave a, a small correction for wave b, indicates a sharp decline and rapid rise in the upcoming days.
Previous research:
Stay Tuned!
@money_dictators
Thanks :)

Gold(based on NEo wave)gold is at the end of bull run and its time to sell it on high prices.
after this waves finished I think 2700$ will touch in 2 years later.
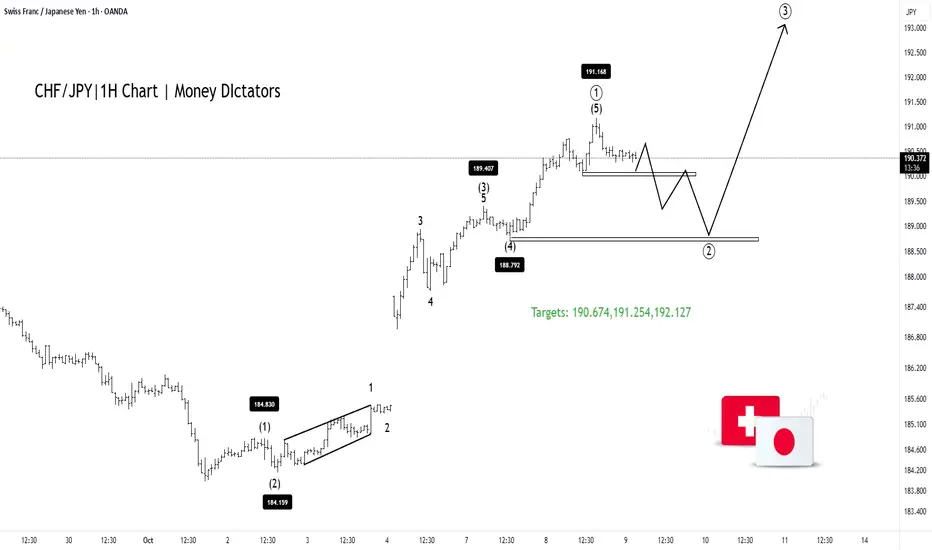
CHF/JPY Builds Momentum for Next Wave HigherThe CHF/JPY 1-hour chart shows a completed wave (1) near the 191.17 level, confirming a strong bullish impulse after a previous decline. The pair is now entering a wave (2) corrective phase, which is likely to retrace toward the 188.7–189.0 support zone before resuming the next upward move. This pullback appears to be a healthy correction within the broader uptrend. Once the correction is complete, wave (3) is expected to begin, targeting levels above 193.0 . The overall market structure remains bullish, suggesting that any short-term dips could offer potential buying opportunities for traders waiting for the next impulsive rally
Stay tuned
@Money_Dictators
Thank you.
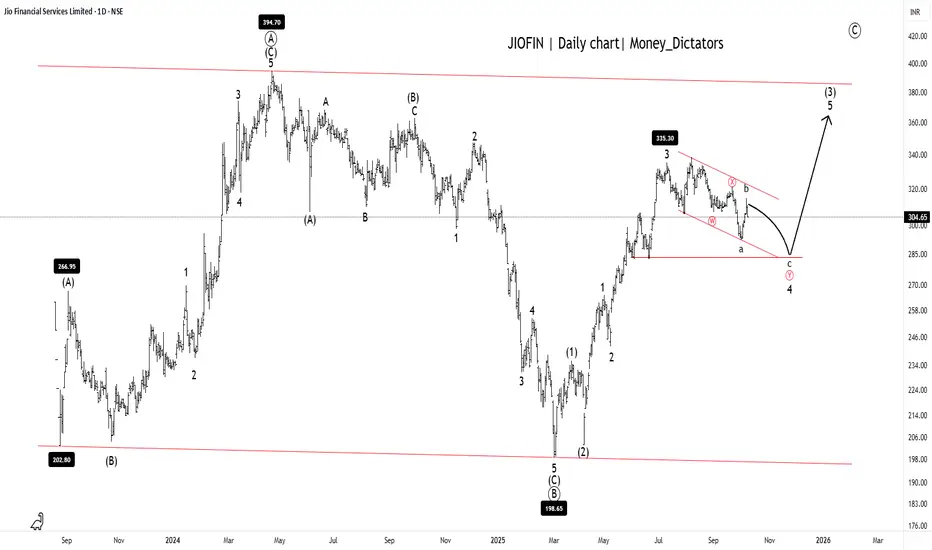
JIOFIN Setting Up for the Next Big Breakout!JIOFIN Daily chart
Possible short-term dip toward 285 - 290.
Long-term Levels: 335, 368, and 342.
Overall Trend: Bullish
Short-term trend: Bearish
JIOFIN is ready for the final upsurge as the correction ends at wave (C). A major A-B-C correction of the primary degree is clearly visible on the daily timeframe chart. Upon closer examination, it appears that the JIOFIN is currently in wave (Y) of wave 4. After completion of the wave 4 structure, Stock will set for the wave 4 for the given long-term levels.
Stay tuned!
@Money_Dictators
Thanks :)
Gold Elliott wave analysisMy projection of gold based on Elliott wave analysis.
3800 is not out of the question.

LTCUSD Next Target for Bulls RevealedLTCUSD 4H Chart
The correction has already ended at 100.25 . We expect a small retracement before the trend continues. Upon closer examination, this correction appears to be subwave C of wave (4). For now, watch the 119 level for a potential bullish breakout.
LTCUSD Targets: 122 , 127 , and 132 .
Wave (4) has already reached the 0.382 Fibonacci retracement level, which may act as support near the upper boundary and serve as a possible reversal point.
Stay tuned!
@Money_Dictators
Thank you :)

ETHUSD: Where Price Could Go?4h tf
ETHUSD has bounced back strongly from around $3,826 after completing an A-B-C wave pattern. Right now, the price is testing resistance near $4,756. It could drop a little to around $4,440 before moving higher again. If the uptrend continues, the next target levels are $4,955, $5,300, and $5,500.
Stay tuned!
Thank you,
@Money_Dictators

USDT.D(based on NEo wave)the bigger degree is a huge triangle and also wave E is a triangle with abcd waves which all are diametrics.
I hope wave e break the curse and change the pattern.
ETH(based on NEo wave)soon eth will start a temporary correction and goes for higher bullish waves.
it is the last chance to buy it.
Stop loss is 3800.
NQ TradesB wave is in. Currently within 1st minutte wave of the intermediate C wave down, of the current 4th wave. Entry of the 382 retracement of the most recent 3rd wave, SL coveres upto 618. Looking for just 161.8% trend based fib of the 1-2 waves. Effectively predicting the terminus of the 3rd wave, we then allow a 4th to occur, then 5 to complete the first wave down of the C wave. Bosch.

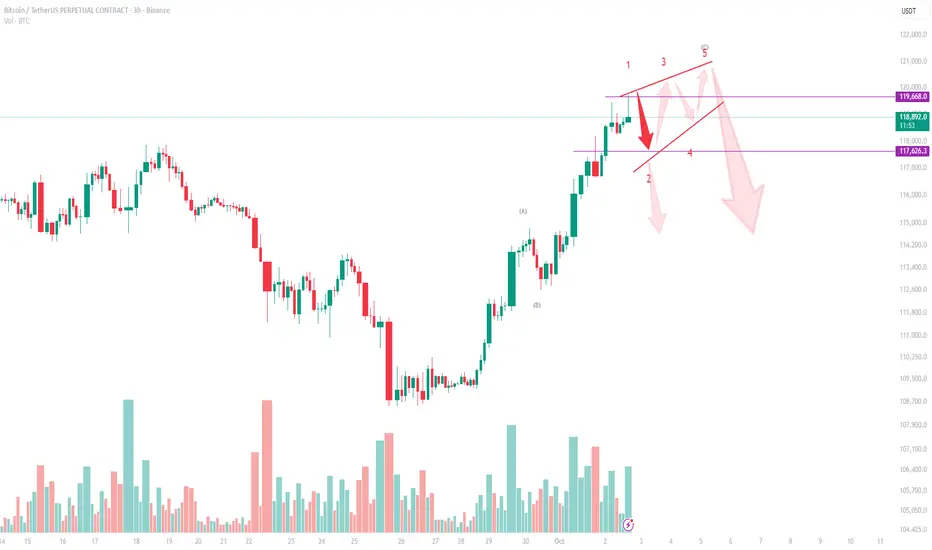
Bitcoin (BTC/USDT) Technical Analysis – 3H ChartWave Structure Outlook
Bitcoin is currently trading near $119,300, where the wave structure suggests a possible Ending Diagonal formation. This leaves us with two bearish scenarios to monitor:
Scenario 1 – Immediate Downside After 1–5 Completion
The 1–5 wave sequence may already be completed.
If so, the market could trigger an immediate downside move, breaking wedge support.
First critical level is $117,600. A clean break below this level would confirm the start of a deeper correction, opening the way toward $115,000 – $113,000.
Scenario 2 – Choppy Ending Diagonal (Light Red Arrows)
Alternatively, BTC may still extend within an Ending Diagonal.
This would mean choppy, back-and-forth price action (small up-and-down moves) before the final breakdown.
In this case, price may retest the $119,800 – $120,000 zone, but the structure remains corrective, and the eventual expectation is still bearish reversal.
Key Levels to Watch
Resistance: $119,800 – $120,000 (upper wedge boundary)
Support: $117,600 (first breakdown level)
Bearish Targets: $115,000 → $113,000
Conclusion
BTC is losing momentum at the end of a 5-wave structure. Whether the market follows Scenario 1 (immediate breakdown) or Scenario 2 (choppy diagonal ending before reversal), the overall outlook is bearish in the short term.
LINKUSDT just entered wave CI was watching and buying into the falling knife at the bottom of wave B looking for my indicator to confirm the bottom with a spike in volume. This is the move I make over and over. I use my indicator and analysis tools to determine the wave count and enter long at the bottom of wave B. This is my classic go to for trading. I bought the dip last night as we dipped under $23 and I am looking for a target of $27
