EURUSD: Extended rally into daily supplyOver the past few weeks, EURUSD has continued to extend higher, pushing deep into a daily supply zone that overlaps with a previous distribution area. The ascending channel is still intact, but I’m starting to see some loss of momentum and the first signs of selling pressure within the 1.1780–1.1850 range.
On the daily chart, price has left a potential imbalance open, with a more interesting demand structure sitting between 1.1700 and 1.1650. If recent lows are taken out, I would expect price to rotate back into that zone to fill liquidity and test buyer strength. Only a clean break and hold above 1.1850 would invalidate the corrective scenario and reopen the path toward higher highs.
The COT data shows:
Non-commercials remain net long on the euro, but positioning is not increasing as aggressively as in previous months.
On the Dollar Index, non-commercials still hold a meaningful short exposure, but they’ve been gradually reducing it.
In my view, this suggests a market that may have already priced in much of the pro-euro bias, creating room for a short-term technical reset.
Seasonality
Historically, December tends to be positive for EURUSD, but the final part of the month often brings volatility and rebalancing flows — consistent with the idea of a pullback before any renewed extension.
Retail sentiment
Current sentiment shows roughly 81% of retail traders short.
Typically, that’s a contrarian bullish signal. However, given that we’re trading inside supply and the structure is stretched, I interpret it as the uptrend is still alive, but the risk of a corrective phase is increasing.
Invalidation
This corrective view is invalidated with daily closes above 1.1850 and strong continuation inside the channel.
Fed

Gold in 2026: Will the Bull Market Defy Gravity?Gold emerged as the premier asset of 2025, delivering a remarkable year-to-date gain of roughly 60% . The precious metal shattered multiple records, peaking near $4,550 per ounce in December. While the S&P 500 advanced approximately 17%, gold decisively outperformed almost every major asset class. As we enter 2026, the market must decide if this powerful uptrend still has "fuel in the tank."
Fed Policy and the Opportunity Cost Shift
Federal Reserve policy remains the primary engine for gold’s momentum. After reigniting the easing cycle in late 2024, markets now price in approximately * 60 basis points of additional cuts for 2026. Lower interest rates reduce the opportunity cost of holding non-yielding bullion, making gold more attractive to institutional investors.
The potential appointment of a more dovish Fed chair in mid-2026 could further accelerate this trend. President Trump has publicly pressured for more forceful rate reductions to support economic expansion. If the Fed adopts a markedly more accommodative tone, gold could easily target the $5,000 psychological barrier .
Geopolitical Flashpoints and Tariff Warfare
Military conflicts in Ukraine, Gaza, and the Middle East continue to drive persistent safe-haven inflows. However, the "Trump Liberation Day" announcement of sweeping global tariffs has become an even larger catalyst for demand. Investors increasingly utilize gold as a hedge against the resulting trade-war uncertainty and currency volatility.
Central Banks and the De-Dollarization Narrative
Central banks are fundamentally altering the global reserve landscape. Emerging market institutions, led by China and India, are stockpiling gold to reduce reliance on the U.S. dollar. In 2025, official sector demand reached record-breaking levels, with quarterly totals often exceeding 900 tonnes .
While the pace of accumulation may moderate slightly in 2026, the structural trend remains firmly bullish. Central banks now treat gold as strategic collateral in an increasingly fragmented global financial system.
The Gold-to-Silver Ratio Compression
While gold’s performance was exceptional, it lagged behind the explosive gains in silver, which surged over 150% in 2025 . This dynamic caused the gold-to-silver ratio to tumble toward the 70 mark. Historically, such a sharp compression often precedes a renewed acceleration in the gold rally as the ratio reverts toward the mean.
Risks: Jewelry Demand and Regulatory Headwinds
Despite robust investment interest, record-high prices are crushing physical jewelry demand. Worldwide jewelry consumption saw a 31% year-on-year decline in Q3 2025 as consumers balked at elevated costs.
Additionally, new regulatory measures could dampen local demand in key markets. China’s decision to cut tax exemptions on certain gold holdings might exert downward pressure on prices in early 2026. If the Fed implements fewer rate cuts than anticipated due to a resilient U.S. economy, the bull run could enter a consolidation phase during the second half of the year.
Strategic Outlook for 2026
Technical analysts target the $5,000 to $5,200 range for gold in the first half of 2026. This target aligns with the 261.8% Fibonacci extension of recent corrections. While the path will not be linear, the convergence of geopolitical risk, debt expansion, and accommodative monetary policy justifies a higher equilibrium price.

XAUUSD - Gold still rising?!Gold is trading above the EMA200 and EMA50 on the 1-hour timeframe and is trading in its medium-term ascending channel. Maintaining the current support level will lead to a continuation of the upward movement of gold towards 4560, while its loss will pave the way for a correction to around 4440.
The release of the **final U.S. economic growth data for the third quarter** once again drew market attention to the growing gap between **strong economic momentum** and **persistent inflation pressures**. The **4.3% GDP growth rate**—the fastest pace in nearly two years—initially paints a robust picture of the U.S. economy. However, a deeper look at the underlying details of the report suggests that **the path of monetary policy in the year ahead is far more complex than headline GDP figures alone might imply**.
The U.S. economy has not only avoided a meaningful downturn, but has continued to maintain momentum, supported by **household consumption** and **targeted investment activity**. What makes this report particularly significant from an analytical perspective is the **coexistence of solid growth with stubborn inflation**, a combination that leaves the Federal Reserve in a difficult position. Under these conditions, the central bank is constrained—unable to confidently pursue further rate cuts, yet also lacking sufficient justification for renewed monetary tightening.
Meanwhile, **consumers remain the backbone of U.S. economic growth**. A **3.5% increase in household spending** indicates that despite a gradual cooling in the labor market and ongoing pressure from higher living costs, a substantial portion of demand—especially in service sectors such as **healthcare and travel**—continues to show notable resilience. For policymakers, this sends a clear signal: **domestic demand has not weakened enough to justify an aggressive easing of interest rates**.
By contrast, **declining spending on durable goods**, including automobiles, points to the early emergence of more cautious behavior among certain income groups. This divergence in consumption patterns is likely to **widen further in 2026**, gradually exposing downside risks to economic growth.
On a separate front, **Donald Trump** outlined his views on monetary policy and the qualities of the next Federal Reserve chair in a post on the “Truth Social” platform. He stated explicitly that **any individual who disagrees with his views would never be appointed as Fed chair**.
Trump also clarified his expectations for the future head of the central bank, saying:
“I want the next Federal Reserve chair to cut interest rates even when the market is performing well.”
He went on to emphasize that he favors a market that **rises on good news and falls on bad news**. Concluding his remarks, Trump expressed an unconventional stance on inflation, arguing that **inflation either resolves itself naturally or can be addressed by raising interest rates if necessary**.
At the same time, American economist **Peter Schiff** reiterated a series of stark warnings, stating that:
* The era of **U.S. dollar dominance is nearing its end**;
* **Gold is becoming the primary reserve asset for central banks**;
* The decline of the dollar could be **more severe than that of other fiat currencies**;
* The U.S. economy is heading toward a **historic collapse**.
According to Schiff, the United States has long benefited from the **“privilege of the dollar’s global reserve status,”** but in his view, **that train is now approaching its final stop**.

XAUUSD - Gold has reached its ceiling?!Gold is trading above the EMA200 and EMA50 on the 4-hour timeframe and is trading in its ascending channel. A reduction in the upward momentum and a correction towards the demand range will provide us with a better risk-reward buying position.
On December 10, the Federal Reserve surprised financial markets when it announced that **just two days after halting its balance sheet runoff**, it would resume **expanding its balance sheet starting December 12**. At first glance, this swift reversal appeared to signal a return to accommodative monetary policies, but a closer examination reveals that **its nature and scale differ meaningfully from past experiences**.
Although the move came earlier and with greater force than markets had anticipated, it should not be interpreted as the **start of a new round of quantitative easing (QE)**. During the 2008 global financial crisis and again amid the COVID-19 shock in March 2020, the Federal Reserve injected massive liquidity into the financial system through **large-scale purchases of long-term government bonds**. Those programs were designed to **push down bond yields, ease financial stress, and directly support economic activity**.
What is unfolding today is fundamentally different. This time, **liquidity injections are primarily being conducted via short-term securities**, and, crucially, there is no expectation that **the size of the Fed’s balance sheet will increase relative to GDP**—a key distinction from traditional QE episodes.
In reality, recent decisions more closely resemble the events that followed the **repo market turmoil of September 2019**. At that time, the Federal Reserve misjudged the impact of new liquidity regulations on banks’ demand for central bank reserves and allowed **balance sheet reduction (QT)** to continue for too long. As a result, **excess reserves fell to levels insufficient to meet liquidity needs during critical moments**, triggering a sharp spike in short-term interest rates and ultimately forcing an **emergency intervention by the central bank**.
While markets typically enter a quieter phase ahead of year-end holidays, certain **geopolitical risks** have the potential to disrupt this seasonal calm. One of the most prominent risks is the **escalation of tensions between the United States and Venezuela**. In recent days, Donald Trump has repeatedly warned about **expanding military actions against drug trafficking networks**, even floating the possibility of shifting operations from maritime routes onto Venezuelan territory—a scenario that could rapidly intensify tensions.
Along these lines, the United States has effectively imposed a **de facto blockade on sanctioned oil tankers** over the past week, restricting their movement to and from Venezuela. Should Trump decide to further escalate pressure on the government of **Nicolás Maduro**, the likelihood of a meaningful market reaction would rise considerably. Such a scenario could initially **support oil prices** and, to a lesser extent, **drive safe-haven flows toward gold**.

USD/CAD at a Turning Point: Smart Money vs Retail CrowdTechnical Context (Macro View)
USD/CAD has completed a distribution phase following the rally of recent months and is now rotating decisively back into a broad daily demand area between 1.3650 and 1.3550, a zone that has historically generated strong directional reactions. Short-term structure remains bearish, but price is now trading within a potential absorption area, with RSI compressed in the lower range, consistent with bearish momentum exhaustion. From a structural standpoint, this is not an environment to chase extended shorts, but rather to monitor for technical long reactions from high-value support.
COT Report (Commitments of Traders)
USD Index: Non-Commercials are net short, accompanied by a significant contraction in overall open interest, signaling a loss of structural strength in the US dollar following the previous bullish excess.
Canadian Dollar (CAD): Non-Commercials are heavily net short CAD, while Commercials continue to absorb, a classic setup often preceding a potential inversion or corrective rebound in CAD.
Retail Sentiment
79% of retail traders are long USD/CAD, while only 21% are short. This highlights a strong retail exposure positioned against the recent bearish move. However, context is key: sentiment is already at extreme levels, but price is now sitting at an institutional support area, increasing the probability of a short squeeze or technical rebound rather than an immediate continuation of downside extension.
Seasonality
Historical seasonality for USD/CAD shows that late December to early January often favors consolidation phases or rebounds. Data over 5, 10, and 20 years indicate a bearish pressure that progressively loses strength, with frequent mean-reversion dynamics.
Seasonal Conclusion: current timing aligns with a potential rebound or pause in the bearish trend, rather than the start of a fresh downside acceleration.

AUDUSD surges on hawkish RBA mins! Breakout or double top?AUDUSD is surging towards the 0.67 handle following hawkish RBA minutes that discussed a rate hike in 2026. However, with a potential double top forming and RSI divergence looming, we face a critical decision point: breakout to new 2025 highs or a sharp reversal, or both?
In this video, we analyse the RBA's hawkish stance vs. the Fed's easing path and what that means for the Australian dollar. We then map out the technicals around 0.6710, with a breakout strategy targeting 0.68–0.69 as well as a bearish reversal idea if momentum fails.
Key drivers
Hawkish RBA : Minutes released today show the RBA board discussed raising rates in 2026 to contain inflation, a contrast to the Fed's easing cycle. This divergence is the primary driver lifting AUD.
Double top risk : Price is approaching the 0.6700–0.6710 zone, a major resistance level and a prior high. Failure to break higher could confirm a double top pattern.
RSI divergence : On the daily chart, price is making new highs while the RSI remains below its previous peak (hidden bearish divergence). This warns of waning momentum and a potential pullback, though RIS is not in overbought territory just yet.
Upside targets : A clean daily close above 0.6710 invalidates the divergence and opens the door to 0.6758 (Fib extension), 0.6800 (psychological), and 0.6910 (61.8% projection).
Downside support : If 0.6700/10 sees a rejection, watch for a pullback to 0.6650 and the major support at 0.6594 below 0.6600. Losing this level confirms a deeper correction toward 0.6550.
Are you buying the breakout above 0.6700 or selling the double top? Share your trade plan in the comments and follow for more FX analysis.
This content is not directed to residents of the EU or UK. Any opinions, news, research, analyses, prices or other information contained on this website is provided as general market commentary and does not constitute investment advice. ThinkMarkets will not accept liability for any loss or damage including, without limitation, to any loss of profit which may arise directly or indirectly from use of or reliance on such information.

Key US Data This Holiday WeekBecause of Christmas, the US calendar is short and compressed. The main US events this week (22–28 December) are:
1. ADP Weekly Employment Change 👷♂️
High‑frequency look at US private‑sector employment from ADP. It’s not perfect, but markets use it as a soft preview for labor trends.
Bullish outcome (for risk assets):
Moderate positive reading (e.g., steady job gains, not a spike or collapse) → supports the “soft‑landing” story.
Stocks and crypto usually handle this well because it means growth is holding without screaming overheating.
Bearish outcome:
Big downside surprise (jobs stalling or negative) → recession fears, risk‑off; Treasuries and USD can catch a bid.
Big upside surprise (very strong hiring) could worry markets that the Fed will stay tighter for longer, lifting yields and pressuring growth/tech.
2. Q3 GDP (Prelim) & GDP Price Index 📊
Stronger than expected GDP / hotter price index:
Suggests the US economy is still running hot.
Could be good for cyclicals and value stocks short‑term, but if the GDP Price Index is also high, yields may rise and weigh on growth, tech, and crypto as markets push out rate‑cut hopes.
Weaker GDP / cooler price index:
Signals cooling growth and easing price pressure.
Initial reaction may be risk‑off (growth worries), but bonds rally and markets can later flip to “more cuts coming”, which supports duration and high‑beta plays if the slowdown looks controlled rather than crash‑like.
3. CB Consumer Confidence 🛒🏭
Higher reading: supports continued consumer spending → good for retail, discretionary stocks, and broad indices.
Sharp drop: raises recession odds in traders’ minds → rotation into defensives; can hurt high‑beta equities and crypto.
Conclusion
If the overall picture is: solid growth + ok confidence + no big downside shock in orders, markets will likely keep leaning toward the soft‑landing / gradual‑cuts scenario → supportive for US indices and crypto, especially if yields don’t spike.
If the data tilt either to “too strong” (growth + orders + confidence all hot) or “too weak” (clear slowdown across the board), expect bigger moves in yields and USD, and accordingly more volatility in equities and crypto as the market re‑prices the 2026 Fed path.
GBP/USD Ready for a Year–End Breakout?Daily Technical Analysis
GBP/USD is currently trading around the 1.337 area, holding above a rising channel structure after breaking through the 1.322 demand zone at the start of December. Recent daily candles show slowing bullish momentum under a higher–timeframe supply zone extending toward 1.345–1.355 and potentially 1.360.
The technical outlook suggests a possible short–term pullback: a liquidity sweep below daily lows could bring price back toward the lower trendline and potentially into the 1.331–1.324 area before any continuation higher.
Bullish invalidation remains below 1.322.
The bullish continuation target remains 1.345, with potential extension toward 1.360 if momentum holds.
COT Positioning
Non–Commercials remain heavily short on the British Pound relative to longs (135,834 vs 60,319 contracts), indicating that most speculative positioning remains bearish on GBP. However, the latest weekly update shows a significant increase in long positions (+8,067) and a smaller increase in shorts (+3,402), suggesting a gradual sentiment shift with underlying bullish accumulation.
On the USD Index side, speculative positioning remains net short (28,652 short vs 14,778 long). Combined, this creates a medium–term directional bias supportive of GBP/USD upside: strengthening GBP + weakening Dollar Index is a potentially expansive backdrop.
Retail Sentiment
Retail sentiment currently shows 52% short and 48% long on GBP/USD. This is nearly neutral but slightly contrarian bullish, as the marginal majority of short positioning runs against the recent trend. Any pullback may encourage further retail short exposure, potentially setting up a bullish rotation afterwards.
Seasonality - December Bias
Seasonality confirms a historically bullish tendency in December:
– 20–year average: slightly positive
– 15–year average: positive
– 10–year average: slightly positive
– 5–year average: strongly positive
– 2–year average: strongly positive
This reinforces the potential for year–end upside continuation and supports a bullish narrative above 1.345 following any corrective pullback.
Trade Outlook
The base scenario remains a short–term pullback into key levels, followed by potential bullish continuation toward upper supply zones.
Short–term pullback zone: 1.331–1.324
Bullish continuation zone: 1.345–1.355
Primary extension target: 1.360
Conclusion
GBP/USD maintains a bullish daily structure. Despite heavy speculative short positioning, recent COT flows, positive seasonality, and balanced retail sentiment continue to support the idea of further upside into year–end. Technically, price is approaching a decision level below 1.345: I will be watching for a structured pullback before assessing the next bullish leg toward 1.360.
A break below 1.322 would invalidate the bullish structure and return price to a deeper accumulation phase.

USDJPY rallies on BOJ's "dovish hike": Is 158.00 next target?USDJPY is surging past 156.00 despite the BOJ raising rates to 0.75%, the highest level since 1995. This classic "buy the rumour, sell the fact" reaction is fuelled by Governor Ueda's cautious guidance, signalling no rush for further hikes. A lack of commitment to a neutral rate path has kept the carry trade alive.
Key drivers
"Dovish hike" Reaction : The BOJ raised rates to 0.75% as priced in, but Governor Ueda emphasized a "data-dependent" approach with "no pre-set path," disappointing hawks hoping for a rapid tightening cycle.
Neutral rate uncertainty : Ueda admitted it's "challenging to pinpoint" the neutral rate and wants to observe the economy's reaction first, implying a pause that leaves the wide yield gap with the US (3.5%+) intact.
Technical breakout : USD/JPY has cleared the 156.00 resistance zone, confirming a bullish flag breakout on the daily chart. RSI resetting near 50 supports further upside potential.
Key targets : Immediate focus is on the swing high at 157.00, followed by the 2025 peak at 157.93 and the 138.2% Fibonacci extension at 158.77.
Trade plan : Bias is bullish above 156.00. Look to buy pullbacks into the 156.00–156.20 support zone, targeting 157.00+; invalidation below 155.00.
Are you buying the BOJ breakout? Share your USD/JPY targets in the comments and follow for more central bank and technical trade setups.
This content is not directed to residents of the EU or UK. Any opinions, news, research, analyses, prices or other information contained on this website is provided as general market commentary and does not constitute investment advice. ThinkMarkets will not accept liability for any loss or damage including, without limitation, to any loss of profit which may arise directly or indirectly from use of or reliance on such information.

EUR/AUD: Is This Daily Rejection the Start of a Breakdown?1. COT Positioning
The latest COT data reflects a clear divergence between EUR and AUD positioning:
• EUR futures (Non-Commercial) continue to show strong net-long positioning, with +5,367 new long contracts added and the long/short ratio holding firm. This supports medium-term EUR strength.
• AUD futures (Non-Commercial) show an opposite movement, with +6,517 new short contracts added and a further reduction in speculative long exposure. This reinforces AUD weakness.
From a COT perspective, the gap between EUR strength and AUD weakness remains wide. This does not immediately justify a deeper EURAUD downside move unless commercial positioning begins to shift. However, extended net-long imbalances can sometimes precede corrective phases, meaning current EUR strength may be late-cycle rather than early-stage accumulation.
2. Seasonal Tendencies
December seasonality is notably skewed:
• The EUR historically performs well in December across all major lookback periods (20Y, 15Y, 10Y, 5Y, 2Y), creating a supportive seasonal tailwind.
• The AUD shows mixed to mildly positive seasonal behaviour at shorter timeframes, but lags the EUR significantly over the 10-year dataset.
Overall, seasonality favours EUR strength against AUD into year-end, adding a bullish seasonal bias to EURAUD.
3. Sentiment
Retail sentiment on EURAUD currently shows:
• 68% short
• 32% long
Such an imbalance typically acts as a contrarian bullish signal. As long as retail traders remain heavily short, upward pressure on EURAUD is likely to persist.
4. Daily Chart Structure
Price is currently rejecting a major daily supply zone after a sustained three-week upside rotation. The rejection aligns with key technical factors:
• descending trendline resistance
• previous distribution area
• RSI rejection from mid-range
Key levels:
• Daily supply: 1.7806 – 1.7921
• First downside target: 1.7558 demand
• Secondary liquidity zone: 1.7500 – 1.7440
The recent bearish move off supply suggests the start of a potential corrective phase. However, the higher timeframe structure remains bullish, and this decline may represent a pullback rather than a full structural reversal.
Macro factors (COT + seasonality + sentiment) lean bullish, which conflicts with the short-term downside impulse.
Short-term bias: Bearish corrective move toward 1.7558 demand
Medium-term bias: Bullish continuation unless 1.7440 breaks
The location is favourable for tactical shorts following the daily rejection, but aggressive management is required. Deep downside targets carry higher risk unless bearish momentum increases.

Bitcoin Playbook: Grind the Range, Harvest the Dip__________________________________________________________________________________
Market Overview
__________________________________________________________________________________
Bitcoin holds a choppy range after rebounding off mid-range support, with upside still capped by a well-defined HTF ceiling. Event risk is elevated, so liquidity pockets and confirmation matter more than speed.
Momentum: Neutral to bearish tilt within a broad 83,900–94,600 range, capped below 90,350 as intraday trends remain heavy while 1D attempts to stabilize.
Key levels:
- Resistances (HTF): 88,900 (1H supply), 90,350 (240 Pivot High), 94,635 (D Pivot High).
- Supports (HTF): 85,177 (720 Pivot Low), 84,100–84,260 (ISPD multi‑TF floor), 83,871 (D Pivot Low).
Volumes: Mostly normal across TFs, with moderate 2H spikes acting as an amplifier near resistance.
Multi-timeframe signals: 12H/6H trend down while 1D edges up, arguing for fades into 88,900–90,350 and patience for dip-buys only at the strongest floor confluence near 84.1–84.26k.
Harvest zones: 84,200 (Cluster A) / 79,100–80,800 (Cluster B). Cluster A is the ideal dip-buy for inverse pyramiding, Cluster B is a deeper core zone built from 2H/12H floors if volatility expands.
Risk On / Risk Off Indicator context: NEUTRE VENTE, confirms the risk-off tone and raises the bar for breakouts while favoring tactical shorts into HTF resistance.
__________________________________________________________________________________
Trading Playbook
__________________________________________________________________________________
The dominant structure is range with a defensive bias, so trade the edges and demand confirmation.
Global bias: Neutral sell below 90,350, key invalidation for downside bias on a sustained daily close above 90,800.
Opportunities:
- Buy the dip only at 84,260–84,100 with a confirmed ≥2H bullish reversal and tight follow‑through rules.
- Breakout buy on clean break and hold above 90,350 with volume, then trail toward 91,800 → 94,600.
- Tactical sell on rejection at 88,900–90,350 with rising volume, add on failed retest.
Risk zones / invalidations: A daily close above 90,800 would invalidate the short‑fade plan, a sustained close below 83,700 would invalidate dip-longs at the cluster.
Macro catalysts (Twitter, Perplexity, news): CPI today, BoJ decision tomorrow, and a very large options expiry window raise volatility risk and can flip range edges into breakout traps or accelerants.
Harvest Plan (Inverse Pyramid):
- Palier 1 (12.5%): 84,200 (Cluster A) + reversal ≥2H → entry
- Palier 2 (+12.5%): 80,800–79,100 (-4/-6% below Palier 1) (Cluster B included) → reinforcement
- TP: 50% at +12–18% from PMP → recycle cash
- Runner: hold if break & hold first R HTF
- Invalidation: < HTF Pivot Low or 96h no momentum
- Hedge (1x): Short first R HTF on rejection + bearish trend → neutralize below R
__________________________________________________________________________________
Multi-Timeframe Insights
__________________________________________________________________________________
Timeframes are mixed, with daily stabilization but intraday pressure, which supports a range-harvesting stance.
12H/6H: Downtrend under the EMA cloud with lower highs, favoring fades at 88,900–90,350 and keeping risk tight into event risk.
4H/2H/1H: Upswings are stalling into the HTF ceiling, requiring volume confirmation for any breakout above 90,350, otherwise expect mean‑reversion to 87,800 → 85,200.
1D: Up attempt but capped by 90,350 and 94,635, best long-risk spots align with the 84.1–84.26k multi‑TF ISPD floor just above the 83,871 daily pivot low.
__________________________________________________________________________________
Macro & On-Chain Drivers
__________________________________________________________________________________
Macro is in the driver’s seat over the next 24–48 hours, and the risk regime is defensive even as ETF flows help at strong floors.
Macro events: CPI today sets DXY and rates tone, BoJ tomorrow can shock global beta, and a very large options expiry window heightens short-term vol. Equities are wobbling, Gold is firm, and oil is bid into geopolitics.
External Macro Analysis: The Risk On / Risk Off Indicator shows a defensive regime with late-cycle tones, credit stress signals align bear, while small caps and semis are conflicted. This supports a cautious technical bias and argues for confirmation on breakouts.
Bitcoin analysis: Spot ETF net inflows are supportive on dips, whale outflows reduce on-exchange supply, yet the market remains rangebound and low conviction until the 90,350 cap is reclaimed.
On-chain data: Mixed and fragile, with defensive posture, soft volumes, and elevated skew consistent with range or corrective risk while below key HTF bands.
Expected impact: Macro risk is likely to reinforce a neutral-sell bias, favoring dip-buys at Cluster A with confirmation and short-fades at resistance until a clean breakout resets the regime.
__________________________________________________________________________________
Key Takeaways
__________________________________________________________________________________
BTC is rangebound with a cautious, event-driven tone that demands disciplined execution at high-confluence zones.
The broader trend is neutral with a bearish tilt while below 90,350. The most relevant setup is buying confirmed reversals at 84.1–84.26k or fading 88,900–90,350 rejections. The key macro factor is the CPI → BoJ → options expiry trifecta that can force expansion. Stay patient, think Tarkov, and only take the fight where you control the angles.

S&P 500 "tech wreck": Double top breakdown targets 6,500?The S&P 500 has sliced through its 50-day moving average and paused by 50% Fibonacci retracement following a fourth straight day of losses. With a confirmed double top at 6,930 and momentum shifting bearish, we’re eyeing a move back to the range lows at 6,500.
In this video, we break down the impact of the "tech wreck" and Fed Governor Waller’s mixed signals on 2026 rate cuts, which have triggered a risk-off sentiment. Then, we outline a short setup selling the bounce into 6,765–6,800, targeting the November 21 lows.
Key drivers
Technical Breakdown : The index has broken below its 50-day moving average and the 50% Fibonacci retracement (6,725), confirming bearish momentum from a double top structure.
"Tech Wreck" & Macro : High-value tech stocks and crypto sold off sharply yesterday, exacerbated by Fed Governor Waller’s caution on "hurrying up" rate cuts despite inflation risks.
Range Structure : The S&P 500 is trading within a rectangular range between ~6,930 (highs) and 6,500–6,520 (lows). We are currently in the middle of this range with a downside bias.
Short Setup : We are looking to sell a retracement to the 38.2% Fib / prior low (~6,765–6,800) rather than chasing the breakdown due to the 4-hour RSI shift.
Trade Plan : Entry around 6,765, stop loss above 6,830 (23.6% Fib), targets at 6,600 and ultimately 6,500. Risk/reward is favourable at 1.7+.
Are you selling the tech sell-off or waiting for support? Share your levels in the comments and follow for more technical swing setups.
This content is not directed to residents of the EU or UK. Any opinions, news, research, analyses, prices or other information contained on this website is provided as general market commentary and does not constitute investment advice. ThinkMarkets will not accept liability for any loss or damage including, without limitation, to any loss of profit which may arise directly or indirectly from use of or reliance on such information.

GBPJPY: COT & Seasonality Align for Bullish ContinuationCOT (Commitment of Traders): On GBP futures, Non-Commercial traders remain heavily net short, with an unbalanced structure and a further increase in short exposure over recent weeks. This positioning is typically contrarian in nature and remains consistent with continued upside potential in the cross. On the JPY side, Non-Commercials are still net long, but the broader context points to a structurally weak yen. Positioning momentum is fading, suggesting a higher risk of short covering rather than genuine defensive strength. From a relative perspective, the GBP vs JPY COT spread continues to favor further upside in GBPJPY.
Seasonality: Historical seasonality highlights December as one of the strongest months for GBPJPY, showing positive average performance across the 20-, 15-, 10- and 5-year datasets, with frequent accelerations during the second half of the month. This reinforces the broader bullish bias and reduces the probability of deep reversals as long as the technical structure remains intact.
Sentiment (retail): Retail positioning shows a clear majority short (around 80%), a classic setup that tends to support trend continuation and potential squeezes above highs, particularly when aligned with a well-defined trend and no signs of institutional distribution.
Daily technicals: The daily chart maintains a clean bullish structure, defined by higher highs and higher lows within an ascending channel. Price continues to trade above key value areas while respecting dynamic demand zones. The 206.5–205.5 area represents the first continuation demand, while a broader daily demand sits lower around 203–200, overlapping with a daily FVG and structural support. On the upside, 211.5–213 stands out as daily supply and the natural upside objective. Technically, there is room for an extension toward new highs as long as no structural breakdown or distribution signals emerge. The daily RSI remains constructive, with no meaningful bearish divergences, fully consistent with trend continuation.
Operational conclusion: The medium-term bias remains bullish. The preferred strategy is buying pullbacks into daily/H4 demand zones, with invalidation only below the key structural lows. Counter-trend shorts should be avoided. Short opportunities become relevant only if clear exhaustion signals appear at daily supply, supported by divergences and a confirmed structural shift, which are currently absent.

USDJPY – Daily Compression at Key Demand: COT Divergence PointsFrom a COT perspective, the overall picture remains consistent with a phase of potential short-term structural weakening in the JPY, while at the same time showing signs of maturity in the USDJPY move. On JPY futures, Non-Commercial traders are still net long the yen (longs exceeding shorts), but the latest data highlights an increase in short positions alongside a reduction in longs, a typical distribution pattern following months of accumulation. At the same time, Non-Commercials on the Dollar Index remain heavily net short, suggesting that USD strength is increasingly fragile and driven more by tactical flows than by strong long-term conviction. This COT divergence historically tends to favor corrective moves on USDJPY rather than impulsive upside extensions.
On the daily chart, the technical structure is well defined: after the strong bullish impulse in November, price is developing a consolidation flag / descending channel, characterized by lower highs and compression toward a clearly defined daily demand zone between 154.00 and 154.50. This area has already been defended multiple times and aligns with a volume equilibrium zone. A clean break below this demand would open room toward the lower demand area around 152.00–152.50, while as long as price holds above the base of the channel, the bias remains corrective rather than structurally bearish. From a technical standpoint, the higher-probability scenario is a reaction from the demand zone with an attempt to break the upper trendline, rather than an immediate downside acceleration.
USDJPY seasonality in December has been historically positive to neutral-bullish over the past 10–20 years, with a tendency for recoveries in the second half of the month following early weakness. This supports the case for a technical rebound rather than a direct bearish continuation. Retail sentiment is almost perfectly balanced (51% long / 49% short), providing no extreme contrarian signal and reinforcing the idea of a market in a waiting and building phase, consistent with the current daily range and compression.
Overall, the operational bias remains neutral-to-bullish on weakness. The 154.00–154.50 area is a key reaction zone where a change in structure could justify tactical long exposure, with invalidation below daily demand. Only a decisive break and acceptance below 154 would shift the outlook toward a bearish continuation targeting 152, while a break of the descending trendline would confirm the resumption of the medium-term bullish trend toward 157.50–158.00.

Gold Breakout Bull Pennant #3It's been another strong year for gold and with President Trump set to name a dovish successor to the Fed Chair post, the door can very much be open to more topside provided one very major factor doesn't become a problem, and that's inflation.
Gold broke out from bull pennant #3 around the news that Trump would name Kevin Hassett as the next Fed Chair. Bond markets didn't seem to rejoice in that news as Treasury yields pushed up after that circulated, which is probably one reason Trump has softened from the stance where he previously said he already knew who he would name, down to the current stance of one of the two Kevins (Kevin Warsh, being the other).
Hassett has history as an uber-dove and this is even under Democrat administrations. In an article for AEI published in 1999, he seemingly called out Alan Greenspan for the threat of raising interest rates to pop the internet bubble. That article was released on September 3rd of 1999, so about six months before stocks had topped; but the Fed also hiked a handful of times between the two occurrences with a 50 bp hike in May of 2000, after equities had already set their high (we didn't know that at the time, however).
As we go into 2026, it seems that whoever Trump names next Fed Chair rate cuts will be involved, as he's already said a willingness to cut rates is a 'litmus test' for who he ultimately nominates to lead the bank. He's also said that he would like to see rates go below 1%, which would push the dovish drive from the FOMC into another gear, and unless inflation becomes a problem, this could further drive the rally in equities and metals that have taken hold over the past couple of years.
For gold, the next week of data could set up opportunity as the metal has already broken out from the third bull pennant formation that I had highlighted in these posts in late-November. There's now support potential at 4245, 4161 and 4046, each of which can make the case for a higher-low above the pullback below 4k. - js

Post-Fed Breakdown: 25 bps Rate Cut + QE Restart = Risk-On Fuel Post-Fed Breakdown: 25 bps Rate Cut + QE Restart = Risk-On Fuel
The FOMC just delivered exactly what risk assets wanted:
25 bps rate cut
Restart of QE with $40B/month in Treasury purchases
This is the liquidity cocktail that historically lights up small caps, high beta, and speculative momentum stocks. The liquidity train is rolling again.
🔹 What This Means for Markets:
QE = immediate expansion of liquidity in the system
Lower rates = easier credit + higher equity multiples
Small caps ( AMEX:IWM ) historically outperform in the early QE phase
High beta + speculative names tend to catch the strongest flows
This is the exact macro environment where markets rip even if fundamentals are messy.
🔹 What I’m Watching:
1️⃣ AMEX:IWM – Small Caps
If we get a retest in AMEX:IWM , I’ll be looking to buy calls.
These QE environments are where the Russell 2000 becomes a rocket ship.
2️⃣ Momentum Leaders:
NASDAQ:WULF – Strong relative strength, liquidity-sensitive, crypto-adjacent.
NASDAQ:EOSE – A pure rate-sensitive, high beta energy storage play.
Both names should catch strong speculative flows if the market confirms.
3️⃣ The QE Effect:
When the Fed buys Treasurys, liquidity bleeds into every corner of the market.
Historically, QE ignites multi-week rallies in:
Small caps
High-beta tech
Energy storage
Crypto-adjacent equities
Meme/spec cycles
🔹 My Game Plan:
Wait for clean setups — don’t chase the first candle.
Look for IWM dips, not spikes.
Keep NASDAQ:WULF and NASDAQ:EOSE on top of the momentum list.
Align trades with liquidity — don’t fade QE.
The liquidity faucet is turning back on. This is where swing traders make their year.

BTC Playbook: 90k Fades, 84k Swing Accumulation__________________________________________________________________________________
Market Overview
__________________________________________________________________________________
Bitcoin is consolidating under 90 000 after rebounding from 87 688, with a corrective tone where the 12H downtrend still caps momentum. The near-term battle is defined by 89 429 support and 90 000–90 600 supply overhead as macro keeps volatility elevated.
Momentum: Bearish tilt within a corrective range; rallies fade below 90 200–90 600 while buyers defend 89 429 and 87 688.
Key levels:
- Resistances (4H–1D): 89 950–90 200 (multi‑TF supply), 90 600 (HTF shelf), 93 547–94 555 (pivot‑high band).
- Supports (2H–1D): 89 429 (4H pivot‑low), 87 688 (pivot‑low), 83 800–84 200 (Cluster A with D pivot‑low inside).
Volumes: Normal on LTF and HTF; no extreme footprint to negate the 12H down bias.
Multi-timeframe signals: 12H Down and 1W Down dominate a tentative 1D Up; structure remains capped beneath 90 600 despite the daily bounce.
Harvest zones: 84 100 (Cluster A) / 79 800–80 300 (Cluster B) — preferred dip‑buy areas for inverse pyramiding when a clear reversal prints.
Risk On / Risk Off Indicator context: NEUTRE VENTE; confirms a cautious stance and aligns with fading bounces into HTF resistance.
__________________________________________________________________________________
Trading Playbook
__________________________________________________________________________________
With the dominant trend corrective and risk‑off, play defense: fade into resistance, accumulate only on confirmed floor reversals.
Global bias: NEUTRAL SELL while price is capped below 90 600; invalidation for bears on sustained closes above 90 600.
Opportunities:
- Buy the dip: 1D/2H reversal at 84 100 (Cluster A) with confirmation; first targets 89 429 then 89 950–90 200.
- Breakout long: Reclaim and hold 90 200 on 2H–4H, looking for 90 600 and 93 547–94 555.
- Tactical sell: Fade 89 950–90 200 rejection; add on a loss/retest‑fail of 89 429 toward 87 700.
Risk zones / invalidations:
- Break below 83 500 would invalidate the 84k long thesis (Cluster A failure).
- Sustained close above 90 600 would invalidate the fade‑the‑rip approach.
Macro catalysts (Twitter, Perplexity, news):
- Fed “hawkish cut” and a heavy week (NFP/CPI/PCE/quad‑witch) keep a risk‑off skew; event spikes can force range breaks.
- JPM tokenized money‑market fund on Ethereum — supportive for institutional adoption but not a near‑term driver.
- USD/JPY volatility and China softness argue for selective risk‑taking.
Harvest Plan (Inverse Pyramid):
- Palier 1 (12.5%): 84 100 (Cluster A) + reversal ≥2H → entry
- Palier 2 (+12.5%): 79 100–80 700 (-4/-6% below Palier 1) (Cluster B included) → reinforcement
- TP: 50% at +12–18% from PMP → recycle cash
- Runner: hold if break & hold first R HTF (89 950–90 200)
- Invalidation: < HTF Pivot Low 83 800 or 96h no momentum
- Hedge (1x): Short first R HTF on rejection + bearish trend → neutralize below R
__________________________________________________________________________________
Multi-Timeframe Insights
__________________________________________________________________________________
Across TFs, lower timeframes trend down while the daily shows a reflex bounce; weekly context stays corrective.
12H/6H/4H/2H/1H/30m/15m: Downtrend pressures persist beneath 89 950–90 200 and 90 600; repeated rejections favor tactical fades, with 89 429 as the intraday line in the sand.
1D: Green bar but still boxed by 90 200–90 600; a firm reclaim/hold opens room toward 93 547–94 555, else the path of least resistance remains sideways‑to‑down.
1W: Corrective and below HTF supply; until 90 600+ is reclaimed on a closing basis, risk skews to mean‑reversion into lower demand clusters.
__________________________________________________________________________________
Macro & On-Chain Drivers
__________________________________________________________________________________
Macro is mixed-to‑cautious and keeps the tape liquidity‑sensitive; on‑chain/derivatives lean defensive but can flip quickly on a clean reclaim.
Macro events: A “hawkish cut” backdrop and a packed US data slate (NFP/CPI/PCE/quad‑witch) raise event risk; USD/JPY volatility and China’s softness constrain risk appetite even as institutional on‑chain pilots (e.g., JPM) provide a slow‑burn positive.
External Macro Analysis: The Risk On / Risk Off Indicator reads VENTE with credit stress (HYG VENTE) and weak speculative appetite (ARKK VENTE); partial conflicts in semis/small caps imply mid‑cycle churn. This supports the NEUTRAL SELL technical bias.
Bitcoin analysis: After large liquidations, options structure and IV compression drive intraday; modest fund/ETF inflows are supportive but not decisive, while a reclaim could spark upside convexity.
On-chain data: Demand softer with short‑term realized losses; OI lighter, funding neutral — consistent with a reactive, headline‑driven regime.
Expected impact: Macro/on‑chain favor reactive trading — fade into 90k supply unless 90 200→90 600 is reclaimed and held; dips into 84k/80k improve risk‑reward for swing accumulation.
__________________________________________________________________________________
Key Takeaways
__________________________________________________________________________________
BTC sits in a corrective range under HTF supply with a risk‑off lean and normal volumes.
The trend is bearish‑to‑neutral while capped below 90 600. The highest‑quality setup is a confirmed reversal at 84 100 (Cluster A), with deeper adds near 80k (Cluster B) if tested. Macro remains catalyst‑heavy, so respect event risk and require confirmation. Stay patient, let the levels do the work, and harvest volatility with discipline.

EUR/USD Daily Outlook: Bullish Structure | COT & SeasonalityOn the daily chart, EUR/USD has developed a clean recovery structure after the November low, characterized by a well-defined sequence of higher lows and price holding above the short-to-medium term ascending trendline. The 1.1650–1.1600 area represents a key dynamic and structural demand zone, already defended multiple times, while the impulsive breakout toward 1.1730 confirmed renewed institutional interest on the long side. Price is now trading just below a relevant daily supply zone between 1.1750 and 1.1820, aligned with prior highs and a distribution area visible on higher timeframes. As long as this zone is not cleared with a strong daily close, the most likely scenario is a corrective pause or a controlled pullback toward 1.1680–1.1650 before any renewed attempt at the highs. From a COT perspective, the backdrop remains constructive for the euro: non-commercials are still net long EUR FX, with a reduction in short exposure and a positioning structure consistent with accumulation rather than distribution. At the same time, the US Dollar Index shows non-commercials still heavily net short, suggesting that large players are not aggressively defending the dollar and that pullbacks on EUR/USD are more likely continuation opportunities than structural reversals. From a seasonality standpoint, December has historically shown a moderately positive bias for EUR/USD, particularly in the second half of the month, favoring gradual upside moves rather than sharp directional spikes—consistent with a typical year-end environment of compressed volatility but positive directional bias. In summary, the broader bias remains bullish, though not an immediate breakout scenario: the highest-probability path favors technical pullbacks toward the 1.1650–1.1680 area to build trend-aligned long exposure, while only a confirmed daily break above 1.1820 would open room toward 1.1900. Structural invalidation sits below 1.1550, which currently remains a low-probability scenario.

Fed Just Opened the Door — USDJPY Could Bleed Hard!!Hey Traders, in today’s session we are monitoring USDJPY for a selling opportunity around the 156.300 zone. The pair continues to trade within a broader downtrend, and price is now retracing toward a key trend + S/R confluence at 156.300 — an area that has consistently acted as a supply zone for sellers.
Technical Structure
USDJPY remains in a bearish market structure (lower highs / lower lows).
Current pullback is approaching the 156.300 correction zone, where downside continuation becomes highly probable.
Dollar Macro Backdrop: Perfect Storm for USD Weakness
On the other side, DXY broke below its uptrend and is now pulling back toward the 98.800 retracement zone, confirming a broader shift in momentum.
The fundamentals are even more compelling:
1. The Fed did cut yesterday — 25bps.
This reinforces a clear dovish turn, and historically the USD underperforms aggressively in the weeks following the first cut of a new cycle.
2. The Fed's balance sheet is expanding again.
An expanding balance sheet = USD bearish liquidity environment.
3. The January FOMC is currently NOT priced for a cut — and that’s the opportunity.
The market is underpricing the risk of back-to-back cuts.
Now labor market data becomes the main catalyst.
And the reality is:
If we get any sign of further labor market weakness — which is increasingly likely — the market will start pricing in a January cut very fast.
And that leaves MUCH more room for USD weakness across the board.
Trade Focus
Monitoring price reaction at 156.300 for a bearish continuation setup.
If DXY resumes weakness out of 98.800 and labor data disappoints, USDJPY could accelerate aggressively to the downside.
Trade safe,
Joe.

EURUSD breaks higher: Fed-ECB path to drive 3rd wave to 1.19?EURUSD is trading above 1.17 on the 4-hour chart after the dollar fell to a 2-month low following Wednesday's Fed rate cut. With a potential running triangle breakout in play and a dovish Fed facing a stable ECB, the pair is eyeing the 2025 high at 1.1920 and potentially new peaks into 2026.
In this video, we break down why Powell's dovish tone and a deeply divided Fed are narrowing the rate differential with the ECB, which might upgrade growth and proceed with no cuts in 2026. Then, we map out the wave structure: a potential 3rd wave impulse targeting 1.18–1.19, with buy-the-dip zones at 1.17 and 1.1650, and larger projections toward 1.2020–1.2220 from a cup-and-handle pattern.
Key drivers
Fed cut and Powell dovish: The Fed cut rates on Wednesday, where Powell emphasised a "wait-and-see" mode, pretty much ruling out hikes in 2026; markets now price two more cuts despite the official dot plot projecting only one.
Deeply divided Fed: The December dot plot showed four members see no cuts in 2026, four see one, four see two, and three expect rates below 3% by year-end 2026, while three actually wanted to hike — No consensus.
ECB stability and growth upgrade: ECB President Lagarde said the eurozone economy shows "remarkable strength" and the ECB may upgrade growth forecasts at the December 18th meeting, with policy in a "good position" (i.e., no cuts).
Rate differential narrowing: The Fed is at 3.50–3.75% and cutting, the ECB is at 2.00% and on hold. Markets now price only a 45% chance of an ECB cut by September 2026, narrowing the spread in favour of the euro.
Technical structure : EURUSD has broken out of a running triangle with a breakout level around 1.1580–1.1600. The current leg appears to be a third-wave impulse targeting 1.18–1.19, with a larger cup-and-handle projection pointing to 1.2020–1.2220.
Trade plan : Buy pullbacks into 1.17 (50% Fibonacci retracement) or 1.1650 (deeper support) with a stop below 1.1580, targeting 1.18, 1.19, and potentially 1.20+; invalidation below 1.1580 would suggest a corrective structure instead.
Trading the EURUSD breakout? Share your entry levels and wave counts in the comments and follow for more Fed-ECB divergence and technical trade setups.
This content is not directed to residents of the EU or UK. Any opinions, news, research, analyses, prices or other information contained on this website is provided as general market commentary and does not constitute investment advice. ThinkMarkets will not accept liability for any loss or damage including, without limitation, to any loss of profit which may arise directly or indirectly from use of or reliance on such information.

USDCAD: Massive Pullback Incoming or Final Trap?USDCAD is reacting from a major demand area at 1.3720–1.3770, which aligns with:
• the lower boundary of the yearly ascending channel;
• an institutional zone that has been defended multiple times (Q3 and early Q4);
• a daily RSI showing relative oversold conditions;
• a liquidity cluster below the October lows that has now been swept.
The rebound is technically justified, but its sustainability will largely depend on CAD structure (strong in the latest COT data) and on December seasonality, which is historically unfavorable for USDCAD.
The base case is a bullish pullback toward 1.3890–1.3930, followed by renewed downside pressure if macro sentiment continues to support the CAD.
The daily chart highlights:
• Primary trend: still bullish, but undergoing a deep corrective phase.
• Midline channel break → bearish acceleration into the demand area.
• Current price action: sharp rejection with increased relative volume at the lows (typical structural “spring”).
• The 1.3880–1.3930 zone is the first major supply: confluence between previous structure, the last breakdown area, and a psychological pre-pivot region.
Key technical levels:
Support: 1.3720 (demand), 1.3660 (extreme), 1.3570 (macro support).
Resistance: 1.3880, 1.3930, 1.4050.
Technical outlook:
As long as the price remains above 1.3720, the market favors a corrective rebound.
Below 1.3660, price opens the path toward 1.3570.
Seasonality – December
December is historically a bearish month for USDCAD, with negative readings across 20-, 15-, 10-, and 5-year datasets:
• 20-year avg: -0.0014
• 10-year avg: -0.0091
• 5-year avg: -0.0195 (significantly negative)
• Only the 2-year pattern shows a more neutral/volatile structure.
Seasonality takeaway: bearish bias, suggesting the current rebound is more likely a technical pullback rather than the start of a new trend.
COT Analysis (CAD + USD Index)
CAD – COT data (Nov 4, 2025)
• Non-Commercials increased CAD shorts aggressively (+8,288) while reducing longs (-1,180).
→ Indicates speculative CAD weakness in recent weeks.
• Commercials significantly increased CAD longs (+13,164).
→ Typical of institutions accumulating CAD at discounted prices.
Interpretation:
CAD displays a clear divergence: speculators are bearish, while commercials are increasingly bullish. This suggests a potential macro turning point where institutions anticipate medium-term CAD strength.
USD Index – COT data (Nov 4, 2025)
• Non-Commercials increased both longs (+6,038) and shorts (+5,474).
→ Polarized market.
• Commercials increased longs (+1,188).
→ Marginal support for the USD.
Macro COT conclusion:
• CAD: institutional buying pressure.
• USD: indecision and polarization.
Overall COT bias → medium-term bearish USDCAD, although consistent with a short-term corrective bounce.
Retail Sentiment
• Short: 37%
• Long: 63%
Retail positioning is clearly long.
Contrarian interpretation: downside risk remains elevated after the pullback.
Macro Context
• Oil remains volatile but structurally firm → historically CAD-supportive.
• The Fed maintains a cautious stance with potential rate cuts in 2026 → structural pressure on the USD.
• The BoC, although dovish, may delay cuts relative to the Fed → supportive for CAD in the medium term.
Probability 60% – Base Scenario
Pullback toward 1.3880–1.3930 before renewed bearish pressure.
Confirmations:
• Daily close above 1.3820
• Bullish H4 structural shift
Target: 1.3890
Extension: 1.3930
Failure level: below 1.3720.
Alternative Bearish Scenario – Probability 40%
A direct break below 1.3720 → continuation toward 1.3660 and then 1.3570 (macro level).
Confirmations:
• Pullback failure / squeeze
• H4 bullish breakout in oil
• Daily rejection on the USD Index.
USDCAD is currently rebounding within a broader corrective structure.
COT and seasonality do not support a strong bullish reversal, but short-term price action allows room for a move toward 1.39, where institutional interest will likely re-emerge to resume the broader macro bearish narrative.
Barring macro shocks, the preferred structure remains:
corrective rally → short setup at 1.3880–1.3930 → target 1.3720 and potentially 1.3660.

BTC Neutral-Sell: Fade 93-94k, Loot 84k ClusterMarket Overview
__________________________________________________________________________________
Price is hovering in mid-range beneath a sticky 93–94k daily supply, with rallies repeatedly faded and buyers defending the 89.6k/87.8k band. Macro is mildly supportive on dips, but higher‑timeframe momentum hasn’t flipped yet.
Momentum: Bearish-to-range tilt under 93–94k as repeated supply rejections cap bounces.
Key levels:
- Resistances (HTF): 93,100–94,200 (1D supply), 94,800 (4H), 98,330 (W).
- Supports (HTF): 89,600 (240m PL), 87,800 (720m PL), 83,900–84,400 (1D/1H cluster with D PL).
Volumes: Normal on HTF; moderate intraday acting as an amplifier around key retests.
Multi-timeframe signals: 12H/6H/4H trend leaning down while 1D can print countertrend up phases; overall mixed, with rallies best treated as tactical until 93–94k is reclaimed.
Harvest zones: 84,200 (Cluster A) / 76,000–76,800 (Cluster B) — ideal dip-buying zones for inverse pyramiding once reversal prints.
Risk On / Risk Off Indicator context: NEUTRE VENTE — mild risk-off backdrop that confirms the fading-rally environment.
__________________________________________________________________________________
Trading Playbook
__________________________________________________________________________________
The dominant structure is a range with a bearish skew under HTF supply; trade tactically, fade weak rallies, and prepare buy plans at high-confluence floors.
Global bias: Neutral Sell below 93–94k; key invalidation for shorts is a decisive daily close above 94,214.
Opportunities:
- Tactical sell: Fade 93,100–94,200 rejections with weak retests and capped momentum.
- Breakdown sell: Short a 4H/6H close and failed retest below 89,600 targeting 87,800 then 84,400–83,900.
- Dip-buy: Only on clean ≥2H reversal at 84,000–84,400 (Cluster A) or a strong signal at 87,400–87,800 for tactical bounces.
Risk zones / invalidations:
- Break and hold above 94,214 would invalidate the fade-supply short idea and open 95k–98,330.
- Sustained close below 84,000 would invalidate the high-confluence long plan at Cluster A.
Macro catalysts (Twitter, Perplexity, news):
- Fed delivered a hawkish cut and started T‑bill purchases (~$40B/m) — liquidity positive but guidance firm.
- US spot BTC ETFs show net inflows — cushions dips, not a trigger by itself.
- China signaling incremental easing — supportive for risk if it persists.
Harvest Plan (Inverse Pyramid):
- Palier 1 (12.5%): 84,200 (Cluster A) + reversal ≥2H → entry
- Palier 2 (+12.5%): 80,800–79,100 (-4/-6% below Palier 1)
- TP: 50% at +12–18% from PMP → recycle cash
- Runner: hold if break & hold first R HTF (93,100–94,200)
- Invalidation: < HTF Pivot Low 83,900 or 96h no momentum
- Hedge (1x): Short first R HTF on rejection + bearish trend → neutralize below R
__________________________________________________________________________________
Multi-Timeframe Insights
__________________________________________________________________________________
Across TFs, price is coiling under daily supply with lower highs; countertrend pops exist but remain capped unless the 1D lid breaks.
12H/6H/4H/2H/1H: Drift down to neutral-sell; repeated failures into 93–94k and defense at 89,600 then 87,800. Best quality demand sits lower at 84,000–84,400; deeper capitulation interest at 76,000–76,800.
1D: Can print up phases, but only reclaiming and holding above 94,214 would turn supply into support and shift targets toward 95k and 98,330.
Confluences: 84,000–84,400 aligns with the Daily Pivot Low 83,871; overhead 93–94k is multi‑test supply; volumes normal HTF with moderate intraday spikes at tests.
__________________________________________________________________________________
Macro & On-Chain Drivers
__________________________________________________________________________________
Macro liquidity is incrementally supportive (Fed cut + T-bill buys; China easing tone), but the risk regime reads cautious and caps impulsive upside.
Macro events: Fed’s hawkish cut with bill purchases adds modest liquidity; US data mixed (claims higher, trade deficit narrower); China telegraphs ongoing support — net effect: dips cushioned, euphoria capped.
External Macro Analysis: The Risk On / Risk Off Indicator leads with a bearish read, late‑cycle tone, and credit stress flags; this contradicts a clean bullish impulse and supports a Neutral Sell technical bias until conditions flip.
Bitcoin analysis: ETF inflows are constructive and overhead liquidity is thin, but 93–94k remains the gating level; 90k acts as a liquidity magnet; 95k is a higher‑TF “beacon” once 93.2k is reclaimed.
On-chain data: Demand softened, OI lighter, funding neutral; IV compressed — favors mean‑reversion and disciplined harvesting over momentum chasing.
Expected impact: Macro/flows provide a floor on sharp dips, yet risk regime and HTF supply argue for patience — fade weak rallies and harvest high‑confluence floors only on confirmation.
__________________________________________________________________________________
Key Takeaways
__________________________________________________________________________________
BTC remains range‑bound with a bearish skew under 93–94k while macro liquidity offers limited cushioning.
- Trend: Neutral/bearish until 94,214 is reclaimed; expect probes lower inside the range.
- Setup: Fade 93–94k failures; prepare a disciplined inverse‑pyramid buy at 84,000–84,400 with ≥2H confirmation.
- Macro: Fed T‑bill buys and ETF inflows cushion dips, but the risk regime is still Neutral Sell.
Stay tactical like a seasoned dungeon runner — conserve stamina in the grind and strike on high‑confluence reversals.
Title ideas
- BTC Neutral-Sell: Fade 93–94k, Loot 84k Cluster
- Bitcoin Range Grind: 94k Cap, 84k Harvest Plan
- BTC Playbook: Tactical Fades Now, 84k Buy Later

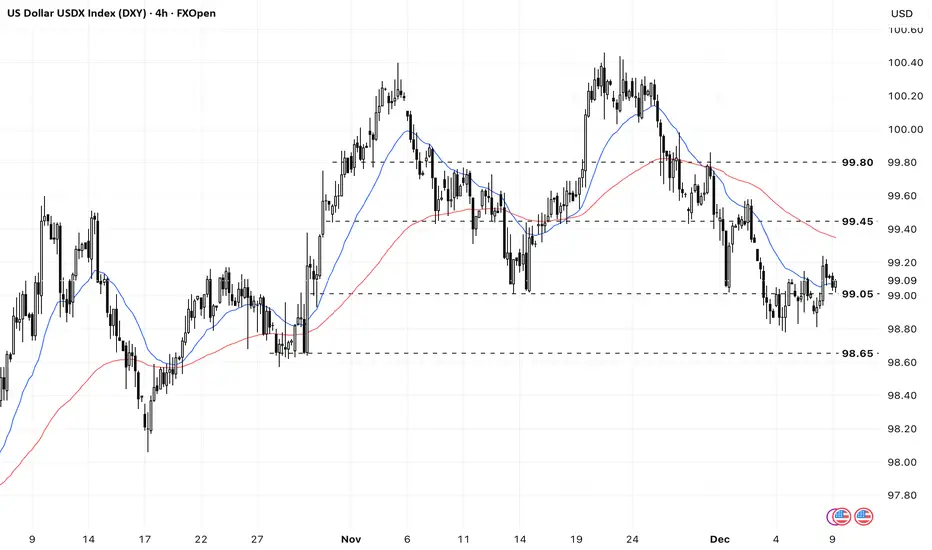
DXY rebounded slightly due to the expectation more hawkish FedThe US dollar rebounded after the recent weakness due to increased odds of a rate hike at tomorrow's meeting.
Meanwhile, today's US October JOLTS data may offer further clarity on the labor market following the delayed October NFP. Markets are anticipating the JOTLS to fall to 7.2 million, which could contract the job openings per unemployment rate under the 1.0 level and add further concern about the labor market, despite a low unemployment rate.
DXY breached 99.00 and EMA21. The index remains between the bearish EMAs, indicating potential consolidation.
If DXY breaks below 99.00 again, the index could retreat toward the next support at 98.65.
Conversely, if the DXY moves above the EMA78, the index may advance toward the next resistance level at 99.45.