GOLD → Growth may continue after correction...FX:XAUUSD is trading in a sideways range amid mixed signals: weak macro data and concerns about an AI bubble are supporting the metal, but the moderate strengthening of the dollar is limiting its growth...
Fundamental situation
• Weak data from China: industrial production and retail sales showed the lowest growth in several years.
• Mixed data from the US: NFP for November: +64K (better than forecast), but October revised to -105K. Unemployment rose to 4.6%.
• Expectations of Fed policy easing remain, especially against the backdrop of the possible appointment of a new “dovish” chair (Christopher Waller is being considered).
The fundamental backdrop remains favorable for gold, but new triggers are needed to break out of the range. Attention is shifting to US inflation data, which will set the direction before the end of the year.
Technically, gold may test key support before attempting to rise to retest 4335-4350.
Resistance levels: 4335, 4353, 4380
Support levels: 4311, 4300, 4329
The trend is bullish, and the fundamental background is favorable. If the bulls keep the price above 4320-4310 within the current correction, the growth may continue...
Best regards, R. Linda!
Fibonacci Retracement

GOLD - Retest of key support ahead of newsFX:XAUUSD is falling during the Asian session, retreating from $4,350 — its highest level since late October — amid optimism over a peace agreement between Russia and Ukraine and ahead of US employment data.
Trump's statements about the approaching peace agreement are reducing demand for safe-haven assets. The probability of a Fed rate cut in January is about 77%, with two easing measures expected in 2026. Expectations of a dovish Fed chair appointment continue to put pressure on the dollar.
• Today, October NFP data will be released, which may confirm the weakening of the labor market
• On Thursday, US inflation data will be released
The current decline looks like a correction and profit-taking. The uptrend remains intact unless employment data exceeds expectations. Any further decline could be seen as a buying opportunity
Resistance levels: 4292, 4317
Support levels: 4265, 4255
If the news is positive, which will only reinforce expectations of an aggressive rate cut, gold's growth after retesting key support may continue. Otherwise, the correction may continue. However, the 4265-4255 area plays an important role and needs to be monitored.
Best regards, R. Linda!

ATOM/USDT short-term🔍 Market Structure
Clear downtrend – price is moving within a descending channel (lower highs and lows).
Each bounce is sold at the upper band of the channel.
No signal of a change in structure yet (no HH + HL).
📉 Current Price Status
Price is at the lower end of the channel.
Consolidation after a downward impulse → typical bearish continuation or short technical rebound.
Current Zone:
~2.02–2.05 USDT – local support + demand reactions.
🟢 Key Levels
Support
2.049 – local support (current reaction)
1.999 – strong psychological support
1.951
1.878 – lower demand zone (important!)
Resistance
2.099
2.125
2.201 – key resistance / S→R flip.
Upper channel line (~2.20–2.23)
📊 Stochastic RSI
Oscillator often in oversold territory.
Currently recovering from the low → possible short rebound.
BUT: in a downtrend. The Stoch RSI is not a long-term signal.
➡️ More likely a pullback, not a trend change.
🧠 Scenarios
🔴 Baseline scenario (most likely)
Bounce to:
2.09 → 2.12
Rejection + further decline:
1.99
then 1.95 / 1.88
➡️ Short at resistance levels in line with the trend.
🟢 Alternative scenario (less likely)
Breakout of 2.20 + close of the 1H candle above the channel
Retest from above
Then targets:
2.28
2.35–2.40
➡️ Only then can we talk about a change in structure.

GOLD - A pullback ahead of the news. Will there be growth?FX:XAUUSD is hitting resistance at 4350-4360 and forming a correction amid expected inflation and initial jobless claims data
Mixed US employment data supports expectations of Fed policy easing. The market is pricing in two rate cuts in 2026 versus one in the Fed's forecasts, which supports the bullish trend for the metal.
Today's US CPI release will be a key trigger for reassessing the Fed's rate trajectory.
Expectations of tighter policy from the Bank of Japan and market reassessment are creating overall caution.
A short-term correction in gold is possible, but the overall uptrend remains intact amid the Fed's dovish monetary policy and global uncertainty.
Resistance levels: 4337, 4353
Support levels: 4311, 4300
Technically and fundamentally, the situation is favorable for continued growth. Corrections allow the market to gather liquidity before movement, however, there is news ahead that will determine further movement. I expect a retest of 4311 - 4300 before growth to 4353 - 4380.
Sincerely, R. Linda!

ETHEREUM - Hunting for liquidity before the decline continuesBINANCE:ETHUSDT quickly returned to its decline after a short squeeze based on market manipulation and updated its low to 2805.
Looking at the daily timeframe, we can see that ETH is in a downtrend. An attempt to break the bearish trend resulted in another decline, which has been going on for more than a week.
Bitcoin fell victim to the reverse Christmas rally yesterday and formed a rather interesting daily bar on Wednesday, indicating a weak market.
Global and local trends are downward. Ethereum is pausing after a bearish rally. The 2805 pause zone could trigger a correction to the zone of interest — the border of the previously broken consolidation zone of 2890-2936.
Resistance levels: 2890, 2940, 2975
Support levels: 2805, 2715
A countertrend movement may form a false breakout before a further decline. Given the current technical situation, it is not rational to consider buying. We are looking for opportunities to sell...
Sincerely, R. Linda!

USDJPY - Triangle (consolidation before news) FX:USDJPY formed a false breakout of the symmetrical triangle consolidation support. An ideal maneuver ahead of the news and expectations of a positive outcome for the JPY.
“The Bank of Japan may raise interest rates for the first time in 11 months at its meeting on December 19.” Against this backdrop, the currency pair may test the 156.00 area before a possible decline if the Bank of Japan takes this step. The Japanese national currency may strengthen, putting pressure on the dollar, which has been rising since yesterday's US session...
Technically, the zone of interest for a decline is 156.0. A false breakout is possible before a decline to support.
Resistance levels: 156.10
Support levels: 155.0, 154. 5
The strengthening of the yen may put pressure on the dollar. But again, it is worth paying attention to the context regarding the policy of the Japanese regulator. Further movement depends on the news.
Best regards, R. Linda!

BITCOIN - The downward trend may continue. Focus on 88KBINANCE:BTCUSDT.P failed to realize its bullish potential associated with positive news. Is crypto winter getting closer and closer?
Fundamentally, despite the rate cut and a relatively positive overall backdrop, the market continues to fall. Bears held the 95k resistance and the 90k zone. Bitcoin is breaking the consolidation support and entering a distribution phase. The decline has been temporarily halted by support at 85,500, and the market may correct to 87,000-88,000 (the break-even zone) before continuing its decline within the current trend. The target the market may strive for is 84K-80K.
Resistance levels: 87,000, 88,000, 90,000
Support levels: 85,560, 83,800, 80,000
If the market continues to lack support or no bullish driver emerges, the price may fall even lower. I expect a retest of the zone of interest (the support area of the trading range) and a further decline to key levels...
Best regards, R. Linda!

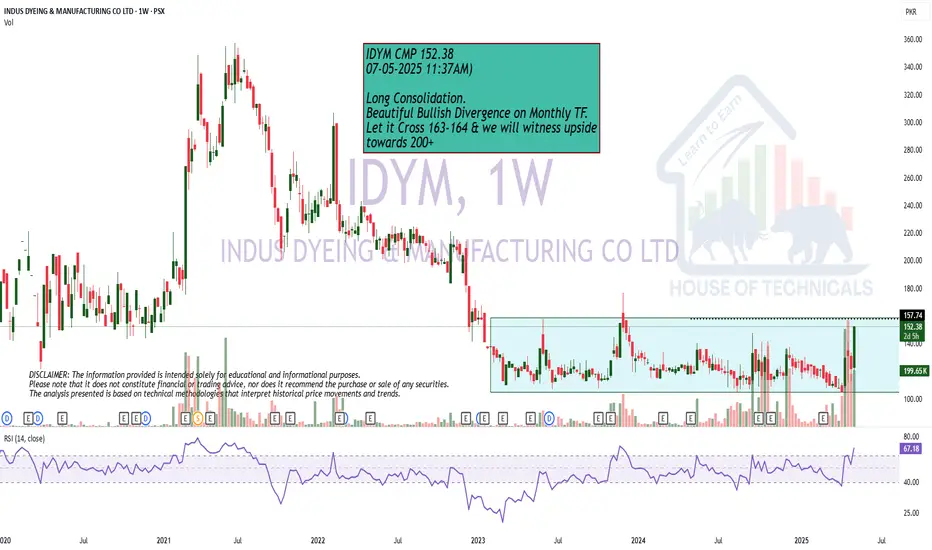
Near BreakoutLong Consolidation.
Beautiful Bullish Divergence on Monthly TF.
Let it Cross 163-164 & we will witness upside
towards 200+
AUDUSD — Counter-Trend ABC Breathing Inside a Bearish HTF WCLPrice is currently trading inside a fresh bearish higher-timeframe WCL , so any upside here is treated as corrective, not a trend flip.
Within that context, a clean bullish ABC has formed.
B held structurally, displacement followed, and the move left behind a breaker block + FVG , which defines my area of interest.
The idea is simple:
If price revisits this zone and respects it, the path of least resistance is a continuation of the correction toward the ABC C-target , before deeper HTF supply comes into play.
Invalidation is clear.
A break below B kills the sequence entirely.
This is a location-first setup —not a prediction, not a signal.
Always wait for confirmation and trade in alignment with higher-timeframe context.
Not financial advice.

Silver Fibonacci Analysis 03/02/2021simply showing the power of Fibonacci
we had seen a Bullish Divergence and Hidden Bullish Divergence on MACD and by the confluences of 4 Fibonacci tools (Retracement, Extension, Projection, Time Zones) in an ascending Chanel...
So we are
Speculating...$$$
A TP Zone Starting from 39.43$ to 41.16$
a Safe and Sure TP can be 39.43$
It is a Swing Trade and it Shall take Few weeks time to develop.
I am expecting the TP to happen at middles of April 2021,
Please thanks Me In the Comments when you enjoyed your 125250 PIPS of Joyful Profits.

GOLD → Consolidation before reaching ATH FX:XAUUSD has been rising for the fifth consecutive day amid a weakening dollar and expectations of a dovish Fed policy. The market is testing intermediate resistance before reaching ATH.
The Fed cut rates by 25 basis points, but the market expects two cuts in 2026, not one, as stated in the regulator's forecasts. The possible appointment of a new “dovish” Fed chair is putting pressure on the dollar. The increase in US unemployment claims (to 236K) confirms fears of a slowdown in the labor market.
Tomorrow, US employment (NFP) and retail sales data will be released, followed by inflation (CPI) data on Thursday. Friday: Bank of Japan decision.
The results could significantly adjust expectations for interest rates.
The upward trend in gold continues, but its stability will be tested by macro data. Weak employment and inflation figures will support growth, while strong data could trigger a correction.
Resistance levels: 4353, 4380, 4400
Support levels: 4329, 4305
The market may consolidate before breaking through the nearest resistance. Locally - 4333, 4329, 4318. The bullish trend may continue afterwards.
Best regards, R. Linda!

XAGUSD (Silver) – 1-Hour Timeframe Tradertilki AnalysisMy friends, good morning,
I have prepared an XAGUSD-Silver analysis for you on the 1-hour timeframe.
My friends, if XAGUSD-Silver reaches the levels between 60.69393 and 60.11226, I will open a buy position and target the 63.16603 level.
My friends, I share these analyses thanks to each like I receive from you. Your likes increase my motivation and encourage me to support you in this way.🙏✨
Thank you to all my friends who support me with their likes.❤️

GBPUSD - Consolidation above uptrend support FX:GBPUSD is consolidating above the support of the uptrend. Growth is facilitated by the decline in interest rates in the US.
The dollar has broken the trend and is falling under pressure from falling interest rates. GBPUSD is in an uptrend and testing key support. A long squeeze could trigger growth
The trend is upward, after updating the maximum to 1.3438, a correction is forming, within which MM is testing the break-even and interest zone of 1.3355. If the bulls hold their defense above key support, this action will support the growth of the trend.
Resistance levels: 1.3438
Support levels: 1.3355
Focus on the mirror support zone of 1.3355, which plays a fairly important role in the current uptrend. Consolidation above this zone and local confirmation of the end of the correction could trigger further growth.
Best regards, R. Linda!

ETH/USDT 1D CHart Long-Term.
🔍 Market Structure (Price Action)
1️⃣ Trend
Long-term: The uptrend has been broken (a downward breakout from the black trend line).
Medium-term: A sequence of lower highs and lower lows → a downtrend.
The current rebound is a correction in the downtrend, not a confirmed reversal.
📐 Key Levels (very well marked)
🔴 Support
2768 USDT – key support (current local bottom).
2157 USDT – final support from the previous structure (if 2768 breaks → a very real pullback).
🟢 Resistance
3506 USDT – current nearest resistance (retest after a downward breakout).
4101 USDT – strong supply zone + former support.
4477 USDT – main structural resistance (region of previous highs).
👉 Price is now exactly in the decision zone between 2768 and 3506.
📉 Trendline
Breaked and rejected (retest ended with a decline).
This is a classic signal of a downtrend continuation.
Until the price returns above 3506 and sustains, there is no uptrend.
📊 Stochastic RSI
The oscillator frequently reaches the 80–100 zone.
Currently: Moving out of overbought → signal of weakening upward momentum.
No bullish divergence → no confirmation of a trend change.
🧠 Scenarios
🐻 Baseline scenario (more likely)
Rejection of 3506
Return to around 3000 → 2768
Breakthrough of 2768 = open path to ~2150
🐂 Alternative (conditional) scenario
Daily close above 3506
Retest of 3506 as support
Only then is a move towards 4100 possible
🎯 Final conclusions
This is not a market for longs without confirmation.
The current rebound looks like a pullback in a downtrend.
Safeest:
Short at resistance (3506 / 4101)
Long only after a breakout and holding of 3506

GOLD - Distribution phase. Target - ATH (4380), 4400...FX:XAUUSD is rallying after breaking through consolidation resistance. The fundamental background is positive, with the train heading for an all-time high.
Expectations of a soft Fed policy remain, with the market pricing in two rate cuts in 2026. India's pension fund regulator has allowed investments in gold and silver ETFs. An increase in US unemployment claims (+44,000) has heightened fears of a slowdown in the labor market.
A reversal in the Bank of Japan's policy (rate hike) and a pause by the ECB are boosting the appeal of gold.
Any correction is likely to be short-term and will be met with support from buyers. The baseline scenario remains bullish amid soft monetary policy and a weakening dollar.
Technically, it is dangerous to sell in the current market; it is worth looking for buying opportunities after corrections or pullbacks...
Resistance levels: 4325, 4335, 4380
Support levels: 4300, 4285, 4265
The rally phase is quite aggressive due to the long period of consolidation that the market has been in. All possible factors are supporting growth. In such a market, one can only buy on pullbacks. I expect a pullback from the indicated zone, within which growth to ATH can be considered.
Sincerely, R. Linda!

BITCOIN → Downward trend pressure. 86K - 84K?BINANCE:BTCUSDT.P sold off all the gains associated with Tuesday and Wednesday's news. Technically, a false breakout of resistance is forming against the backdrop of a downtrend. There is no fundamental support.
Bitcoin failed to consolidate above 91800 - 94200, a false breakout was formed, and the price returned to the range. There is an imbalance zone on the chart, which the price may test before falling (weak technical and fundamental background).
The trend is downward in the medium term. A countertrend correction is forming, within which the market is facing pressure in the 94K - 95K zone. Zone of interest is 91850. I expect a retest, liquidity capture, and another phase of selling down to 88K - 86K.
Resistance levels: 91850, 92500
Support levels: 89550, 87980, 86260
The price is in the trading range of 84K - 94K. Resistance has been tested, and a double top reversal pattern has formed. Currently, a distribution phase is forming relative to the specified pattern and consolidation at 91850 - 94200. A retest of the nearest resistance could trigger a rebound and cause the price to fall further to the next zone of interest.
Best regards, R. Linda!

Ascending Channel | Golden Zone Retracement SetupAfter analyzing the chart on the 2-hour timeframe, price action has been moving within a well-defined ascending channel since Tuesday, 25 November 2025. The upper boundary of the channel has been consistently respected, confirming the strength and validity of this bullish structure.
Following a rejection from the upper boundary, price is currently trading around 1.17403. At this stage, the market appears to be developing a bearish corrective structure, resembling either an upper flag formation or a falling broadening wedge, which is still in progress and not yet completed.
Based on this structure and overall market behavior, we anticipate a potential retracement toward the Fibonacci Golden Zone, which aligns with our projected price target. This area may act as a key decision zone for the next directional move, especially if supported by price action confirmation and volume reaction.
Traders should monitor price behavior closely around the channel boundaries and Fibonacci levels for high-probability setups.
Happy Trading
SpicyPips

GOLD → Positive fundamental background. Focus on 4200 FX:XAUUSD is testing the $4,250 level amid news momentum related to interest rate cuts. The fundamental backdrop is improving, with the dollar entering a downward trend...
The Fed cut rates by 25 basis points to 3.75%, as expected. Powell's tone was cautious rather than hawkish, which weakened the dollar and Treasury yields. The market expects two rate cuts next year, compared to one in the Fed's forecasts
- Focus has shifted to US employment data (jobless claims). The next key risk will be next week's NFP data.
The Fed's decision provided support for gold, but for growth above $4250, confirmation of a weakening labor market in upcoming reports will be needed. Technically, the focus is on the 4200-4220 zone.
Resistance levels: 4220, 4250, 4260
Support levels: 4200, 4180, 4175
Consolidation above 4200 will confirm the bullish sentiment, while a breakout and consolidation above 4220 will open up a new chance for growth towards the resistance of the range.
I do not rule out the possibility of a retest the support of the range at 4181 before moving up (the price is still in a sideways trend).
Best regards, R. Linda!

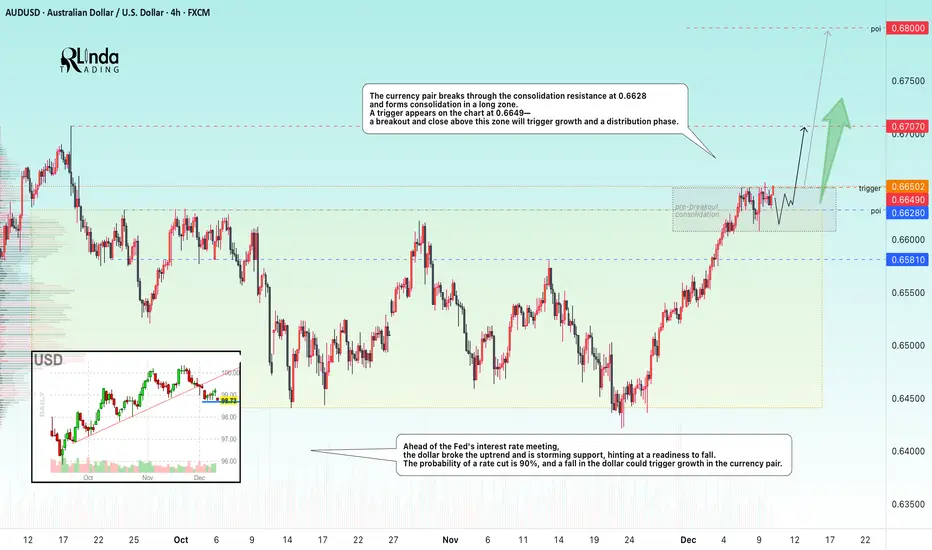
AUDUSD → Readiness for distribution within the uptrend FX:AUDUSD breaks through the resistance of a wide trading range (consolidation) and is preparing for growth. Important news ahead...
Ahead of the Fed's interest rate meeting, the dollar broke its upward trend and is storming support, hinting at a readiness to fall. The probability of a rate cut is 90%, and a fall in the dollar could trigger growth in the currency pair.
The currency pair is breaking through the consolidation resistance at 0.6628 and forming consolidation in a long zone. A trigger of 0.6649 appears on the chart - a breakout and close above this zone will trigger growth and a distribution phase.
Resistance levels: 0.6649, 0.67, 0.68
Support levels: 0.6628, 0.6581
Before rising, the price may test support (the previously broken trading range boundary). However, a breakout and close above 0.6649 could trigger a distribution phase towards 0.67-0.68, especially against the backdrop of a weak dollar...
Best regards, R. Linda!
XAUUSD – Post FOMC | ChumTrades Daily PlanXAUUSD – Post FOMC | ChumTrades Daily Plan
Market Context
• Strong rejection at 4245 → buyer momentum weakening.
• Prefer selling at premium zones, buying at lower demand zones.
• Expect gold to continue ranging within 4245 ⇆ 4180.
🔻 SELL Zones
1) Main SELL Zone: 4238–4245
Entry: 4238–4245
SL: 4255
TP1: 4225
TP2: 4204
TP3: 4180
2) SELL SCALP: 4230–4233
TP: 4218–4210
SL: 4237
🟢 BUY Zones
1) BUY SCALP: 4188–4190–4192
TP: 4210 → 4218 → 4230 → 4240
SL: 4278
2) Main BUY Zone: 4163
SL: 100 pips
TP: 100 / 200 / 300 pips
RR: 1 : 3
🎯 Bias
• Below 4245 → market favors sideway–down movement.
• Only a breakout above 4265 signals a potential bullish shift.
If you find this plan helpful, please leave a like and follow ChumTrades for daily plans & realtime updates!
Feel free to drop your own market view in the comments so we can discuss together.

ChumTrades XAUUSD M15 intraday outlook Market Context
Price is currently ranging in a very tight consolidation.
Momentum is weak → market favors intraday range trading rather than chasing breakouts.
Short-term structure remains intact; focus on price reaction at key levels.
Daily Strategy
Main approach: trade the range, trade the reaction.
Buy at predefined support / Fibonacci zones, sell at clear resistance.
If a breakout occurs, wait for a retest before following the move.
Avoid entries in the middle of the range.
Key Buy Zones
4246 – 4244 (Fibo 0.5)
4236 – 4233 (Fibo 0.618)
4210 – 4208 (deep support reaction)
❌ Bullish structure invalidation:
M15 close below 4200
Key Sell Zones
4300 – 4305 (psychological resistance)
4310 (Fibonacci extension – reaction sell)
Special Notes (Friday)
No major economic news today, but it is Friday – end of week.
Price action may become choppy and unpredictable, especially during the US session (a pattern seen in recent weeks).
Risk management is key:
Focus on short-term trades
Take profits early
Avoid holding positions over the weekend.
Good luck bro!

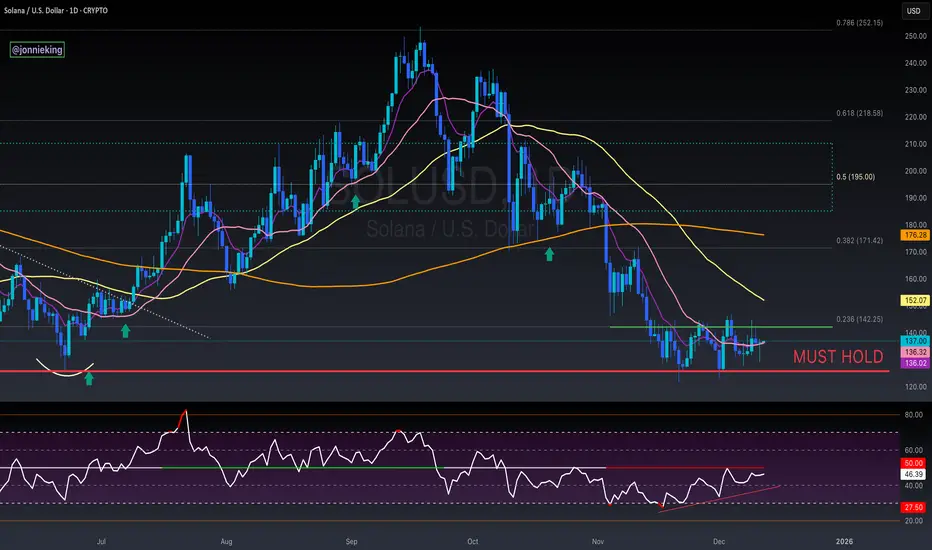
$SOL Stuck In ConsolidationSolana has been stuck in this consolidation range the past month ~$125 - 145
Truly an infliction point for CRYPTOCAP:SOL
a break in either direction should be massive upside or downside.
HOPIUM: bullish divergence appears to be forming on the RSI
Solana Breakpoint just kicked off today, but the market showed very little interest.
Bulls need a huge injection here.
TECHNICAL ANALYSIS BNB/USDT1️⃣ Market Structure and Trend
The chart shows a long-term uptrend, confirmed by a very clean ascending trendline (orange), which has been acting as dynamic support for over a year.
After a strong breakout to ~1380, the price began a correction but still hasn't broken the higher low structure → the uptrend is intact.
2️⃣ Key Levels (exactly from your chart)
🟢 Resistance Levels (green):
~1018 USDT
~1150 USDT
~1249 USDT
These are potential targets for a renewed uptrend.
🔴 Support Levels (red):
~879 USDT – the closest important support
~838 USDT – a key defensive level
~683 USDT – deep support / last HTF trendline
The price is currently trading directly above the first support level.
3️⃣ Trendline (orange)
Your trendline is:
strong, multi-point
drawn on the D1 timeframe
currently around 850–880 USDT
➡️ If the price falls, the trendline perfectly aligns with the 838–879 zone, strengthening this zone as a "must defend."
4️⃣ Oscillators – Stoch RSI (bottom)
Currently:
The oscillator is in a high zone (above 80) → indicating local overbought
However, there is no clear downward crossover yet.
Meaning:
👉 Upward momentum is still active, but we are closer to a local high than a low.
5️⃣ Scenarios
🟢 Upside scenario (more likely as long as the trendline holds)
Condition: Maintaining the 879/838 levels and the trendline.
Targets:
1018 USDT – first resistance
1150 USDT – important medium-term resistance
1249 USDT – main HTF target
The longer the price consolidates above the orange trendline, the greater the chance of a renewed attack on 1150–1249.
🔴 Downside scenario (less likely, but crucial)
Condition: Downside breakout of 838 USDT and closing of the D1 candle below the trendline.
Then:
the market could enter a deeper correction phase
the target would be the 683 USDT level – this is also the main support level, where reactions were previously strong
This is a "capitulation" scenario, but it doesn't seem to be dominant given the current price action.
6️⃣ What can we see on the chart "here and now"?
✔️ The price has rebounded from the local low
✔️ It is still between support at 879 and resistance at 1018
✔️ The uptrend is intact
✔️ A potential HTF higher low has formed
✔️ The Stoch RSI shows momentum, but caution is warranted
➡️ The market is consolidating within the uptrend, with a high chance of a breakout upwards – provided support is maintained.
