Bitcoin - Bear flag, 74k confirmed! (warning, must see)Bitcoin has just completed its bearish flag formation. What now? The probability of going down is now around 70%, while the probability of going up is only 30%. Many times we see a bullish breakout of a bear flag. How does it look? Something like that:
We see that for a bullish breakout, the bulls need to completely go above the flag's resistance, which is much harder than simply going down, especially in a strong bear market, like in this Bitcoin's case.
Bitcoin's price and development are completely controlled by the banks and huge institutions that control this planet. To make money, you have to identify their actions on the chart.
On the chart we can also see a completely unfilled FVG (Fair Value GAP). Precisely between 90600 and 92060. There is a possibility for Bitcoin to partially or completely fill this GAP before starting the upcoming drop! Longs are riskier at this point, because we want to trade with the bearish trend. But if the price increases in the short term, we can have a much better entry point for our short position on futures. It's also a possibility to retest the long-term blue trendline from the all-time high.
From the Elliott Wave point of view, this bear flag seems to be a complex corrective pattern. To be honest, I don't see any signs of strength, such as an impulse wave or a leading diagonal wedge pattern. I am currently bearish on Bitcoin, and I expect a pretty significant drop in the coming weeks! Especially January is statistically an extremely weak month for Bitcoin.
Write a comment with your altcoin + hit the like button, and I will make an analysis for you in response. Trading is not hard if you have a good coach! This is not a trade setup, as there is no stop-loss or profit target. I share my trades privately. Thank you, and I wish you successful trades!
Flag

NQ 24,958 TargetShorting NQ from the 35,317.5 or so will obviously need to adapt and adjust as time goes on reference my previous post for levels

USDJPY Shorting IdeaThis Trade idea is inspired by Wyckoff Heuristics
& Common Smart Money Knowledge.
My prediction with JPY Rates ahead of time, beginning to gather strength
we will first begin with a campaign that requires the build up to drop
The floor to lower prices as mentioned in the format of the chart.
Updates soon as time developes toward Thurdays Japanese Yen Interest
Rate Decisions

Is everyone too bearish on BTC? Up to $108k before down?Everyone is extremely bearish on BTC here calling for new lows, but the chart and indicators don't look like they support a move straight down.
Even though we're technically consolidating in a bear flag, I don't think we actually break to the downside (yet).
To me, it looks like we should see a large bounce first up to the $103k-108k range, then I think a larger downside move can play out down to the lower support levels.
The reason why I don't think we see a move straight down is because we're so oversold on high timeframes (weekly) and we're still above key support levels. It makes more sense to me to see a fake out move up that makes everyone bullish again before we see the large move down.
As long as we remain above that $86.1k support level, then I think this is a strong possibility of an outcome.
Let's see if we can hold that level and how it plays out.

ON LongFlag pattern in uptrend
Long entry 54
Stop 52
Target 63, 78
Risk management is much more important than a good entry point.
I am not a PRO trader.
In my trading plan, the Max Risk of each short term trade should be less than 1% of an account.

Simple projectionJust a simple flagpole downside projection. I think NASDAQ:MSTR is signaling EXTENDED weakness with the bitcoins

ITA40 SHORTSTwo scenarios
PA around a hook point, a retrace followed by a bear flag Or
PA at VA then a H1/H4 retrace would be an ideal entry

BTC Short - Follow the trendBTC looks good for short continuation targeting previous liquidity lows around 74,300.
Stop placement would be around 95,500 - let thy trend be thy friend.

I dont make the rules, watch the bear flagbear flag top is based on 10 year trend line (Thick black line). I'm waiting to see where it breaks. Could be violent either way.


Gold continuation underway?On a 4 hour time frame, looking like we potentially completed a reacc model.
Price potentially continuing to retest and blow through highs.
Will be looking for entries on day trades in the green highlighted area if we start to squeeze.
Ultimate target will be the 1.61 fib of the range. (I use fibs as targets when we are running blue skies.
I will want to see us riding the 10EMA on the hour, entries will be made on the 1 min on flag breakouts while above and riding the 10EMA on the 1 min.

GOLD LONG HAS PROVENGold is moving guys like I had mentioned in the previous market breakdown. The higher degree market structure showed that Gold is preparing toward pushing to the all time highs. Hope you caught the set up or took the lower degree continuation.

Bitcoin at Critical Resistance — Bull Trap!?Over the past couple of hours, Bitcoin ( BINANCE:BTCUSDT ) has surprised many traders—including myself—with its sharp movements. The potential reason behind this could be an anticipated interest rate cut tomorrow. However, the recent JOLTS Job Openings did not fully align with that expectation.
With our technical analysis tools, we can delve deeper into Bitcoin’s next moves. The key question is whether Bitcoin will maintain its recent bullish momentum or if a reversal is imminent.
It’s important to note that in the next 24 to 48 hours, we may see increased volatility in the financial markets, particularly in crypto. Therefore, it’s wise to practice good risk management—or even consider staying on the sidelines until the market settles.
At the moment, Bitcoin has managed to break through resistance lines, but the volume of this breakout hasn’t been particularly high. Bitcoin is also near a resistance zone($94,850-$93,000), monthly pivot points, and significant levels of Cumulative Short Liquidation Leverage($98,260-$94,600), all of which add to the complexity.
High sell orders: $96,000-$94,800
From a classical technical standpoint, there’s potential for a bearish flag pattern forming. As long as Bitcoin remains below $100,000, this scenario remains plausible.
From an Elliott Wave perspective, it seems that the main Wave B has completed, and we’re likely looking at a ZigZag correction(ABC/5-3-5). This correction might complete either at the resistance zone($94,850-$93,000) or near the daily 50_SMA(Daily).
Considering that the S&P 500 index ( SP:SPX ) is also showing a bearish trend, it’s more likely that Bitcoin’s main corrective Wave C will complete within these resistance levels.
Also, the USDT.D% ( CRYPTOCAP:USDT.D ) remains a crucial factor. Until it hits around 5.49%, the overall crypto market is likely to remain bearish.
In conclusion, I expect that Bitcoin will continue its downward movement, potentially testing $89,000 and even dropping below $85,000. This could represent a significant bearish phase for Bitcoin.
What are your thoughts? Do you think Bitcoin will maintain this bullish momentum, or are we headed for more downside?
Cumulative Long Liquidation Leverage: $89,430-$88,750
Cumulative Long Liquidation Leverage: $83,900-$82,400
First Target: $90,300
Second Target: $87,503
Stop Loss(SL): $100,020(Worst)
Points may shift as the market evolves
💡 Please respect each other's opinions and express agreement or disagreement politely.
📌Bitcoin Analysis (BTCUSDT), 4-hour time frame.
🛑 Always set a Stop Loss(SL) for every position you open.
✅ This is just my idea; I’d love to see your thoughts too!
🔥 If you find it helpful, please BOOST this post and share it with your friends.

EURJPY: Another Bullish Confirmation
EURJPY violated a resistance of a horizontal bullish flag
pattern on a 4H time frame.
It provides a strong intraday bullish confirmation.
I expect a rise at least to 183.1 level.

EURJPYBullish momentum continues as accumulation is in progress for a possible continuation pattern flag setup towards the target of 184.423.

EURUSDcup&handle formation with trend in bullish keeping in mind that DXY is bearish which is pre-absorbing the FED expected cut. Divergence formed for the price to retrace till top of the cup and bounces back. Expectation are towards the cup&handle projection.

AEVA Macro Setup: Textbook Bull Flag Breakout on Weekly ChartExecutive Summary: A High-Probability Continuation Play
We are currently tracking a massive technical setup on Aeva Technologies (AEVA) . After a parabolic impulse move of over 1,400% earlier this year, the stock has spent the last few months in a healthy, controlled consolidation phase.
The structure is now complete. The charts are signaling that the consolidation is over, and the next leg of the primary bullish trend is beginning.
Below is a detailed technical and structural analysis of why AEVA presents one of the most attractive risk/reward ratios in the market right now.
________________________________________
1. Market Structure: The "Bull Flag" Mechanics 🏳️
To understand where price is going, we must understand where it has been. The chart is forming a classic Bull Flag / Falling Wedge pattern on the Weekly Timeframe.
Phase 1: The Impulse (The Pole):
The initial rally from $2.50 to $35.60 was driven by institutional demand. This aggressive buying created a "change of character" in the stock, signaling a long-term trend reversal.
Phase 2: The Consolidation (The Flag):
For the past few months, price has drifted lower in a contained channel (marked by the yellow trendlines). Crucially, this sell-off was low volume . This indicates a lack of aggressive selling pressure. It was merely profit-taking by short-term traders, while long-term holders maintained their positions.
Phase 3: The Breakout (Current State):
Price is now breaking above the upper resistance of the wedge. This signals that the supply has dried up, and buyers are stepping back in to push prices higher.
________________________________________
2. Multi-Timeframe Confirmation 📊
A breakout is only as good as the indicators backing it up. We have strong confluence here:
A. Volume Analysis:
Volume is the fuel of any move. Notice the volume profile:
1. High volume during the initial rally (Accumulation).
2. Declining volume during the pullback (No supply).
3. Surging volume on the current breakout candle.
This sequence confirms that "Smart Money" is supporting the current move.
B. Momentum (Weekly MACD):
The MACD indicator on the weekly chart provides a powerful signal. The histogram is flipping bullish, and the signal lines are curling upward for a bullish crossover. Historically, weekly MACD crossovers on momentum stocks lead to multi-week or multi-month rallies.
________________________________________
3. Strategic Targets & Trade Management 🎯
Given the volatility of AEVA, we are using structural resistance levels rather than purely theoretical projections.
🛑 Stop Loss (Invalidation):
A weekly close back inside the wedge structure (below $14.00 - $14.50 ) would invalidate the breakout thesis.
✅ Target 1: The Test ($35.00 - $35.60)
The first major objective is a retest of the previous cycle high. The stock must prove it can clear the supply zone where sellers stepped in last time. Reaching this level represents a potential ~100% gain from current prices.
✅ Target 2: Blue Sky Breakout ($45.00 - $50.00)
If the stock clears $35.60 with volume, there is no overhead resistance. Using Fibonacci extensions, the next psychological targets sit at the $45 and $50 levels.
________________________________________
4. The Fundamental Catalyst (LiDAR)
Technical analysis tells us "when," but fundamentals tell us "why." The LiDAR and Autonomous Driving sector is waking up. As AEVA moves towards commercialization with major automotive partners, the market is pricing in future growth. The technical breakout is likely leading the fundamental news cycle.
💡 Conclusion
This is not a random movement. It is a structured, textbook technical pattern supported by volume and momentum. For traders looking for asymmetric upside, AEVA offers a pristine setup.
Disclaimer: This analysis is for educational purposes only. I am not a financial advisor. Please manage your risk and trade according to your own plan.

AUDNZD (BUY SIGNAL)(AUDCAD)- Currently at a strong area of support and the weekly has been pushing up for the pass months now, at a daily AOI so targeting a daily AOI.

Bear Flag BreakdownHIMS has been trading inside a bear flag / rising wedge structure following a strong downside move. The recent candles show a clean breakdown beneath the lower trendline, signaling the pattern may be completing and momentum could continue lower.

What's up with Nokia? Bullish PredictionNYSE:NOK
Nokia is predicted to continue the positive market response confirmed by bullish flag pattern.
If the analysis is relevant, Nokia should be hit on target $8.70 at the end of January 2026

Bitcoin - Sell this upcoming pump! New Bear Flag - Target 74k!I am currently bullish on Bitcoin in the short term, and I believe Bitcoin will hit 96k, probably this week. The current price is around 91k, so this is definitely a good opportunity to sell or open a short position at 96k on futures because later this month/in January Bitcoin will most likely continue in a downtrend and hit 74k!
74k (74,508) is a significant swing low from April 2024. There is no doubt that a lot of retail traders have their stop losses placed exactly below this swing low. This acts like a strong magnet for huge institutions, hedge funds, and big banks (market makers). It's no longer a secret that Bitcoin's development and Bitcoin's price are completely controlled by these lizards. But let's take a look at the short-term prediction.
What we can see on the daily chart or on the 12h chart is a bear flag formation. This bear flag is so nice and almost textbook perfect! Inside the bear flag we have a WXY corrective pattern (3x ABC or 3x WXY). I think that this is a strong indication that the downtrend we see from the all-time high (126k) will likely continue in the next weeks.
Write a comment with your altcoin + hit the like button, and I will make an analysis for you in response. Trading is not hard if you have a good coach! This is not a trade setup, as there is no stop-loss or profit target. I share my trades privately. Thank you, and I wish you successful trades!

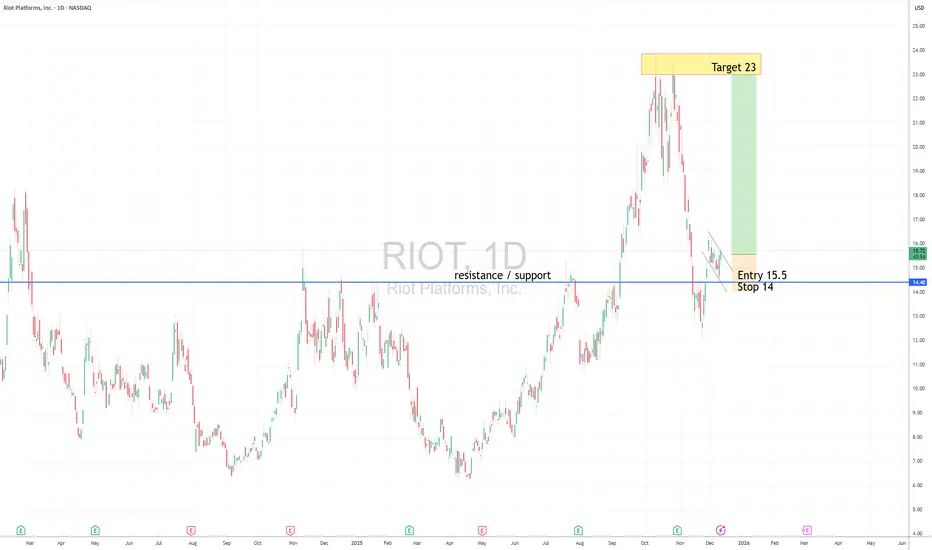
RIOT LongFlag pattern in Uptrend, Near support line
Long entry 15.5
Stop 14
Target 23
Risk management is much more important than a good entry point.
I am not a PRO trader.
In my trading plan, the Max Risk of each short term trade should be less than 1% of an account.
Nasdaq December Rally starting?Institutionals have been leaving some traces of what its about to happen. Are we ready to surf the wave?
What if it doesn't wave and it was all a bear trap?
Stay tuned!
