Wajani Investments: ETHUSD Analysis
ETHUSD has currently formed a triangle with a resistance broken to the upside. In most circumstances, I’ll like to wait for a retest of that resistance, i.e. resistance-becomes support to be sure that the breakout was not false. Once that level is tested and held, I’ll take a trade assuming Leg2 would have a similar move like Leg1. This is a very good trade with a 1:4 RR.
If you have any questions, feel free to ask. You can add or subtract from this idea.
Remember, trading always carries risks, and this is for EDUCATIONAL PURPOSES only.
Flag

Weekly timeframe version of previous HBARUSD postWanted to show my previous hbar idea which was on the daily time frame on the weekly as well so I could fit the pole of the bullflag in the frame here. I will put a link below to my daily time frame version of this post which goes into slight more detail about each pattern and also the Nvidia hbar news. *not financial advice*

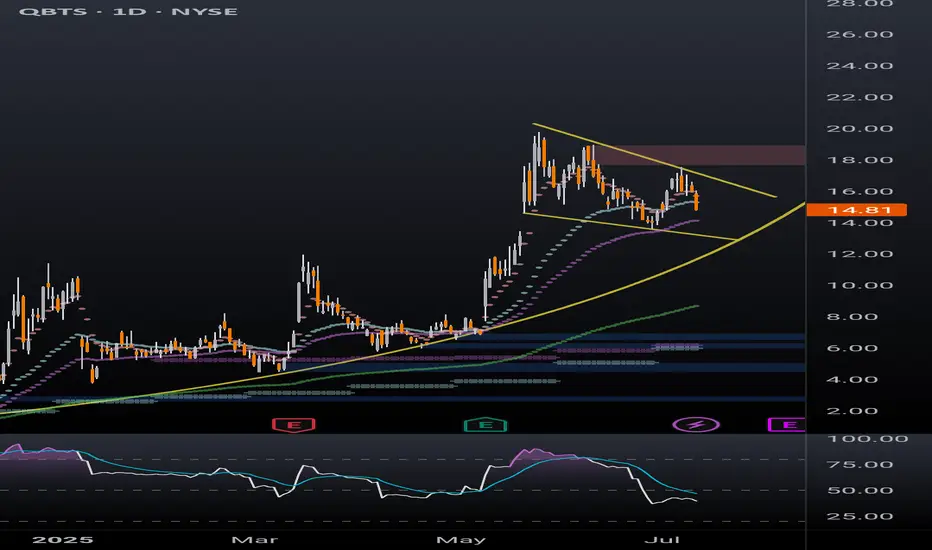
QBTS massive weekly bull flagLots of eyes on quantum computing these days. Massive bull flag forming on the daily and weekly on QBTS which has already had a great run.
Another ticker with no resistance if/when the breakout occurs.

Wajani Investments: ETHBTC Analysis
ETHBTC has formed a bullish flag (rectangle) which signifies trend continuation. Aside from that, there’s a bullish wedge still supporting a move to the upside. This analysis shows we would have a Leg2 move like Leg1 and even higher. This is a good trade with a 1:3 risk.
Remember, trading always carries risks, and this is for EDUCATIONAL PURPOSES only.
Let me know your views.

ASTS massive daily bull flagWith the cult like following on this ticker, a 4H break out and hold of this bull flag to the upside could see massive retail money piling in to send the price back to $54 ATH. RSI is also showing potential bullish confluence. The 4H chart has daily EMAs overlayed. The price is currently sitting above the daily 7EMA. Breakout above ATH and it's clear blue skies with no resistance. Huge potential.

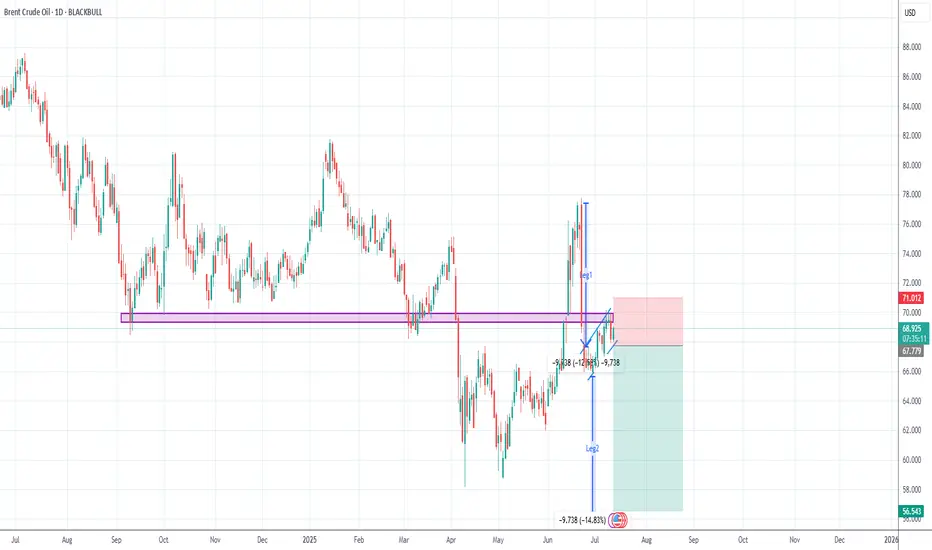
Wajani Investments analysis of BRENT AND WTI BRENT has formed a bearish flag. 80% of the time Leg1 always moves to equate Leg 2. The purple rectangle support turns resistance clarifying to false breakout of BRENT to the upside. However, if it breaks the flag to the upside, treat it as a change in trend.
Trading always carries risk, and this IS NOT A FINANCIAL ADVICE but only for EDUCATIONAL PURPOSES.
Let me know your thoughts.
Thank you.
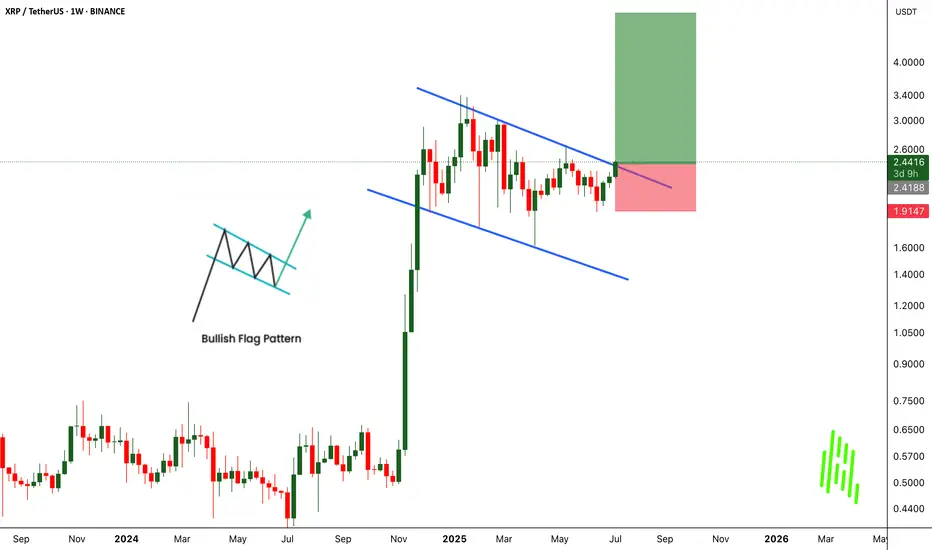
XRPUSDT Breaks Out of Bullish Flag - Big Moves Ahead!BINANCE:XRPUSDT has broken out of a classic bullish flag pattern on the weekly chart, signaling a strong continuation to the upside. This textbook setup is known for its high success rate, and the breakout suggests the potential for significant gains if momentum continues.
The CRYPTOCAP:XRP community remains strong, with long-term holders showing confidence and resilience. With the current market structure and support from loyal investors, there’s a real possibility for the price to double from this breakout zone.
The strategy is simple. Buy and hold for the long term. But as always, traders must manage risk carefully and use a proper stop loss. Let the flag fly high. CRYPTOCAP:XRP could be ready for a major pump from this level.
BINANCE:XRPUSDT Currently trading at $2.43
Buy level : Above $2.4
Stop loss : Below $1.9
Target : $5
Max leverage 3x
Always keep stop loss
Follow Our Tradingview Account for More Technical Analysis Updates, | Like, Share and Comment Your thoughts
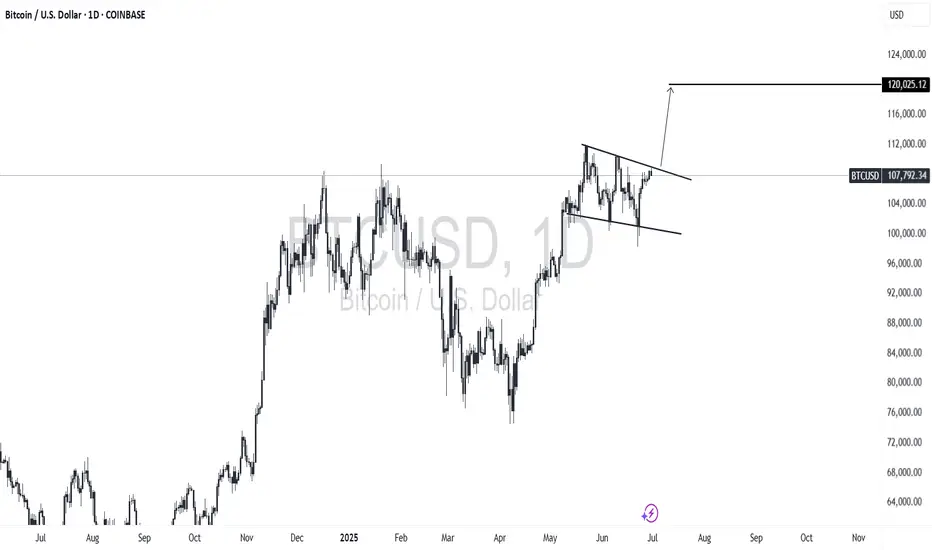
BTC is clearly gearing up for its next big move.Could we see 120k next per the pattern unfolding before us?
It may not (or it could) happen now, but BTC definitely looking BULLISH!
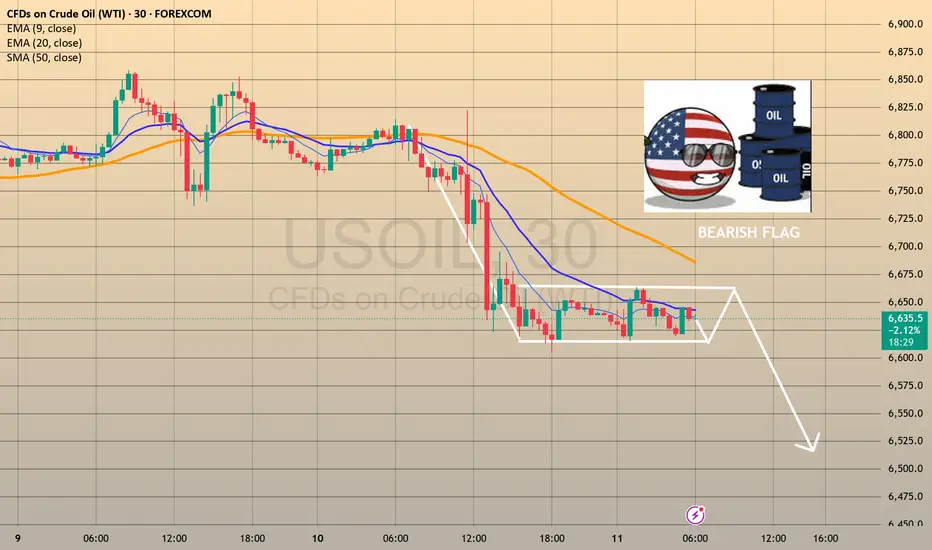
TRADING IDEA - US CRUDE OIL - BEARISH FLAG, CONCERNS ON GLOBAL EFOREXCOM:USOIL
The US Crude Oil prices went down yesterday, mostly because of the tariffs and concerns on demand.
Here is what the Bloomberg is writing: " OPEC+ is discussing a pause in its oil production increases from October is fueling concerns about a slowdown in global energy demand. In addition, the intensification of US tariffs risks slowing global economic growth and energy demand after President Trump ramped up tariffs on numerous countries this week, including a 50% tariff on Brazil."
So, despite the pause in oil production increase, which is supposed to be bullish factor the oil prices, we may see the slowdown in global economy and supposedly a recession because of Trump's tariffs. This is a long-term bearish factor for the oil. I think that we will see another bearish impulse here, according to what we observe on the chart.
There is a nice bearish flag and i am planning to short it with a target nearby 6,540.00 support level.
🔽 a pending sell stop order at 6615.3 with
❌a stop loss at 6680.9 and
🤑a take profit at 6544.0
Trade cautiously! Preserve your deposits!
EURUSD: Detailed Support & Resistance Analysis 🇪🇺🇺🇸
Here is my latest structure analysis and important
supports and resistances for EURUSD for next week.
Consider these structures for pullback/breakout trading.
❤️Please, support my work with like, thank you!❤️
I am part of Trade Nation's Influencer program and receive a monthly fee for using their TradingView charts in my analysis.

HBARUSD has 3 bullish patterns stacked on top of eachotherThe inverse head and shoulders in the light blue, the light tan is the bull flag, and the pink is the double bottom. Currently price is above the Bullflag and the Inverse head and shoulders pattern. The bullflag also counts as a descending channel pattern as well. We just recently retested the neckline of the inverse head and shoulders as exact wick support which is a good sign. All 3 should provide eachother with the bullish confluence needed for them to be validated, but in addition to this technical bullishness we have some fundamental bullishness occurring just recently too as NVIDIA just announced their new Blackwell chips — claiming them to be the future backbone of AI infrastructure — which are integrating verifiable compute which has its fundamental trust layer built on Hedera. This also provides great bullish confluence and heightens the probability these 3 chart patterns will all be validated and reach their full targets. I will keep updating this post as they do so. *not financial advice*

QBTS bull flag dailyBetter look at quantum computing ticker QBTS bull flag on the daily timeframe. Previous post looked at the weekly timeframe to highlight the bullish momentum. Lots of retail money piled into this one in the last few months, a breakout of this bull flag will likely be followed by a parabolic move.
GBPUSD bearish continuation for expect
FX:GBPUSD strong bearish pushing, we can see BEARISH FLAG pat and trend line breaked, here still strong bearish to expect till TPs.
SUP zone: 1.35500
RES zone: 1.33850, 1.33400

XLM/USDT;FREE SIGNALHello friends🙌
Given the good price growth, you can see that the price has entered a channel, which has caused the price to form a flag...
Now, with a strong channel breakdown by buyers and their entry, you can enter the trade with risk and capital management and move with it to the specified targets.
🔥Join us for more signals🔥
*Trade safely with us*

SMCI BULL FLAG PART 2smci bull flag, reclaimed bullish emas recently, volume starting to come back in, imo has potential to run to 60+

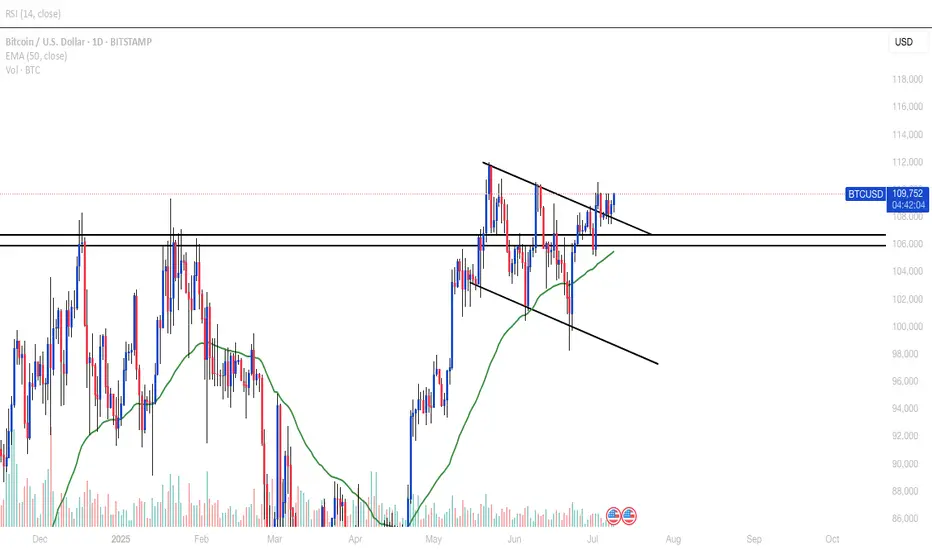
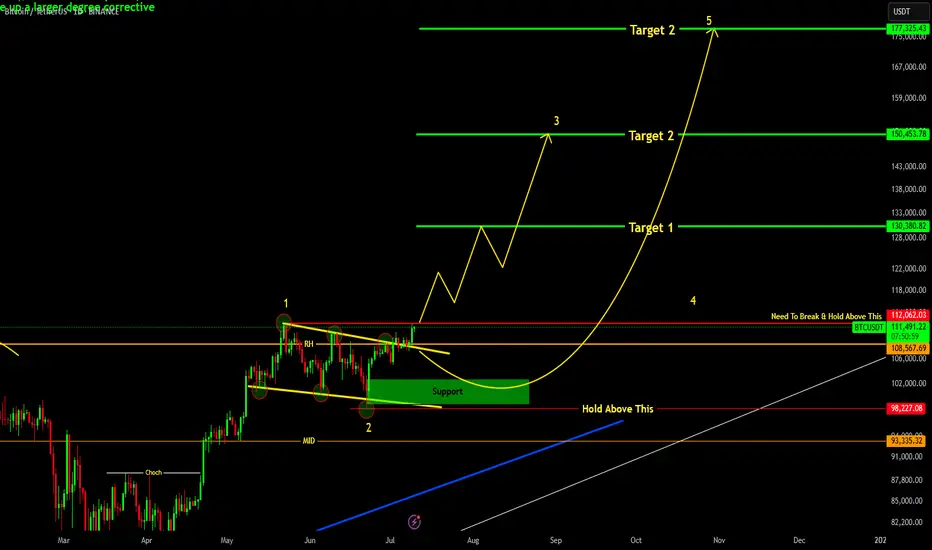
ARE YOU READY FOR 150K+ BTC RALLY !!!BTC has successfully broken out it's bull flag resistance and currently testing above it.
Major resistance resides above is 112K level , if we successfully break and hold above it then easy targets would be 130-150k levels.
Elliott Wave Count final targets 180k level.
If we goes below 106k level then we may see BTC getting into support region of 102-100K region.
For all of this, BTC should remain above 98K level.
#BTCEUR #1D (Binance) Bull-flag breakout and retestBitcoin looks very good for bullish continuation after regaining 50MA support on daily, against the Euro.
⚡️⚡️ #BTC/EUR ⚡️⚡️
Exchanges: Binance
Signal Type: Regular (Long)
Amount: 12.0%
Entry Targets:
1) 93017.86
Take-Profit Targets:
1) 108422.28
Stop Targets:
1) 85296.36
Published By: @Zblaba
CRYPTOCAP:BTC BINANCE:BTCEUR #Bitcoin #PoW bitcoin.org
Risk/Reward= 1:2.0
Expected Profit= +16.6%
Possible Loss= -8.3%
Estimated Gaintime= 1-2 months

MarketBreakdown | EURUSD, DOLLAR INDEX, BITCOIN, SILVER
Here are the updates & outlook for multiple instruments in my watch list.
1️⃣ #EURUSD daily time frame 🇪🇺🇺🇸
The price started a correctional movement after it updated
a high the first of July.
The market formed a bullish flag pattern.
Your next trend-following bullish signal will be a breakout and a daily
candle close above its resistance.
2️⃣ Dollar Index #DXY daily time frame 💵
The market corrects in a bearish flag pattern.
I see a test of a significant horizontal resistance cluster now.
Your signal to see will be a bearish violation of a support
of the flag and a daily candle close below.
3️⃣ #BITCOIN #BTCUSD daily time frame
Though the price managed to update the All-Time High
yesterday, the market did not manage to close above
a current major resistance.
I believe that we will see another attempt of the market to breakthrough.
Your bullish confirmation will be a daily candle close above the underlined resistance.
4️⃣ #SILVER #XAGUSD daily time frame 🪙
The price reached an important confluence demand zone
based on a rising trend line and a horizontal key structures support.
Probabilities will be high to see a bullish movement from that.
Do you agree with my market breakdown?
❤️Please, support my work with like, thank you!❤️
I am part of Trade Nation's Influencer program and receive a monthly fee for using their TradingView charts in my analysis.

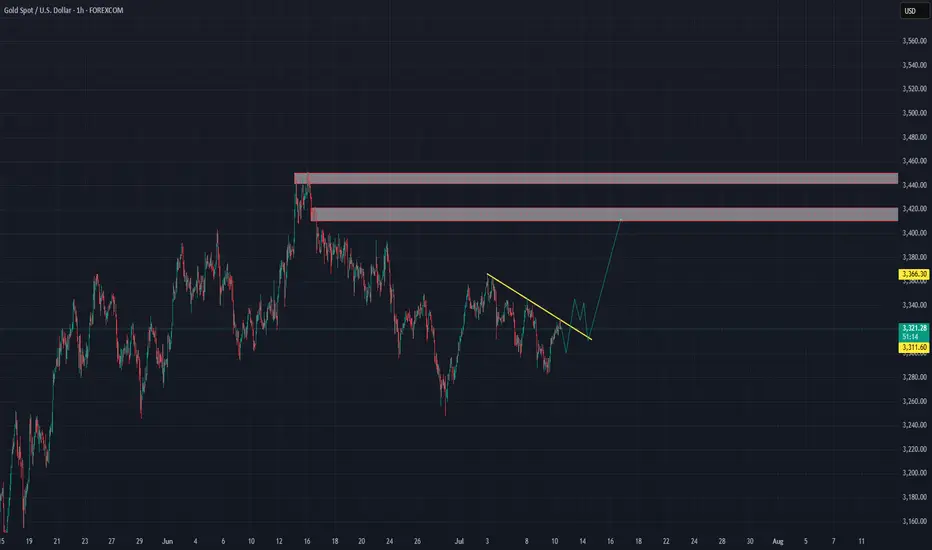
GOLD (XAUUSD): Important Decision Ahead
As I predicted, Gold went up from a trend line yesterday.
The price is now testing another trend line - a falling resistance
of a bullish flag pattern.
The next reliable bullish signal that you can look for is its
bullish breakout and a daily candle close above that.
A bullish move is going to follow then.
❤️Please, support my work with like, thank you!❤️
I am part of Trade Nation's Influencer program and receive a monthly fee for using their TradingView charts in my analysis.

Gold 1H analysisFX:XAUUSD
From what I see, this bullish flag is likely to form and the price will move to higher base.
SMCI - Bull Flag Breakout SetupSMCI formed a strong bullish impulse followed by a bull flag pattern.
A breakout above the flag structure may signal continuation if confirmed with strong price action.
Trade Plan:
• Entry: On breakout or retest
• Stop Loss: Below flag support
• TP1: Recent high
• TP2: Measured flagpole extension
This setup is worth monitoring for potential bullish continuation.
Disclaimer: This is not financial advice. For educational purposes only.

$BTC Tapping ATH - Is this REAL!?YUUUGE Daily Close today for CRYPTOCAP:BTC
Bullish cross on the 20/50MA.
Appears to have broken out of a bull flag.
Need PA to stay within this POI in order to confirm another leg up.