Wall Street Weekly Outlook - Week 43 2025 [20.10.- 24.10.2025]Wall Street Weekly Outlook - Week 43 2025
Every week I release a Wall Street Weekly Outlook that highlights the key themes, market drivers, and risks that professional traders are watching.
+Extra lessons:
Any questions? Drop a comment or reach out directly.
Best,
Meikel
Fundamental Analysis

Gold Analysis: Break Above $4,293 Could Trigger a New HighHi guys!
Gold has been moving inside a clear ascending channel, respecting both its upper and lower boundaries. Recently, we saw a double top formation near the upper trendline , which triggered a corrective move down to the $4,190–$4,200 support zone, an area that has already shown strong buying interest.
After the rebound from this support, the price is now aiming toward the $4,293 resistance.
👉 If the price breaks and holds above $4,293 , it’s likely to continue the bullish momentum and head toward a new higher high inside the channel.
Overall, the structure remains bullish as long as the price stays above $4,190 , with the next key resistance at $4,293 being the level to watch for a potential continuation of the uptrend.
Gold’s bullish bias remains supported by the ongoing geopolitical tensions, uncertainty over global interest rate paths, and softening U.S. dollar. Investors are also increasingly turning to gold as a safe-haven asset, especially amid concerns about economic slowdown and central bank gold purchases remaining strong.
Disclaimer: As part of ThinkMarkets’ Influencer Program, I am sponsored to share and publish their charts in my analysis.

BITCOIN - Clear bearish sign!Bitcoin is currently forming a clear corrective pattern — a rising wedge that has broken downward, retested the breakdown, and is now continuing a gradual decline.
This correction is expected to bottom around the $85K level, after which Bitcoin will likely enter a consolidation phase, form new structures, and we’ll keep updating the outlook as new developments occur.
Also, note that the EMA 25 just crossed below the EMA 50, forming a death cross — a bearish signal.
You can consider entering a short position from here, but keep your leverage low and wait for a slight pullback before entering the trade.
Many people won’t like what I’m saying — they’ll tell you “Bitcoin is heading to $200K!” — but that’s just the nature of the market. Everyone sees what they want to see.
Corrections, retracements, and emotional reactions are all part of the cycle. The smart ones are those who read the structure, not the hype.
Best Regards:
Ceciliones🎯

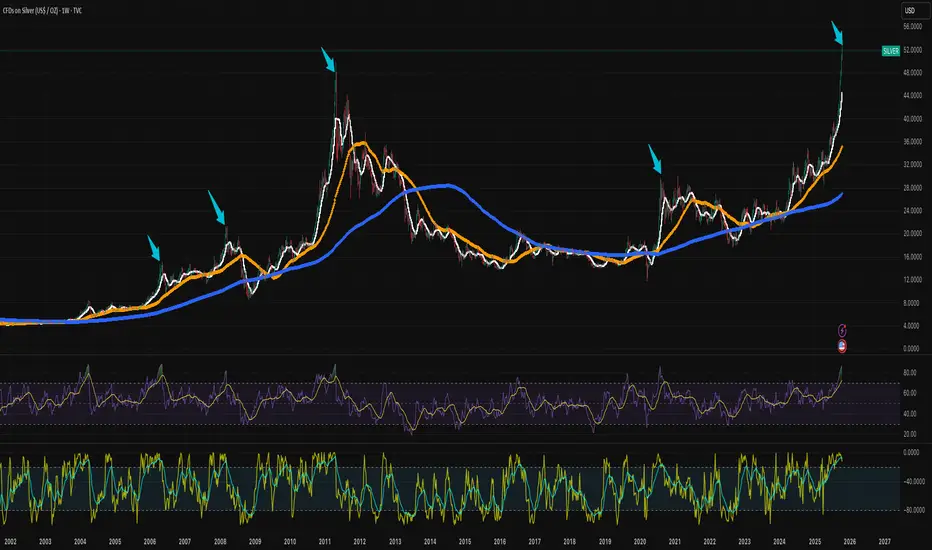
Gold & Silver long-term viewSimple log chart and trendline shows gold around $30K and silver around $900 by 2030. Each candle = 1 year
Cheers,
Keops

GBPJPY Eyes 202.900 Resistance as Correction Meets Downtrend!Hey Traders, in tomorrow’s trading session we are monitoring GBPJPY for a potential selling opportunity around the 202.900 zone. The pair remains within a broader downtrend and is currently in a corrective phase, approaching a key resistance area near 202.900 that aligns with the descending trend structure.
Structure:
Price has been forming lower highs and lower lows, maintaining bearish momentum. The current retracement toward 202.900 could provide an attractive area for sellers to re-enter the market in line with the dominant trend.
Key level in focus:
202.900 — a strong resistance confluence area, combining structural and technical significance.
Fundamentals:
Ongoing concerns over global risk sentiment and the potential for renewed JPY strength amid rising geopolitical tensions could further support downside pressure on GBPJPY.
Next move:
Monitoring price action closely around 202.900 — a rejection or bearish confirmation at this level could trigger the next leg lower within the prevailing downtrend.
Trade safe,
Joe.

Gold ready for retest ath 4380Gold (XAU/USD) showing bullish reaction from the support trendline. The circled candle indicates buyer strength, suggesting a possible recovery toward 4279–4380 resistance levels.
Support Trend Line:
Shows long-term bullish structure — price respecting the ascending trendline.
Support Zone (4181 – 4253):
Key demand area where buyers are stepping in to defend the trend.
4279 Level:
Immediate resistance; a breakout above could confirm short-term bullish momentum.
4313 Level:
Next resistance target after 4279; possible area for partial profit-taking.
4380 Level (ATH Retest):
Major resistance zone — potential final target if bullish move continues.
Indicates buyer reaction at the trendline, signaling possible reversal toward 4279.

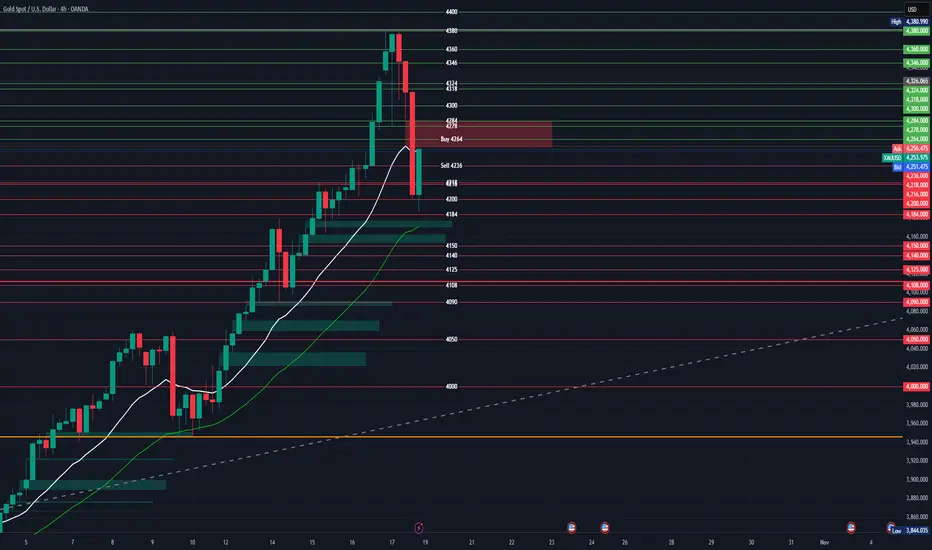
Gold weekly chart with Buy and Sell levelsAnother great week last week we caught the rise early for 1500 pips, lets see can we catch the sell off this week
Buy Entry – 4264
Context: Price recently retraced toward key Fibonacci support near 0.5–0.618 levels (around 4180–4240 region).
Rationale: 4264 aligns with prior breakout zone and 20 EMA dynamic support. Volume concentration just below adds confluence for a potential rebound.
Targets:
Short-term: 4300 (psychological and structural resistance).
Extension: 4340–4360 (previous swing highs).
Stop-loss: Below 4230 support or under 4180 structure (protect against deeper retrace).
Sell Entry – 4236
Context: Positioned near lower range boundary after bullish exhaustion from 4380 top.
Rationale: Acts as a breakdown confirmation if price closes below 4240, breaking the 20 EMA and invalidating near-term bullish structure.
Targets:
Initial: 4180 (0.5 retracement pivot).
Extended: 4120–4100 (previous accumulation zone).
Stop-loss: Above 4270–4280 resistance area (invalidate short bias).
Summary
Bias: Bullish while price holds above 4230–4240.
A daily close below 4230 invalidates buy bias and favors continuation toward 4180–4100.
If 4264 holds, expect potential retest of 4340–4360 range highs.
ill update throught the week
BTCUSDT: Short Setup Active Below $110,700Hello everyone, here is my breakdown of the current Bitcoin setup.
Market Analysis
On the 1H timeframe, Bitcoin continues to move inside a descending channel, maintaining a clear bearish structure.
After multiple tests and breakouts, the price is still unable to break through the Resistance Area around $110,700, which remains a strong supply zone.
Recently, we saw a fake breakout, followed by a return below the resistance area — confirming that buyers are losing strength. Currently, the price is forming a range near the Support Zone ($104,500–$105,000), which indicates a short-term consolidation phase before a possible next move.
My Scenario & Strategy
I expect that after the range is broken to the downside, BTC will continue its decline toward the Support Zone ($104,500). If this level fails to hold, the next potential target will be the lower boundary of the descending channel around $102,300.
However, a breakout and close above $110,700 would invalidate the bearish scenario and could indicate a shift in market structure.
That's the setup I'm tracking. Thank you for your attention, and always manage your risk.

EUR/USD — 4H Demand Zone Reversal: Looking for Bullish ContinuatDescription:
After a strong bearish move, EUR/USD has reached a major 4H demand zone (1.1530–1.1560) that previously acted as a structural turning point. The market formed a clear double bottom at this level, followed by a BOS (Break of Structure) to the upside — confirming that short-term control has shifted from sellers to buyers.
At this stage, I expect a potential retracement back to the 1.1600–1.1620 zone, which aligns with a fair value gap (FVG) and prior structure. This area could serve as a re-entry point for long positions, as liquidity below the recent minor lows may be collected before continuation.
If bullish order flow remains intact, the next targets for upside expansion are:
Target 1: 1.1720 — the nearest 4H supply zone
Target 2: 1.1750 — liquidity resting above previous highs
Invalidation: a 4H close below 1.1530 would invalidate this setup and reopen the door for deeper bearish continuation.
This setup follows a Smart Money + Supply & Demand framework, focusing on structural shifts, liquidity sweeps, and confirmation entries on the lower timeframes (1H / 15M).

GBPJPY | Anticipating Liquidity Sweep Into OB | 15-Min SMC Setup📊 Pair: GBPJPY
⏰ Timeframe: 15 Minutes
🧠 Bias: Bullish (anticipating reversal setup)
🔍 Market Context:
Currently, price is consolidating above a recent swing low , where resting liquidity is visible.
Below that low lies a bullish order block , which aligns with the discount area of the range.
💡 Trade Idea:
I’m expecting price to sweep the liquidity below the low , tap into the order block , and then show confirmation (BOS + bullish displacement) before entering a long position.
🎯 Plan Summary:
- Wait for liquidity grab ✅
- Tap into OB ✅
- Look for bullish confirmation ✅
- Target the next internal high for continuation
🧩 Concept Used:
Smart Money Concepts | Liquidity | Order Block | Market Structure Shift
⚠️ Disclaimer:
This is only my personal analysis shared for educational purposes — not financial advice.

BTC insight and possible move this month. BTC insight and possible move this month. Study and compare your ideas. Hope this will help.

Add Silver to your ALERTSHave been watching Silver recently and while I hear some of the bullish feelings around it, I do want to caution that it is very volatile esp. at these levels. The issue is not whether you think it's a good hedge or not, but that there are a number of speculators that simply profit once their asset reaches a certain level. Also, the world generates around 800M"ish" of ounces in a given year and we're at 1 billion demand. What does that mean? There will be trust issues when the supply chain breaks, and it will break esp. when future contracts expire and delivery is expected within 72 hours and cannot be met. I could be way off here, or not :) I follow macros, trends, and call out BS all the time when I see it.
Add ZSL (inverse of Silver) to your alerts asap. It will spike very soon!
Best of luck!
Dealers Were in Short Gamma. No Surprise We DroppedA massive flip zone just showed up on the GEX map and dealers were positioned deep in short gamma.
That means every downward move in spot forced them to sell even more to hedge, amplifying the pressure.
So it’s not a random sell-off , it’s a mechanical reaction from the dealer flow itself.
When the market enters negative gamma territory, volatility feeds on itself.

Blow Off Top Simulation SPY (Bearish with Hedges)We now have our first 1Week chart with a red candle since April which is a big deal and will probably lead to a regime change.
I wanted to see what the worst case scenario would look like blow off top. totally possible i used the price action since April to mirror the same pattern.
The reason why i think a blowoff top is that we broke the trend line we've been in for a few years so the structure is off and we'll need to find a new trend, this give price action the excuse to continue especially with all this liquidity. ultimately i think the liquidity isn't rally cash but exit liquidity and a window for the institutions to hand out bags.
we also need to keep in mind there will be tax loss harvesting coming up some are already in that mode.

BTC and Liquidity CycleBitcoin(BTCUSDT)
Net Liquidity(ECONOMICS:USCBBS-FRED:RRPONTSYD-FRED:WDTGAL)
Reverse Repo(RRPONTSYD)
Treasury General Account(WTREGEN)
Effective Fed Fund Rate(EFFR)

Has Crypto Bottomed? Cycle AnalysisBTC has swept some key areas and looking to form a bottom. Back testing a key break out area.
We technically pierced the daily 200 MA a few days ago but never confirmed below the key area.
The near term chart looks like we should maintain a positive bounce back to 111,500.
We need to be mindful that the last failed double top breakout that occurred in dec 2024 / Jan 2025 - we saw a 30% decline from peak to trough.
As long as the crypto market cap remains above the weekly chart neckline - a bull upside target can be calculated.
We nibbles on some MSTR shares on Friday.
These crypto positions need to be monitored closely.

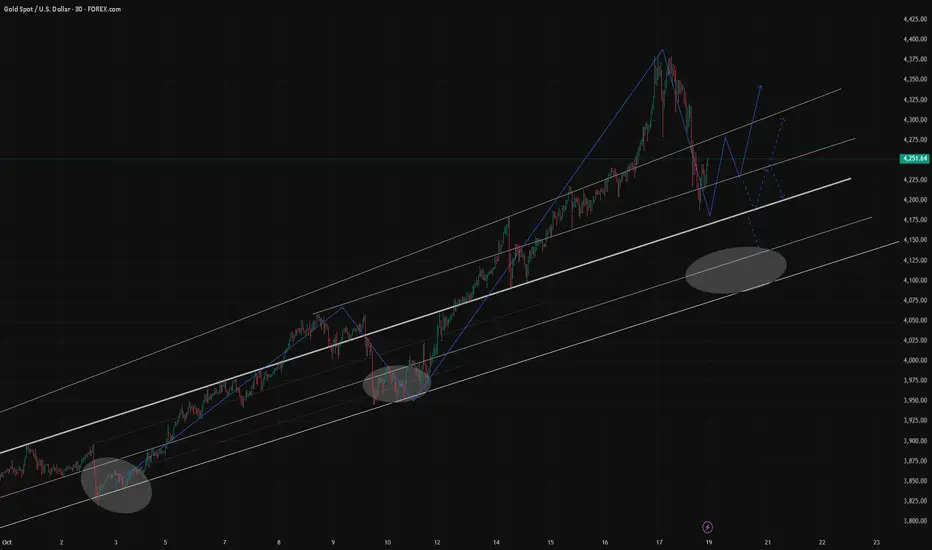
Gold Weekly Review — Historic Volatility & Next Week’s Key LevelThis week, gold experienced a historic level of volatility, a truly remarkable movement that left many traders astonished.
During the session, prices tested the 4200–4180 support zone for the first time. The nearly $200 decline effectively released the heavy selling pressure that had been building up in recent days, while also creating new opportunities for bullish entries.
As expected, once prices entered the support region, they rebounded strongly, closing above 4250 with a recovery of nearly $70 (all of which I had clearly indicated in advance).
From the 30-minute chart, the candlestick structure still suggests further upside potential. However, given the weekend uncertainty, any unexpected bearish news could trigger a pullback when markets reopen on Monday.
If no major negative developments occur, bullish momentum may continue to drive gold higher. Resistance is likely to be concentrated around the 4280–4300 zone — once price enters this region, both short-term buyers and trapped long positions may start adjusting their holdings, which could increase the likelihood of a short-term correction.
On the 4-hour chart, this nearly $500 rally has just completed its first test of the MA30 support. The MA5 (near 4270) currently acts as the key resistance, followed by MA10 (around 4292).
If during consolidation, the price can hold above MA20 (around 4246), it will likely attract renewed buying interest, potentially driving prices back toward 4380 or even higher.
Conversely, if prices remain under pressure and fail to stay above the MA20, attention should shift to the MA30 support. A break below this level could open the way to a test of the MA60(near 4100).
Therefore, for next week’s trading, these levels will be our key focus points.
As I mentioned earlier this week, the medium-term long positions have been closed, and we will wait for new opportunities to emerge. If the market drops toward 4100 or even lower, I will consider re-entering long positions from those lower levels.
A friendly reminder — always align your trading strategy with your own risk tolerance and financial situation. Medium-term setups require patience and strong risk-bearing capacity. If your current condition doesn’t allow for that, please avoid blind following to prevent unnecessary losses.
Lastly, note that gold still has two unfilled gaps around 4019–4024 and 3887–3898. If the trend turns bearish, these gaps may present potential trading opportunities.
That’s all for today.
We’ll discuss specific intraday trading opportunities when the market opens.
If you have any questions or need guidance, feel free to leave me a message.
What to Do When the Market Is in an Uptrend?Hello everyone,
When the market is rising , most traders get excited. Every price push feels like a wave of enthusiasm – everyone believes they are on the winning side. But in reality, even in the most favorable conditions, not everyone makes a profit . The simple reason: a rising market does not automatically mean a win; it’s about knowing when to buy and when to wait . I’ve seen many traders jump into positions just because the price is going up, only to be surprised when the market pulls back . An uptrend is not a straight line up, but a series of higher highs – pullbacks – higher highs , and the winners are those who know how to choose the right timing.
Confirm the Trend – Don’t Confuse Uptrend with a Technical Rebound:
Before placing a trade , the first step is to confirm whether the market is truly in an uptrend . A proper uptrend should have higher highs and higher lows , with the price staying above moving averages like EMA 20, EMA 50, or above the Ichimoku Kumo cloud . If the price just bounced from a low after a sharp decline, it may only be a technical rebound , and confusing the two can make you buy at the top . For example, when gold keeps forming new highs at 1,920 – 1,940 USD/ounce, while the lows remain higher than the previous ones, the money flow clearly supports the uptrend .
Buy on Pullbacks – “Buy the Dip” Is a Smart Entry:
Once the uptrend is confirmed, the next step is to choose the right entry point . Don’t rush to follow the price when the market is flying , as every uptrend has pause phases . Each minor correction or pullback is a chance to buy the dip . Watch important support zones , such as Fibonacci 0.5 or 0.618 or unfilled FVG areas . When the price touches these levels and shows a reversal signal , it is usually the highest probability entry point .
Note: even in an uptrend , the market may experience shakes due to profit-taking or short-term adjustments . This is normal and should not cause panic. In fact, the pullback is an opportunity to buy at a better price . Wait for a confirmation signal from candlestick reversals or indicators like RSI not oversold . For example, if gold rises from 1,900 to 1,940 and then pulls back slightly to 1,915 – 1,920, this can be a good entry , instead of chasing at the peak .
Risk Management – Stop Loss and Take Profit:
Even when the market is rising , risk management is crucial. Place Stop Loss below higher lows or the nearest support zone to protect against sharp pullbacks. Take Profit can be set at the next resistance zone , or use trailing stop to lock in profits as the price continues upward. For example, buying gold at 1,915 USD/ounce , you could place SL below 1,905 and TP near the resistance at 1,950 USD.
Monitor Macro News – Don’t Let Big Waves Sweep Away Profits:
A strong trend always has a reason behind it: monetary policies , inflation data , or global capital flows . Staying informed helps you avoid being caught off guard.
I’ve covered this part, you can click here to read more.
Patience and Discipline – Two Weapons to Survive an Uptrend:
One of the biggest challenges for traders is… standing still . When the market keeps rising , FOMO (fear of missing out) can make you jump in immediately, but most hasty trades end up buying right before a pullback . I’ve made this mistake many times – buying when the price is flying , then watching the position turn red in a few hours. Later, I realized that in an uptrend , patience to wait for a pullback is the key to winning. Wait for the price to return to a support zone , wait for a confirmation signal , then enter.
Discipline is not only about entry timing but also risk management . Place Stop Loss below the nearest low , Take Profit at the next resistance zone , and if the price continues upward , move SL favorably – trailing stop protects profits without exiting too early. Emotions are the biggest enemy of a trader ; greed or rushing leads to wrong decisions. Following your plan and discipline avoids unnecessary losses.
An uptrend is a perfect time to increase profits , but it can also make traders complacent . If you can identify the trend , wait for the right entry , and maintain discipline , you will not only ride the wave but also survive it. Is the market rising? The question is not whether to buy or not , but whether you have enough patience to wait for the right moment .

EUR/AUD Bulls Fighting Back — Retail 76% Short!🔹 COT (Commitment of Traders)
Euro (EUR):
Non-commercial longs: 252,472 (−789)
Non-commercial shorts: 138,127 (+2,625)
→ Institutional traders have trimmed long positions and increased shorts, signaling a softening bullish bias on the euro.
Australian Dollar (AUD):
Non-commercial longs: 41,994 (+1,718)
Non-commercial shorts: 101,584 (+10,148)
→ Sharp increase in short exposure versus longs, reflecting renewed bearish pressure on AUD.
📊 Combined Interpretation:
While the euro shows mild weakness, the Australian dollar remains under stronger institutional selling pressure. The result is a net bullish bias on EUR/AUD, though upside momentum may moderate as euro positioning cools.
🔹 FX Sentiment (Retail Positioning)
76% short / 24% long
📌 Retail traders are heavily short, providing a contrarian bullish signal for EUR/AUD.
This skew supports the institutional view, hinting that short covering could drive the next bullish leg.
🔹 Seasonality
EUR: October tends to be mildly negative on a 10–20 year horizon (−0.20% to −0.60%), but neutralizing into November.
AUD: October is historically flat to slightly positive, though broader Q4 data favors euro recovery over commodity currencies.
📌 Seasonal Bias: Neutral-to-bullish EUR/AUD outlook — seasonality doesn’t contradict the structural bullish setup but suggests limited upside speed.
🔹 Price Action
EUR/AUD remains within a broad consolidation range, oscillating between 1.7650–1.7950.
The pair has recently bounced strongly from the 1.7600–1.7650 demand zone, aligning with a clean RSI rebound from oversold conditions.
Currently trading near 1.7900, approaching the supply area 1.7950–1.8000, which may act as short-term resistance before any continuation move.
🎯 Scenario 1 (Preferred): Continuation higher toward 1.8000, followed by a correction back toward 1.7700 before resuming the broader bullish trend.
❌ Invalidation: Daily close below 1.7650 would invalidate the bullish bias and re-open 1.7500.

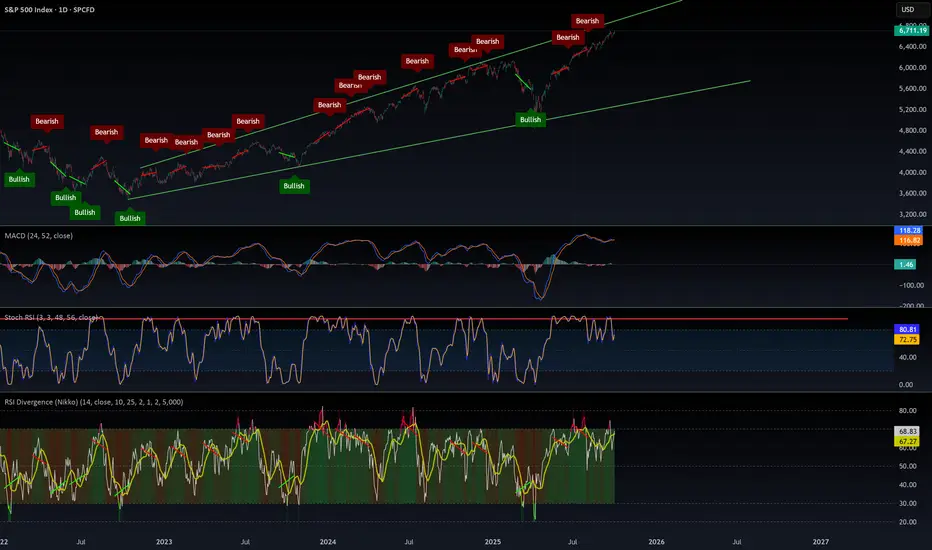
$SPX500 by all metrix this is overboughtMarkets can stay irrational longer than we can stay solvent. Right now, we’re at the top of this megaphone pattern, with everything extremely overbought in epic fashion.
⚠️ Caution: the odds of a serious correction are high — the chart points to a potential target around $5,650.
Sure, the madness can continue. The Fed can keep printing USD that pours into stocks instead of the real economy — until people are jobless, starving, and rioting for food.
📈 Enjoy the rally while it lasts, but use stop-losses. This market is dangerously overheated.
ZECUSDT - another leg up ahead!Keep your eyes on it — just like I told you before. Its target was $250–$280, and it actually hit $298 exactly. It then entered a temporary corrective phase, forming a falling wedge pattern.
This coin is an ideal pick for the current phase, and don’t worry — its bullish run isn’t over yet.
Next target: $360. I’ll keep posting updates about it regularly.
Best regards:
Ceciliones🎯

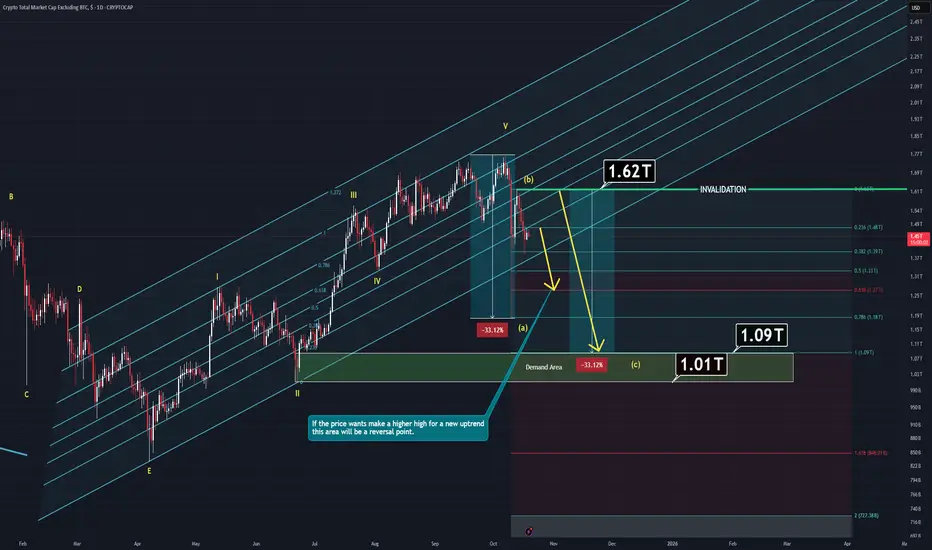
TOTAL 2 Analysis (1D)Total 2 has started its correction wave known as A-B-C but there are much to consider:
Main component of Total 2 is ETH and we'll need to dive into that so the chart would make sense.
-Companies like Bitmine keep buying ETH but they don't actually own it yet.
Specifically, Ethereum treasury companies collectively hold around 5.66 million ETH, equivalent to 4.68% of supply. Meanwhile, spot Ethereum ETFs hold roughly 6.81 million ETH, or 5.63% of the total.
If this companies would like to keep buying there are also two things to consider:
1- ETH price is still high despite the last crash. Any company would consider buying more if the price is lower than current.
2- ETH has unlimited max supply. It means, these companies will need way more than currently they have if they actually want to control it better which they do. Another thing to consider is, they actually don't have "that much". According to data we have, they only control around %5 at max. It means, ETH's price is not dependent on their favor, big wallets are.
Other things to consider:
ETF's:
After approvel of the SEC, these companies now can offer staked ETH ETF which also means price won't actually matter for the long term. These companies will be able to buy more ETH with the lower interest rates while prices are lower and cheaper. Lower interest rates means cheap liquidty which will trigger more buying events despite the price.
Also;
In the long term, these companies and ETF holders will be able to buy more thanks to staking mekanism. Staking will allow them to accummulate more ETH as a bonus.
When you add technical analysis into all of this, the chart actually makes sense.
Last crash mitigated closest demand zone. If the price wants to go higher it will at least has to make a higher high which means some of that wick's portion must be filled. And if that amount is not going to be enough, next demand zone will act as a magnet for the price.
Either way, waiting for invalidation line trigger or simply demand zone to react is going to be wiser action.
Thanks for reading.
USOIL (WTI Crude Oil) – Bullish Reversal Setup | 4H AnalysisMarket Context
WTI Crude Oil has been in a strong downtrend over the past few weeks, breaking multiple support levels.
However, price has now reached a key higher-timeframe demand zone (55.80–57.00), which previously acted as a strong reaction area in the past.
The recent 4H candles show clear rejection wicks and slowing bearish momentum — signaling that sellers may be losing control.
Technical Breakdown
Structure: The downtrend may be completing its final leg, forming a potential double-bottom or accumulation phase.
Demand Zone: The area between 55.80–57.00 is aligning with previous volume imbalance and untested demand.
Liquidity Sweep: Price grabbed liquidity below prior lows and quickly bounced back — a classic smart money reversal sign.
💡 Trade Plan
Entry Zone: 56.80 – 57.20 (after confirmation or retest)
Stop-Loss: Below 55.80 (structure break / demand invalidation)
Take-Profit Targets:
🎯 TP1: 61.00 (first resistance / supply area)
🎯 TP2: 64.70 (major 4H resistance & potential reversal completion point)
🧭 Bias & Outlook
Bullish, as long as price holds above 55.80 and continues forming higher lows.
A break below this level would invalidate the setup and signal continuation of the broader bearish trend.
🧠 Summary :
Oil has reached an oversold demand region, showing signs of accumulation and liquidity sweep.
Early confirmation of buyers stepping in could trigger a strong corrective move toward 61.00–64.70.
This is a medium-term swing setup with solid risk-to-reward potential.
