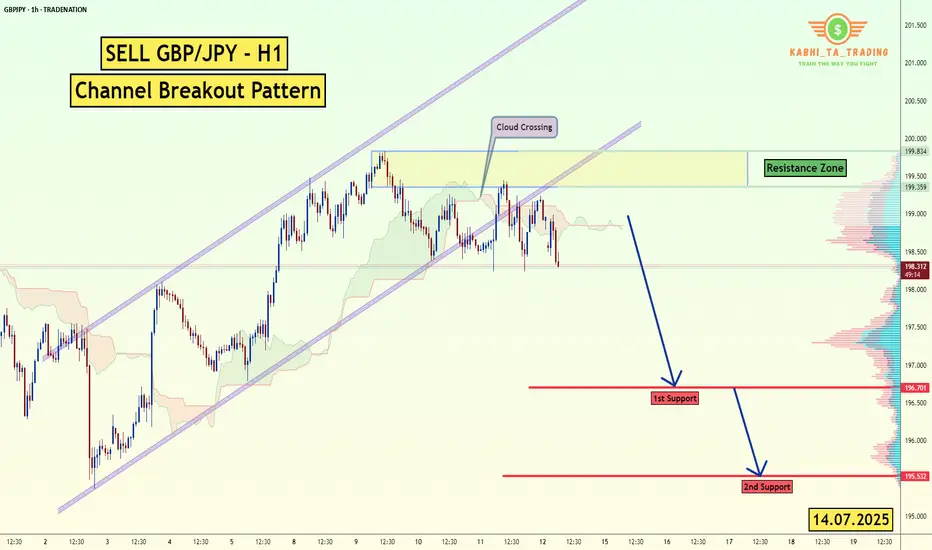
GBP/JPY -H1- Channel Breakout (14.07.2025)The GBP/JPY Pair on the H1 timeframe presents a Potential Selling Opportunity due to a recent Formation of a Channel Breakout Pattern. This suggests a shift in momentum towards the downside in the coming hours.
Possible Short Trade:
Entry: Consider Entering A Short Position around Trendline Of The Pattern.
Target Levels:
1st Support – 196.70
2nd Support – 195.53
🎁 Please hit the like button and
🎁 Leave a comment to support for My Post !
Your likes and comments are incredibly motivating and will encourage me to share more analysis with you.
Best Regards, KABHI_TA_TRADING
Thank you.
Disclosure: I am part of Trade Nation's Influencer program and receive a monthly fee for using their TradingView charts in my analysis.
Fundamental Analysis
Bitcoin Skyrockets as Everyone Now Wants a Piece. What Happened?If you took a few days off last week and went to get coffee this morning, you likely missed Bitcoin torching its all-time high and soaring into the uncharted.
The world’s most popular digital asset took off in an unstoppable rocket ride, smashing records so fast that even the always-wired-in day traders couldn’t keep up.
Bitcoin BITSTAMP:BTCUSD blasted through $122,000 Monday morning after gobbling up sell walls at $120,000 and $121,000 in less than one hour. That’s not a typo.
That’s an actual snapshot of what happens when you mix onchain whale movements, fresh institutional FOMO, and traders rediscovering their appetite for risk. Billions upon billions swirled up and Bitcoin passed $2.3 trillion in market cap (ref: our Crypto Heatmap ).
🙌 Bow Down Before the King
Bitcoin has officially reminded every altcoin who wears the crown when markets go haywire. While some tiny tokens get to pump 100% on hype alone, Bitcoin does it with the weight of its market cap behind it — which now surpasses the GDP of entire countries.
Its dominance share has climbed back above 64%, a level we haven’t seen since the last time crypto Twitter argued whether “flippening” would happen by next Thursday (spoiler: it didn’t, and we mean 2021). And right now, all eyes are pinned on that round, meme-ready milestone: $125,000 or even $150,000.
Why these levels? Because traders love round numbers. They’re clean, symbolic, and if that next ceiling shatters, the chain reaction of liquidated shorts and new leveraged longs can turn an orderly bull run into pure market mayhem.
📈 Institutional Hoarding: The Secret Fuel
If you think this is just retail traders YOLO’ing in from their parents’ basement, think again. Onchain data showed earlier this month that this moon mission was being quietly underwritten by the big boys — institutional funds, overflowing Bitcoin ETFs , and corporate treasuries that once scoffed at Bitcoin as “magic internet money.”
Does this mean Bitcoin is becoming boring? Not quite. It means the foundation for this rally is sturdier than the TikTok-fueled moonshots of yesteryear. Think steady inflows, regulated vehicles, and balance sheets that no longer flinch when they see “digital assets” on a line item.
👀 So, Why Now?
Bitcoin doesn’t need much of a reason to get volatile — you know that. But a few more stars than usual aligned to give this surge its lift-off moment.
First, the macro backdrop: US inflation is at 2.4% (next ECONOMICS:USCPI report coming Wednesday, pay attention to the Economic Calendar ), which makes a Fed rate cut more likely later this year.
Lower rates mean cheaper dollars, weaker bond yields, and renewed appetite for risk assets. Oh, and don’t forget about gold OANDA:XAUUSD — the OG “no yield, no problem” hedge.
Second, corporate treasuries are all-in on Bitcoin again. If Michael Saylor’s Strategy NASDAQ:MSTR (formerly MicroStrategy — we all know what business they’re really in) keeps adding coins and onboarding new public companies like GameStop NYSE:GME , you know the institutions smell long-term value. Add Trump’s full-throated crypto endorsement and you’ve got a narrative tailwind no trader wants to miss.
🥂 Record Highs Everywhere — COINcidence?
Now let’s go back to those aligning stars. Bitcoin’s fresh all-time high didn’t happen in a vacuum. The S&P 500 SP:SPX , the Nasdaq Composite NASDAQ:IXIC , and Nvidia NASDAQ:NVDA — the world’s most expensive company — all clocked record closing highs last week.
So, is this a “rising tide lifts all boats” moment? Or are we partying on borrowed time? Equities are riding a wave of hope that the Fed will start easing soon, and any whiff of a rate cut is pure oxygen for risk assets.
But seasoned traders know that record highs can sometimes be the most dangerous places to FOMO in. Ask anyone who went all-in on dot-com stocks in 1999.
🏹 Eyes on the Big 120K — Will It Hold the Line?
Short-term, the $120,000 milestone is the line in the sand everyone’s watching. Break it decisively, see if it holds above it for a week or so, and the floodgates of speculative capital might open for another leg higher. Stall out below it? You could see a healthy round of profit-taking and some bruised egos during quiet dinners.
Macro factors will loom large: the Fed’s policy meeting, surprise tariff talks from the White House, or an unexpected bout of inflation could swing sentiment overnight. But for now, the mood is simple: bullish, frothy, and more than a little bit greedy.
💭 Final Take: From Moonshots to Maturity?
The shift from whales to suits means fewer wild swings but steadier institutional demand. The days of “Lambo tomorrow” might be giving way to “slow grind higher for the next 5 years.” For the retirement portfolio, that’s not the worst outcome.
For the traders who crave the adrenaline, there’s still plenty of room to catch the waves — just don’t expect them to come as easily or as frequently as they did in the wild west days.
📢 Your Turn: Moon or Swoon?
Over to you: is Bitcoin ready to break out above $125,000 and send shorts scrambling for cover? Or is this just another overbought stall before a healthy pullback?
Either way, grab your popcorn — and your stop-loss — because if there’s one thing crypto never does, it’s sit still for long. Drop your hot take below — and may your diamond hands be stronger than your coffee.

AUDCAD Trade plan: Waiting for bullish confirmation at RetestPrice broke above resistance with a momentum candle, indicating buyer control. This is our first clue that a structure shift might have occurred.
This retest is essential. Many traders make the mistake of entering too early without confirmation. But it's right here, once price touches the former resistance, that you must observe how price reacts. Look for price exhaustion or reversal candlesticks such as bullish engulfing patterns, or even inside bars.
Once rejection is confirmed, I'm looking to go long to 0.90450.
Just sharing my thoughts for the charts, this isn’t financial advice. Always confirm your setups and manage your risk properly.

BITCOIN → Stopping after the rally? What next? 125K or 110K?BINANCE:BTCUSDT rose and updated its historical maximum to a new record of 118K with “kopecks” (different prices on different exchanges). Now the price has supposedly stopped and entered a consolidation phase, but it is too early to draw any conclusions based on this alone...
Fundamentally, Bitcoin rose following the SP500 and NQ100 indices. The reasons are clearly geopolitical. The correlation level is not high, but the flagship is following the stock indices, which are also updating their historical highs.
Technically, Bitcoin has emerged from a two-month consolidation and entered a realization phase. So what's next? Continuation of the phase or correction? Let's take a look.
On the daily chart, I would highlight two zones. The risk and sell zone is below 117,500. If the price closes below this zone today/tomorrow, we will most likely be able to look for signals for a possible correction. As part of the correction, we can expect a decline to 115,500, 114,300, or even to the old ATH of 112K.
The second zone is the buying zone. A closing price above 118,400–118,900 and consolidation with the gradual formation of a breakout of structure may hint at a possible continuation of growth toward psychological targets.
Resistance levels: 118,400, 118900
Support levels: 117100, 116700, 115500
In the chart above, I have highlighted the situations, levels, and zones that interest me more precisely.
Now I am waiting for Bitcoin to retest resistance or support and confirm certain levels, based on which decisions can be made. I think that in the near future, Bitcoin will show us where it is headed. Updates will be published as something interesting emerges...
Best regards, R. Linda!

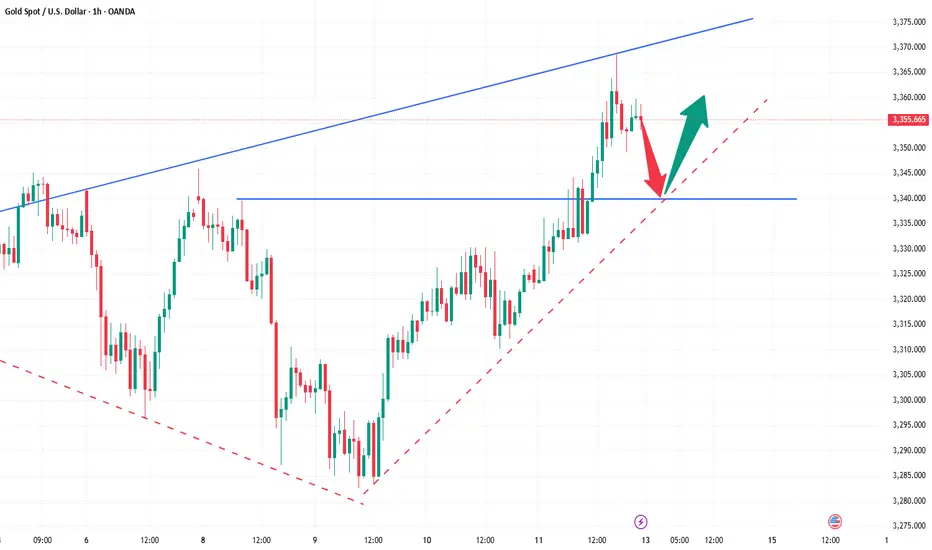
GOLD → Consolidation. Long squeeze before growth to 3400FX:XAUUSD has broken through resistance at 3353-3357 since the session opened, and bulls are currently trying to keep the market in the buying zone. Should we expect a long squeeze before growth?
Gold is in local consolidation after breaking through a key level. The price is still in the consolidation phase formed during a week-and-a-half correction. The price reached a three-week high of $3,374 on Monday but fell after the EU's conciliatory statements. Investors are awaiting US inflation data and Chinese GDP figures as they assess the prospects for a Fed rate cut. Heightened geopolitical and trade tensions are keeping demand for safe-haven assets high.
Technically, gold has entered a local buying zone, but there is a fairly complex resistance zone above it, and consolidation is needed to break through it. Such patterns could include a retest of support and a liquidity grab before growth.
Resistance levels: 3373, 3394
Support levels: 3357, 3353, 3345
There is a possibility of a retest of eql 3353 in a long squeeze format and a return to resistance at 3373 for a breakout. I also do not rule out a retest of the key level of 3345. The global trend is bullish, with the price locally in a fairly wide range, with an emphasis on the support zone of 3345-3355. If the bulls can hold this zone overall, the market will have a good chance of rising to 3400-3450
Best regards, R. Linda!

GBPUSD → Correction amid a global bullish trend...FX:GBPUSD is testing the 1.345 - 1.35 area as part of a correction. The price is closing the imbalance zone and testing support, which may trigger a reaction. Further developments will largely depend on the dollar, which is testing resistance.
The daily market structure is quite strong. The correction against the backdrop of a strong trend is within acceptable limits, and bulls should fight to keep the price away from risk zones. GBPUSD, as part of the correction, closes the imbalance zone of 1.34 - 1.35 (0.7 - 0.79f) and forms a false breakdown of the intermediate support level of 1.3476. If buyers hold their ground in the 1.347-1.35 zone, the currency pair will be able to return to the global trend.
Support levels: 1.3476, 1.345, 1.3382
Resistance levels: 1.3511, 1.359, 1.375
Price consolidation above 1.349 - 1.350 will confirm the market's intentions. In this case, we can expect growth to 1.36 - 1.374.
Best regards, R. Linda!

ETH continues to gather more upward momentumETH continues to gather more upward momentum
From our previous analysis, Ethereum is close to the last target, but the potential seems higher.
On the 60-minute chart, the price has already formed a small bullish flag pattern, indicating that the bulls are in control of the price and ETH could move beyond our last target.
I am looking for a possible upward move with targets at 3080; 3175 and 3250.
You may find more details in the chart!
Thank you and Good Luck!
PS: Please support with a like or comment if you find this analysis useful for your trading day

EURJPY Hits Major Weekly Supply | Is the Bull Run Over?EUR/JPY – Institutional Macro Context (COT)
EUR (Euro)
Non-commercials net longs increased by +16,146 → strong buying.
Commercials added +25,799 long positions.
✅ Bias: Moderately bullish.
JPY (Japanese Yen)
Non-commercials decreased longs by -4,432.
Commercials cut -20,405 long contracts.
❌ Bias: Bearish pressure remains on JPY.
Conclusion (COT): EUR remains fundamentally strong, JPY structurally weak. Institutional flows favor long EUR/JPY, but positioning is stretched.
Seasonality (July)
EURJPY shows strong bullish seasonality in July, especially over the 2Y and 5Y averages (+1.03% and +0.66% respectively).
✅ Seasonality bias: Bullish.
Retail Sentiment
89% of traders are short on EUR/JPY.
Contrarian bias = bullish confirmation.
Technical Analysis (Weekly View)
Price is pushing into a major weekly supply zone around 172.50–173.00.
RSI still elevated but showing signs of weakening momentum.
Potential double top structure forming in confluence with liquidity grab.
First downside target sits around 169.50 (daily demand zone).
Awaiting a reaction in supply and confirmation for short.
Trading Plan (Top-Down)
Wait for price to reject the 172.50–173.00 area
Watch for bearish confirmation on Daily (engulfing or lower high)
Target: 169.50 zone
Risk: tight above 173.20 (invalidating supply zone)

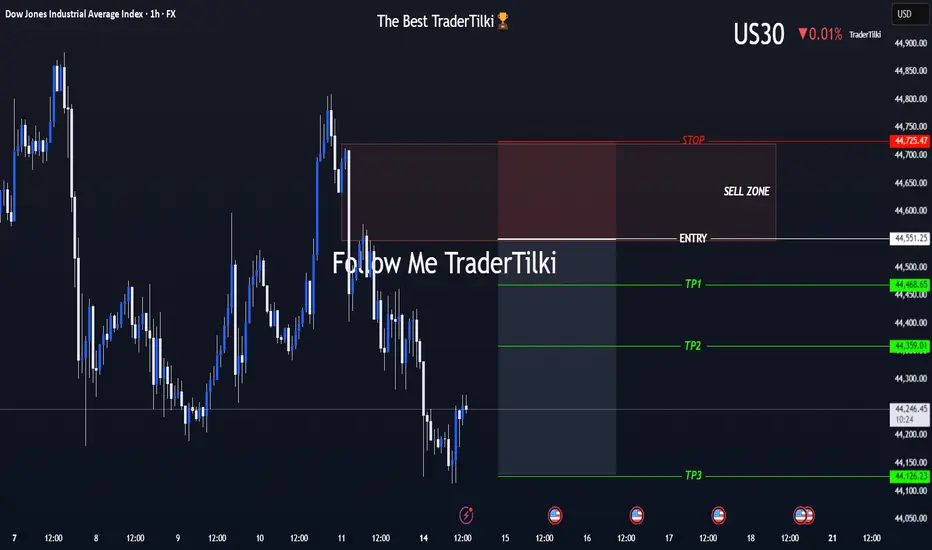
US30 (Dow Jones) Is On My Radar — The Moment’s Getting Close!Hey Guys,
I've marked my sell zone on the Dow Jones (US30) chart.
Once price reaches my entry range, I’ll be jumping into this high-probability trade setup.
🚪 Entry Levels: 44,551 – 44,632 – 44,677
🛑 Stop Loss: 44,725
🎯 Targets:
• TP1: 44,468
• TP2: 44,359
• TP3: 44,126
📐 Risk-to-Reward Ratio: Approximately 2.41 from the 44,551 entry
Your likes and support are what keep me motivated to share these analyses consistently.
Huge thanks to everyone who shows love and appreciation! 🙏
XAUUSD Daily Sniper Plan – July 14, 2025Hey team 👋 and welcome to a fresh new week on the charts!
We’re starting this Monday without any major news — just pure price action, clean zones, and structure doing all the talking. No distractions. No excuses. Let’s lock in our focus and let the market show us where the edge is.
🔸 Bias: Bearish while below 3390
Last week’s rejection from the H1 premium zone (around 3375) created clear signs of exhaustion. Price is now forming lower highs and lower lows, with clean CHoCHs on both H1 and M15. Until we reclaim 3390, we remain bearish — waiting for the next lower high to form.
🔽 Sniper Sell Zones (above current price)
3360–3370 → H1 premium FVG + CHoCH OB + EMA5 cap
3380–3390 → Inducement zone + internal imbalance + RSI divergence
🔼 Sniper Buy Zones (below current price)
3310–3320 → Discount FVG + BOS base + HL support
3280–3290 → Final HL structure zone + fib 61.8% + OB + RSI oversold
🟡 Decision Zone:
3330–3340 → Neutral zone
→ Wait for break and retest or rejection confirmation.
→ No setup = no trade.
🧠 Battle Plan – Execution Scenarios:
🔴 Scenario A – Bearish Setup Active:
If price returns to 3360–3370 or 3380–3390 and shows M15/M30 rejection → enter short.
Target: 3330 → 3310.
If 3390 is broken and held → cancel short bias.
🟢 Scenario B – Bullish Setup Activated:
If price sweeps 3320 or 3290 and reacts with strong bullish PA (engulfing or CHoCH) → enter long.
Target: 3340 → 3360.
No confirmation = stay flat, do not anticipate.
🟡 Scenario C – No Reaction / Choppy Flow:
If price consolidates between 3330–3340 without clean rejection or break → wait.
Let price show its hand. Today is Monday — we need clarity, not emotion.
Every level in this plan was drawn with purpose — no shortcuts, no borrowed zones.
If you value structure, discipline, and originality in your trading, you’re in the right place.
Your support means everything — I see every 🚀 and every comment, and I appreciate this community deeply.
Let’s keep growing, with real work and real structure.
Follow GoldFxMinds — we stay sharp, we stay true. 💛
📎 Trade Nation Disclaimer
Chart and structure based on Trade Nation broker feed on TradingView. For educational purposes only — not financial advice.

Gold Looks Bullish: technical and fundamentalHi Guys!
Gold is starting to flash major bullish signals, and this time, it’s not just about the chart. The technical setup is clean, but we’re also seeing fundamental tailwinds that could fuel a bigger move.
Let’s break it down
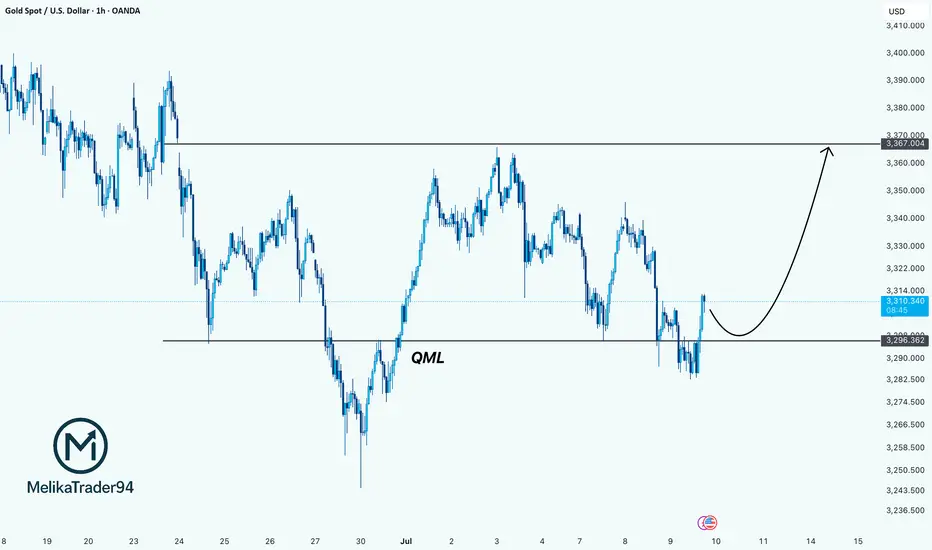
1. Technical Setup: The QML Reversal Is In Play
On the 1H chart, Gold is showing a textbook Quasimodo (QML) reversal pattern. Price made a lower low, then reversed up to break structure, and now it’s pulling back and respecting the key QML zone around $3,296.
This zone has turned into strong support. As long as we stay above it, the structure suggests a continuation toward $3,367 — a clean upside liquidity target and the previous high.
Strategy: Look for pullbacks into $3,296 for potential long entries with targets around $3,367 or higher.
2. Fundamental Tailwinds: Why Gold Is Gaining Strength
The fundamentals are stacking up in Gold’s favor right now. Here’s what’s fueling the move:
- Weakening USD & Rate Cut Expectations
With the Fed increasingly signaling rate cuts by late 2025, the US dollar is losing steam. Lower interest rates reduce the opportunity cost of holding non-yielding assets like Gold, making it more attractive to investors. Traders are already pricing this in.
- Softening Economic Data
Recent U.S. data, including weaker-than-expected job growth and declining manufacturing numbers, points to a slowing economy. That puts more pressure on the Fed to pivot dovish, which historically sends Gold higher.
- Central Bank Demand
Global central banks (especially in Asia) continue to accumulate physical Gold as part of their long-term reserve strategy. That institutional demand provides strong support at lower levels.
Technical + Fundamental = Strong Bullish Bias
We’re seeing a solid confluence here:
Chart says long (QML + bullish structure)
Macro says long (dovish Fed + weaker dollar + safe haven demand)
Drop your thought here!
BOBA NETWORK EXPLOSION TO $3+!!! ($BOBA)Boba Network is a Ethereum Layer 2 Optimistic Rollup utilizing the OP stack and part of the Superchain Ecosystem. Its considered one of the original L2 rollups along with Arbitrum and Optimism. There are now efforts being made to upgrade to ZK utilizing Succinct.
Whats special is that Boba Network is powered by HybridCompute technology that brings the power of Web2 on-chain, with smarter smart contracts that allow visionary developers to leverage off-chain compute and real-world data to build hybrid dapps that connect people to the future of blockchain applications.
The token is trading on major exchanges like Coinbase, with potential listing on Binance. There are rumors about a partnership with Pi Network, along with TradFi and Web2 companies for Real-World Assets (RWA)
Its original funding was $45 million ($3 x 15 million BOBA) for a fully diluted value of $1.5 billion. It recently raised another $75 million for further development.
Tokens that were locked in the FTX bankruptcy proceedings have now been returned to the treasury. No one else has received tokens from FTX.
The token supply now is fully diluted, which is very rare for an L2 with VC funding.
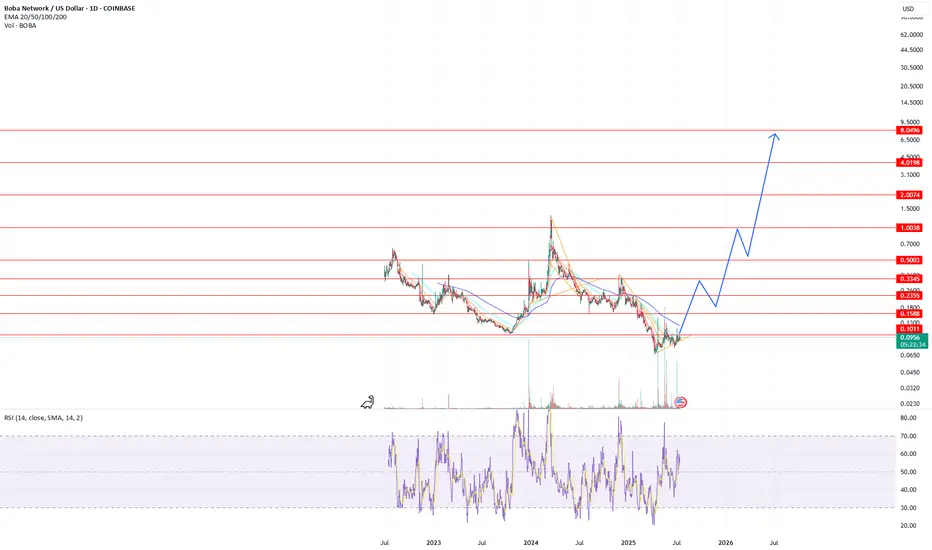
The price currently sits at approx. $0.10 for a market cap of $50 million.
Last year, the price went from $0.10 to $1.30 within a matter of weeks.
The all-time high is $8 for a market cap of $4 billion.
Simple math says BOBA is a hidden gem and can easily make $3+ for 30x once the altcoin markets, especially ETH and L2s, explode.
Once it breaks out of the ascending triangle at this level, there is very weak resistance until $1 and $3 and $8.
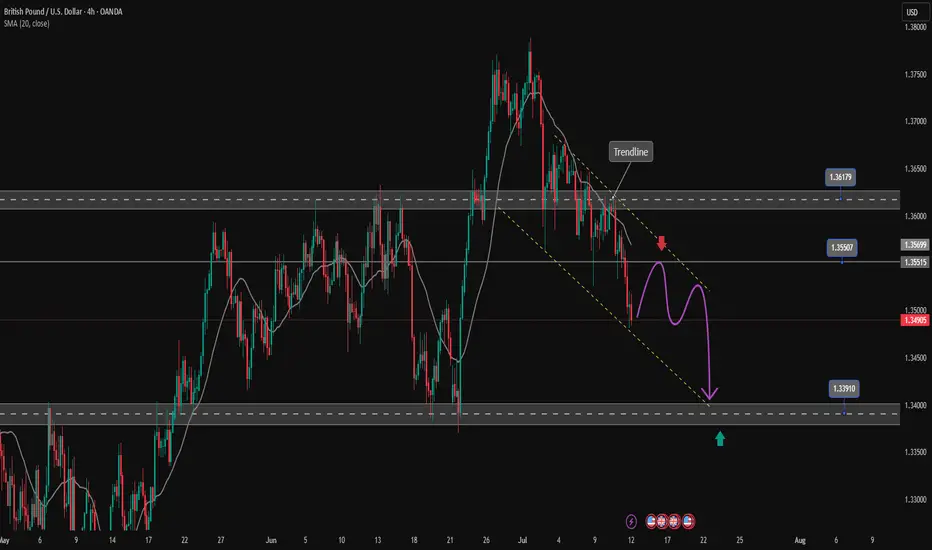
GBPUSD downtrend continuesOANDA:GBPUSD is trading in a bearish channel heading towards the important support zone of 1.340. This is the bottom support zone of last month so there is a lot of buying pressure in this zone. Any recovery of GBPUSD is considered a good opportunity to enter a SELL signal to the target. When the price breaks 1.361, the downtrend will really break.
Support: 1.340
Resistance: 1.355-1.361
SELL Trigger: rejection 1.355 with bearish confirmation
SELL zone 1.361 (Strong Resistance zone)
Target: 1.340
Leave your comments on the idea. I am happy to read your views.
XAUUSDIt seems that gold will continue its downward movement to the 3336 range after touching the 3366 price range.

"Ethereum Is The New Bitcoin" - Tom Lee ETH / Stablecoins Are the ChatGPT of Crypto
Stablecoins are exploding in adoption — just like ChatGPT took over AI and Ethereum is the engine driving that revolution. In this post, we break down 10 reasons why Tom Lee is extremely bullish on Ethereum and why it could be the single most important digital asset in the future of finance . If you're sleeping on ETH, this might be your wake-up call.
Top 10 Bullish Points from Tom Lee on Ethereum:
• Ethereum is the backbone of stablecoins , which Tom Lee compares to the “ChatGPT of crypto” due to their viral adoption and massive utility.
• Over 51% of all stablecoins operate on Ethereum , contributing to around 30% of the network’s total fees.
• Ethereum network fees could 10x as stablecoin usage grows from $250 billion to $2 trillion.
• Ethereum is positioned to lead the tokenization of real-world assets , including stocks and real estate.
• ETH could reach $10,000 if asset tokenization becomes a mainstream financial practice.
• Ethereum has a regulatory edge in the U.S. , making it the preferred platform for compliant financial innovation.
• A $250 million ETH treasury strategy is underway , aiming to use Ethereum as a long-term reserve asset.
• Institutions will buy and stake ETH to secure stablecoin networks, making ETH the “next Bitcoin.”
• Ethereum dominates the crypto ecosystem , with nearly 60% of activity including DeFi, NFTs, and dApps built on its chain.
• HODL ETH for long-term growth , as its utility, demand, and institutional support continue to rise.
Conclusion:
Ethereum isn’t just a Layer 1 blockchain — it’s becoming the core financial infrastructure for the digital age . As stablecoins expand and institutions enter, ETH could be the most asymmetric opportunity in crypto right now.
📢 Drop a like, leave your thoughts in the comments, and don’t forget to follow for more powerful macro + crypto insights. 👍👍

Weekly Close Watch: Bitcoin’s Key Level Could Shift the ChartsGood morning, Guys
There's only 1 day and 13 hours left until the weekly Bitcoin candle closes.
It's crucial that this candle closes above the 112,331 level with strong volume. Anyone experienced in economics and technical analysis knows just how significant this is.
If we get that close above the level, I’ll share a powerful analysis with a clear target.
I want to sincerely thank everyone who’s been supporting my analyses with likes—your support is
my biggest source of motivation when it comes to sharing content.
Much love to you all—we’re more than just a community, we’re a family. 💛

AUDNZD Breakout: Long Opportunity in Ascending ChannelToday I want to share with you a Long position opportunity in AUDNZD ( OANDA:AUDNZD ).
Let's first take a brief look at the AUDNZD fundamentals .
RBNZ kept rates at 3.25% , signaling likely further cuts in August.
RBA paused at 3.60% , but dovish bias remains; markets expect more easing ahead.
As NZD is more pressured by immediate rate cuts than AUD, the fundamental setup favors a bullish AUDNZD.
Now let's find a long position for AUDNZD using technical analysis .
AUDNZD seems to have managed to break through the Heavy Resistance zone(1.0963 NZD-1.0870 NZD) and is moving near the Support zone(1.0964 NZD-1.0954 NZD) on the 1-hour time frame .
AUDNNZD is also moving in an Ascending Channel .
I expect AUDNZD to rise at least to the Resistance lines , the second target is the Resistance zone(1.103 NZD-1.0993 NZD).
Note: Stop Loss(SL): 1.0944 NZD
Please respect each other's ideas and express them politely if you agree or disagree.
Australian Dollar/New Zealand Dollar Analyze (AUDNZD), 1-hour time frame.
Be sure to follow the updated ideas.
Do not forget to put a Stop loss for your positions (For every position you want to open).
Please follow your strategy and updates; this is just my Idea, and I will gladly see your ideas in this post.
Please do not forget the ✅' like '✅ button 🙏😊 & Share it with your friends; thanks, and Trade safe.

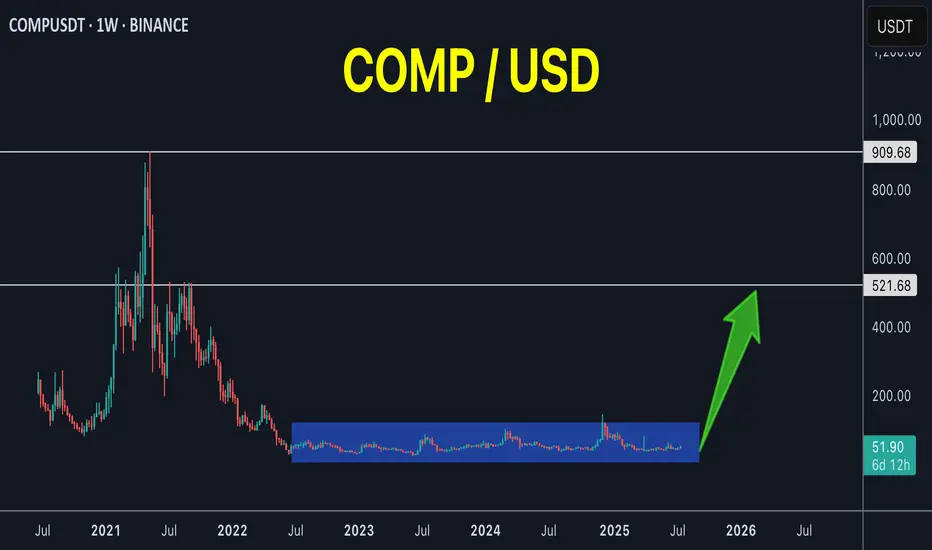
COMP 3 years of accumulation!COMP / USDT
3 years of accumulation and volume start to enter again
Just imagine if it breaks out from this long accumulation, the target will be very high but first we must breakout this accumulation box
Best of wishes
Early Week Pullback Ahead of Key Economic ReleasesGold Outlook – 14 July | Early Week Pullback Ahead of Key Economic Releases
🌍 Market Sentiment & Macro Overview
Gold has started the week with a sharp retracement after filling prior liquidity gaps (FVG) from the past two weeks.
This early weakness signals a risk-off tone as traders adopt a cautious stance ahead of a heavy macroeconomic calendar and geopolitical trade discussions.
This week’s high-impact events include:
📌 US CPI (Inflation Data)
📌 US PPI (Producer Prices)
📌 Unemployment Claims
📌 Retail Sales Figures
These data points will likely set the tone for price action through the second half of the week, with potential for sharp moves in gold.
📉 Technical Snapshot – M30 Chart Structure
Price swept minor liquidity above recent highs
Pulled back by more than $15 from the short-term top
Currently trading below the intraday VPOC (~3358), suggesting short-term bearish momentum
If the selling pressure holds, we may see a move toward:
⚠️ 333x zone — initial liquidity pool
❗ 332x zone — deeper liquidity grab before any bullish reversal
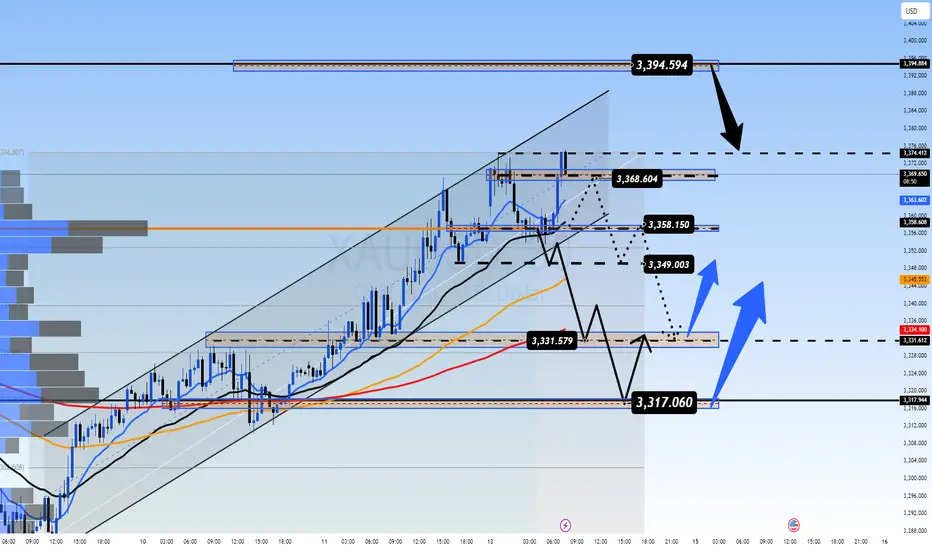
🧭 Trading Plan – Key Zones and Setup
📥 Buy Setup: 3331 – 3329 (Zone of Interest)
Stop Loss: 3325
Target Levels:
TP1: 3335
TP2: 3340
TP3: 3344
TP4: 3350
TP5: 3360 – 3370
✅ A highly reactive zone — ideal for intraday long setups if price sweeps into this area and shows bullish confirmation (e.g., volume spike or rejection wick).
📤 Sell Setup: 3393 – 3395 (Resistance Re-Test)
Stop Loss: 3399
Target Levels:
TP1: 3390
TP2: 3386
TP3: 3382
TP4: 3378
TP5: 3374 – 3370 – 3360
📉 Potential scalp zone if price retests resistance with signs of exhaustion. Monitor closely for bearish structure confirmation.
📊 Key Support & Resistance Levels
Resistance Zones:
3358
3368
3374
3394
Support Zones:
3349
3340
3331
3318
These zones remain relevant for both momentum trades and reversion setups.
⚠️ Strategy Considerations
At the time of writing, gold is trading indecisively around the M30 VPOC. No clear breakout has occurred yet.
⏳ Wait for volume confirmation during the London session
🚫 Avoid impulsive entries based on emotions or FOMO
✅ Stick to your risk parameters and let price come to your level
🧠 Summary & Bias
Gold is experiencing an early-week technical correction after recent strength.
The market is in "wait-and-see" mode, with macro drivers likely to dictate direction from mid-week onwards.
📍 Watch the 3331–3329 zone closely — it remains the most attractive level for long setups.
📍 The 3393–3395 zone is a key area to fade strength if price struggles at resistance.
Patience and precision are key this week. Let the market reveal its intention, and trade accordingly.
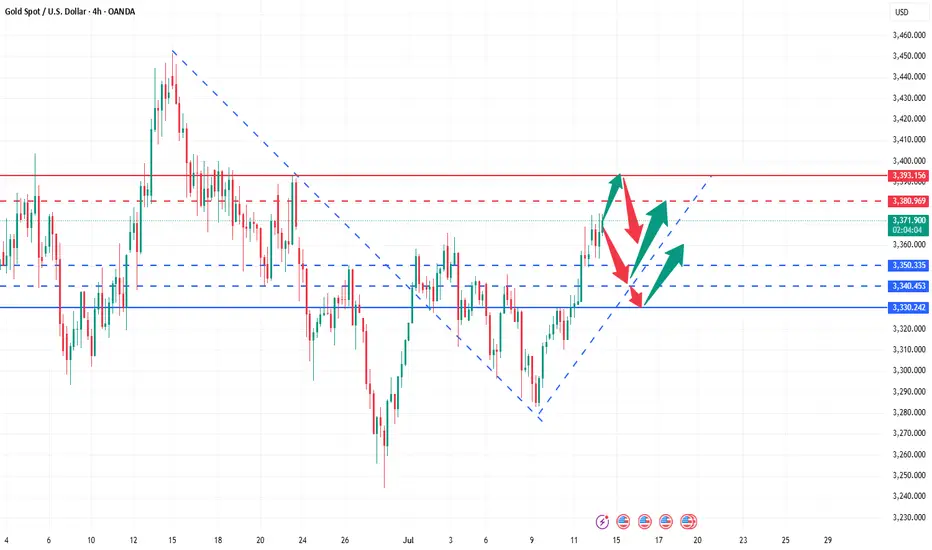
Gold rises strongly, aiming for a new high!Last Friday, gold continued to rise strongly, breaking through 3320 in the Asia-Europe session and accelerating its rise. The European session broke through the 3340 mark continuously. The US session broke through 3369 and then fell back. The daily line closed with a big positive line. It broke through the high for three consecutive days and returned to above 3360. The unilateral bullish pattern was re-established. Today, the gold price jumped high and broke through 3370 and then fluctuated at a high level. Although it rushed up, the strength was limited. It must be adjusted after a short-term retracement before it can continue to rise. Therefore, in terms of operation, we continue to maintain the main idea of retreating and multiplying. Pay attention to the 3340-3345 area for short-term support during the day, and look at the 3330 line for strong support. If it does not break, it will continue to be a good opportunity to buy low and do more. Taking advantage of the trend is still the current main tone. As long as the daily level does not break 3330, the bullish structure will not be destroyed.
🔹Support focus: 3340-3345, key support level 3330
🔹Resistance focus: 3380-3393 area
1️⃣ If the price falls back to 3340-3350, a light long position will be intervened, with the target of 3365-3370. A strong breakthrough can see a new high;
2️⃣ If the price rises to 3380-3393 and is under pressure, a short-term short position adjustment can be tried, with a short-term target of around 3360.
The specific real-time points and position arrangements will be updated at the bottom. Interested friends are advised to pay attention to my strategy tips in a timely manner and seize every opportunity reasonably.
The 3400 mark will be the key for next week!Gold has been up and down this week, and the shock wash has intensified. It bottomed out and rebounded at 3282, and then steadily pulled up. After a slow rise to 3368 on Friday, the retracement was limited, and finally closed at 3355. So can gold be expected to be strong? Is it possible to reach 3400 next week? From the trend point of view, it is too early to say that it will turn strong. 3400 is an insurmountable barrier. Only by breaking through 3400 can we see a stable strong bull. If it is suppressed below 3400, the bulls will not be stable and may fall back at any time. We can only see large range fluctuations. From the overall trend point of view, gold is currently fluctuating widely in the large range of 3250-3400. It is safe to buy below 3300, and it is easy to go up. After all, it is still upward in the long run. Next week, we will focus on the gains and losses of the 3400 mark. It is not recommended to chase the high position directly on Monday. On the one hand, the interruption of the market after the weekend holiday can easily cause discontinuous rise. In addition, after three consecutive positive lines on the daily line, there will either be a negative correction and a fall, or a large positive volume. Combined with the current trend and rhythm of gold, be careful of a high-rise fall, and it is easy to get trapped by chasing long positions at high positions. Don't feel that it will soar as soon as it rises, and the high point of 3500 seems to be within reach; don't feel that it will fall sharply as soon as it falls, and the 3000 mark is not a dream. We should stay away from those who sing long when it rises and sing short when it falls. The direction is not because you see it, so you believe it, but because you believe it, so you see it. There will always be a time when you chase the rise and sell the fall and you will return with nothing.
Moreover, the high point of 3365 has not formed a substantial break and stabilized. On Monday, we still need to focus on the gains and losses of this position, so we need to look at it from two aspects:
1. If it rises directly at the opening, pay attention to the pressure near 3370-3380 and you can go short, and the target is 3350-3340!
2. If the market falls back at the opening, go long around 3340-3330, with the target above the high point of 3360-3368.
EURUSD BUY So we have nice weekly fvg below along with a strong pivot point we could possibly see price reach this level before the push to the upside. I’m pretty confident we will have a strong push to the upside due to the macroeconomics and positioning of key players as they are still very bullish on the euro as we still creating higher highs consistently. A lot of people are in sells right now so we could see them taken out before the move to the downside they the EurUsd buy will be in play .

Why This Breakout Feels Like $29K and $48K – Big Moves Ahead?🤔📊 Why This Breakout Feels Like $29K and $48K – Big Moves Ahead? 🚀📈
Hey everyone! It’s Saturday, July 12th , and while the markets take a breather, it’s the perfect moment to zoom out and assess the bigger picture . Are we in for another retail weekend surge?
Let’s break it down 🔍👇
After closely analyzing the charts, one thing becomes clear — this breakout is structurally similar to the previous key breakouts at $29K and $48K. In both historical cases, price surged significantly without immediately retesting the breakout level.
➡️ Back in 2020, price exploded +144% above the yellow level before ever coming back to test it.
➡️ At $48K, a similar move of +49% occurred before signs of exhaustion and a retest emerged.
Fast forward to today: We've just broken above a massive ascending support zone — $114,921–$115K — and the market shows no intention of pulling back yet. This tells us something powerful: Momentum is in control.
💡 According to my technical roadmap, we may not see a retest of $115K anytime soon. Instead, the next target zone lies around $182K–$189K, depending on velocity and sentiment. With halving-to-ATH cycles historically lasting ~550 days, we’re well within that bullish window.
Remember the channel support/last entry right after the Iran-Israel ceasefire on June 23rd? That’s been a defining entry and it’s still playing out beautifully. So we wish for geopolitical stability and peace.
So, while it’s easy to feel left out — don’t short, don’t sulk. This may be our moment to ride the wave long. 🎯📉📈
One Love,
The FXPROFESSOR 💙
Disclosure: I am happy to be part of the Trade Nation's Influencer program and receive a monthly fee for using their TradingView charts in my analysis. Awesome broker, where the trader really comes first! 🌟🤝📈
