GOLD: Next Move Is Down! Short!
My dear friends,
Today we will analyse GOLD together☺️
The recent price action suggests a shift in mid-term momentum. A break below the current local range around 3,358.00 will confirm the new direction downwards with the target being the next key level of 3,349.30.and a reconvened placement of a stop-loss beyond the range.
❤️Sending you lots of Love and Hugs❤️
Gann

SELL BTCUSD NOW🚨 TRADE ALERT:
SELL BTCUSD NOW 💥📉
🔻 Market showing bearish signs.
🎯 Set your TP (Take Profit) levels wisely.
🛡️ Use SL (Stop Loss) to manage risk.
📊 Confirm with your strategy before entry.

Buy Trade Strategy for MOODENG: Tapping Into Web3 Identity Growt
This trading idea focuses on MOODENG, an emerging cryptocurrency project aiming to revolutionize digital identity and user engagement within the Web3 ecosystem. MOODENG stands out for its mission to decentralize online identity management, offering individuals more control over their data and privacy while interacting across various decentralized applications (dApps). With increasing attention on user sovereignty, data protection, and digital reputation, MOODENG is well-positioned to capture value in a growing segment of the blockchain industry that intersects with both DeFi and social Web3 infrastructure.
As governments and users alike call for more transparency and decentralization, the fundamental vision behind MOODENG aligns with long-term trends favoring open, secure, and self-managed identity systems. Still, due to the early-stage nature of the project and the volatile landscape of the crypto sector, investments in MOODENG should be made with clear awareness of potential risks and rewards.
Disclaimer:
This trading idea is provided for educational purposes only and should not be considered financial advice. Cryptocurrency markets are highly volatile and speculative. Investing in MOODENG, like any digital asset, involves the risk of partial or total capital loss. Always conduct your own research, understand your financial situation, and consult with a financial advisor before making investment decisions. Past performance is not a guarantee of future results.

GBPUSD I Daily CLS I KL - FVG I Model 1Yo Market Warriors ⚔️
Fresh outlook drop — if you’ve been riding with me, you already know:
🎯My system is 100% mechanical. No emotions. No trend lines. No subjective guessing. Just precision, structure, and sniper entries.
🧠 What’s CLS?
It’s the real smart money. The invisible hand behind $7T/day — banks, algos, central players.
📍Model 1:
HTF bias based on the daily and weekly candles closes,
Wait for CLS candle to be created and manipulated. Switch to correct LTF and spot CIOD. Enter and target 50% of the CLS candle.
For high probability include Dealing Ranges, Weekly Profiles and CLS Timing.
Trading is like a sport. If you consistently practice you can learn it.
“Adapt what is useful. Reject whats useless and add whats is specifically yours.”
David Perk aka Dave FX Hunter
💬 Don't hesitate to ask any questions or share your opinions

GBPUSD I Daily CLS I Model 1 KL FVG + SMTYo Market Warriors ⚔️
Fresh outlook drop — if you’ve been riding with me, you already know:
🎯My system is 100% mechanical. No emotions. No trend lines. No subjective guessing. Just precision, structure, and sniper entries.
🧠 What’s CLS?
It’s the real smart money. The invisible hand behind $7T/day — banks, algos, central players.
📍Model 1:
HTF bias based on the daily and weekly candles closes,
Wait for CLS candle to be created and manipulated. Switch to correct LTF and spot CIOD. Enter and target 50% of the CLS candle.
For high probability include Dealing Ranges, Weekly Profiles and CLS Timing.
Trading is like a sport. If you consistently practice you can learn it.
“Adapt what is useful. Reject whats useless and add whats is specifically yours.”
David Perk aka Dave FX Hunter
💬 Don't hesitate to ask any questions or share your opinions

EURJPY SHORT DAILY FORECAST Q3 D11 W28 Y25EURJPY SHORT DAILY FORECAST Q3 D11 W28 Y25
It’s Fun Coupon Friday! 💸🔥
Professional Risk Managers👋
Welcome back to another FRGNT chart update📈
Diving into some Forex setups using predominantly higher time frame order blocks alongside confirmation breaks of structure.
Let’s see what price action is telling us today! 👀
💡Here are some trade confluences📝
✅Daily Order block identified
✅4H Order Block identified
✅1H Order Block identified
🔑 Remember, to participate in trading comes always with a degree of risk, therefore as professional risk managers it remains vital that we stick to our risk management plan as well as our trading strategies.
📈The rest, we leave to the balance of probabilities.
💡Fail to plan. Plan to fail.
🏆It has always been that simple.
❤️Good luck with your trading journey, I shall see you at the very top.
🎯Trade consistent, FRGNT X

Gold: Market analysis and strategy on July 11Gold technical analysis
Daily chart resistance: 3375, support: 3285
Four-hour chart resistance: 3360, support: 3310
One-hour chart resistance: 3345, support: 3324.
For the current market trend, pay attention to the resistance of 3340-3345 on the upper side during the day. This is the high point concentration area that has suppressed the upward trend of gold prices many times in the early stage. If it is treated as a volatile market, sell at highs in the 3340~3345 range. If it breaks through 3345, it may trigger stop-loss buying and continue to rise to the 3355~3360 area.
The key support below is still at 3310, but from the 1-hour chart, the trend is rising in steps, and the short-term support is around 3324. Buy back here. After the Asian market was blocked near the previous high of 3345, it entered a short-term correction, and the long and short saws. It is suitable for fast in and out, and follow up and buy after breaking through 3345.
Buy: 3324near
Buy: 3310near
Buy: 3345near
Sell: 3344near

SHIB NEXT TARGET#SHIB
Shiba Inu is forming a descending channel pattern on the daily timeframe🔍
The price is consolidating above the midline support and is currently testing the MA 50💁♂️
Breaking above this MA could drive the price toward targets at $0.00001500, $0.00001750, $0.00002050, and $0.00002500🎯

Buy Trade Strategy for JASMY: Betting on Data Privacy in IoTDescription:
This trading idea highlights JASMY, a cryptocurrency that combines blockchain technology with the Internet of Things (IoT) to give users full control over their personal data. As concerns around digital privacy continue to grow, JASMY positions itself as a key player by offering decentralized data storage solutions where users can securely manage and monetize their information. The project is backed by a team of former Sony executives, adding credibility and experience to its development roadmap. With Japan’s increasing support for Web3 innovation and IoT adoption, JASMY has strong long-term potential for growth.
Still, like all cryptocurrencies, JASMY is subject to high volatility and speculative interest. Market trends, global regulations, and investor sentiment can drastically influence its price. For this reason, investors should remain cautious and ensure proper risk management when trading.
Disclaimer:
This trading idea is for educational purposes only and does not constitute financial advice. Trading cryptocurrencies like JASMY involves substantial risk, including the possible loss of your entire capital. Always do your own research, evaluate your financial position, and consider speaking with a licensed advisor before making any investment decisions. Past performance does not guarantee future results.

Bitcoin Breaks Out — Major Momentum ShiftBTC/USDT has officially broken out of the descending channel it was consolidating in for over a month. The breakout was strong, clearing the horizontal resistance at $111,862, flipping it into support.
Chart Structure:
Descending channel broken to the upside
Horizontal resistance is flipped to support
Volume confirmed breakout momentum
Key Levels:
Support: $111,862 → Newly flipped support
Resistance Zones Ahead:
$116,818
$122,342
Upside Targets:
Immediate: $116,818
Extended: $122,342
Caution: Avoid FOMO. Wait for a retest near $111,800–$112,200 to confirm breakout strength.
Bias: Bullish
Timeframe: 4H
Wait for confirmation before fresh entries.
DYOR | Not financial advice
#BTC #Bitcoin

EURUSD I Daily CLS I Model 1 I KL FVG I Target 50%Yo Market Warriors ⚔️
Fresh outlook drop — if you’ve been riding with me, you already know:
🎯My system is 100% mechanical. No emotions. No trend lines. No subjective guessing. Just precision, structure, and sniper entries.
🧠 What’s CLS?
It’s the real smart money. The invisible hand behind $7T/day — banks, algos, central players.
📍Model 1:
HTF bias based on the daily and weekly candles closes,
Wait for CLS candle to be created and manipulated. Switch to correct LTF and spot CIOD. Enter and target 50% of the CLS candle.
For high probability include Dealing Ranges, Weekly Profiles and CLS Timing.
Trading is like a sport. If you consistently practice you can learn it.
“Adapt what is useful. Reject whats useless and add whats is specifically yours.”
David Perk aka Dave FX Hunter
💬 Don't hesitate to ask any questions or share your opinions

GBPUSD LONG FORECAST Q3 D11 W28 Y25GBPUSD LONG FORECAST Q3 D11 W28 Y25
It’s Fun Coupon Friday! 💸🔥
Professional Risk Managers👋
Welcome back to another FRGNT chart update📈
Diving into some Forex setups using predominantly higher time frame order blocks alongside confirmation breaks of structure.
Let’s see what price action is telling us today!
💡Here are some trade confluences📝
✅Daily order block
✅1H Order block
✅Intraday breaks of structure
✅4H Order block
🔑 Remember, to participate in trading comes always with a degree of risk, therefore as professional risk managers it remains vital that we stick to our risk management plan as well as our trading strategies.
📈The rest, we leave to the balance of probabilities.
💡Fail to plan. Plan to fail.
🏆It has always been that simple.
❤️Good luck with your trading journey, I shall see you at the very top.
🎯Trade consistent, FRGNT X

USDCAD's Opportunity Bell Is Ringing — Don’t Miss Out!Hey there, my valued friends!
I’ve prepared a fresh USDCAD analysis just for you.
📌 If the 1.37245 level breaks, the next target will be 1.38000.
Every single like you send my way is the biggest motivation behind sharing these analyses.
🙌 Huge thanks to each and every one of you who supports me!
Would you like to add a visual or a catchy headline to boost engagement even more? I can help with that too.

Buy Trade Strategy for ENA: Backing the Ethena Protocol VisionDescription:
This trading idea is based on ENA, the native token of the Ethena Protocol, a rising star in the decentralized finance (DeFi) space aiming to build a crypto-native, yield-bearing stablecoin alternative called USDe. ENA plays a critical role in governance, staking, and incentivizing ecosystem participants. Ethena’s innovative architecture, which combines delta-neutral strategies with Ethereum-based infrastructure, has drawn significant interest from both institutional and retail users. With growing adoption, strong investor backing, and real-world use cases, ENA is positioned as a key asset for those looking to gain exposure to next-generation DeFi protocols focused on scalability and stability.
That said, the crypto market is known for its volatility. Factors such as regulatory uncertainty, market sentiment, and ecosystem risks can dramatically influence price action. Investors should consider these dynamics when planning their trades and ensure proper risk management is in place.
Disclaimer:
This trading idea is for educational purposes only and does not constitute financial advice. Trading cryptocurrencies, including ENA, involves substantial risk and can result in the loss of your entire investment. Always perform thorough research, assess your personal financial situation, and consult with a qualified financial advisor before making any investment decisions. Past performance is not indicative of future results.

AUDUSD SHORT & LONG FORECAST Q3 D11 W28 Y25AUDUSD SHORT & LONG FORECAST Q3 D11 W28 Y25
It’s Fun Coupon Friday! 💸🔥
Professional Risk Managers👋
Welcome back to another FRGNT chart update📈
Diving into some Forex setups using predominantly higher time frame order blocks alongside confirmation breaks of structure.
Let’s see what price action is telling us today! 👀
💡Here are some trade confluences📝
✅Daily Order block identified
✅4H Order Block identified
✅1H Order Block identified
🔑 Remember, to participate in trading comes always with a degree of risk, therefore as professional risk managers it remains vital that we stick to our risk management plan as well as our trading strategies.
📈The rest, we leave to the balance of probabilities.
💡Fail to plan. Plan to fail.
🏆It has always been that simple.
❤️Good luck with your trading journey, I shall see you at the very top.
🎯Trade consistent, FRGNT X

Buy Trade Strategy for SEI: Backing High-Performance Layer 1 Description:
This trading idea highlights SEI, a purpose-built Layer 1 blockchain optimized for trading and decentralized finance applications. SEI stands out in the crowded blockchain space thanks to its high throughput, low latency, and parallelized transaction processing, which are essential for the next generation of DeFi and on-chain trading platforms. With growing developer interest, ecosystem expansion, and strategic integrations, SEI is positioning itself as a foundational layer for scalable financial applications.
Its focus on performance and specialization makes SEI a strong contender for long-term growth, especially as institutional and retail demand for faster, more efficient blockchain infrastructure continues to rise. However, like all cryptocurrencies, SEI’s price and adoption remain influenced by market dynamics, regulatory factors, and competition in the Layer 1 sector.
Disclaimer:
This trading idea is for educational purposes only and does not represent financial advice. Cryptocurrency investments, including SEI, are highly speculative and come with substantial risk, including the potential for a complete loss of capital. Always conduct your own research, evaluate your risk tolerance, and consult with a financial advisor before making any investment decisions. Past performance is not indicative of future results.

Buy Trade Strategy for FET: Backing the Future of AI & BlockchaiDescription:
This trading idea highlights FET (Fetch.ai), a cryptocurrency powering a decentralized network that merges artificial intelligence and blockchain to create autonomous economic agents. These agents are designed to optimize services such as transportation, supply chain, and smart city infrastructure. FET is at the forefront of this innovative fusion, aiming to decentralize machine learning while reducing inefficiencies in data-driven industries. Backed by strong development momentum, strategic partnerships, and increasing relevance of AI technology, FET presents a compelling long-term use case in a rapidly evolving digital economy.
Still, it's important to understand that the crypto market remains highly volatile. News related to regulation, tech adoption, and market sentiment can rapidly shift valuations. Projects like FET, though fundamentally strong, are not immune to speculative pressure and risk.
Disclaimer:
This trading idea is for educational purposes only and should not be considered financial advice. Investing in cryptocurrencies like FET involves a high level of risk, including the potential for total capital loss. Always conduct your own due diligence, assess your financial condition, and consult a licensed financial advisor before making any investment decisions. Past performance is not indicative of future results.

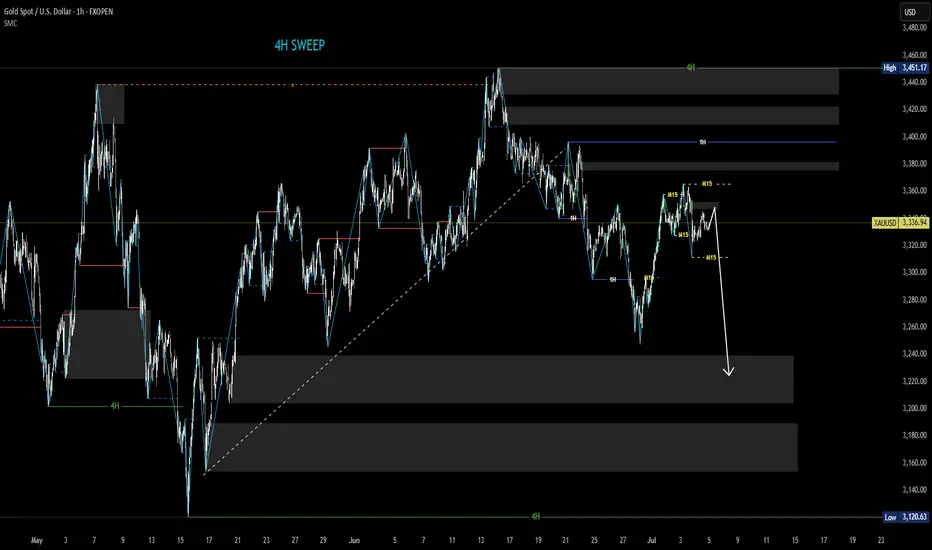
XAUUSD structure analysis on M15 and H1- 4H swing is bearish => currently giving a top sweep signal.
- H1 swing is bearish
- M15 swing is bearish
- We can look for selling opportunities according to the down structure of the M15 timeframe
USDZAR-BUY strategy 3 houely chart Reg. ChannelThe pair seems to show some strength, and think we have a chance to test 17.9150 again in the short-term. The indicators provide support as long as 17.6900 is not violated on a close.
Strategy BUY @ 17.7350-17.7550 and take profit near 17.8875.

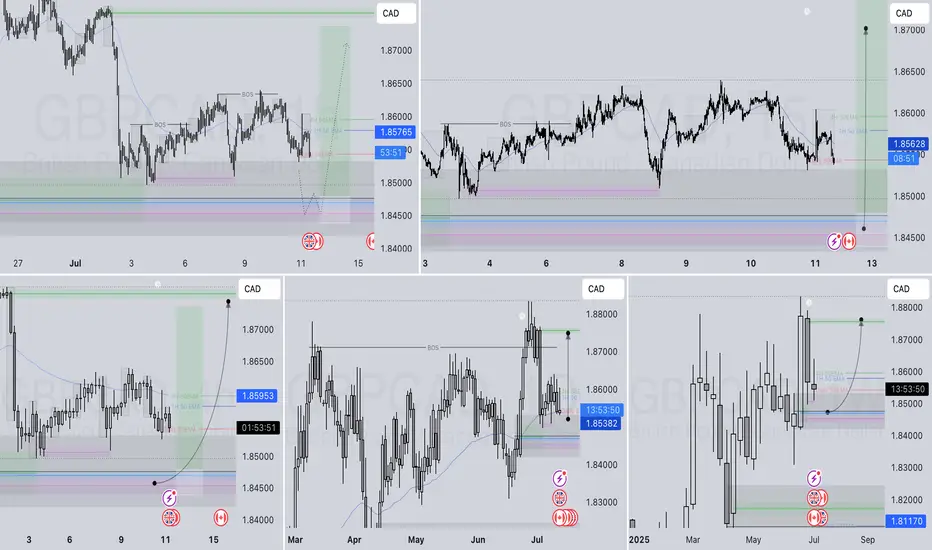
GBPCAD LONG FORECAST Q3 D11 W28 Y25GBPCAD LONG FORECAST Q3 D11 W28 Y25
It’s Fun Coupon Friday! 💸🔥
Professional Risk Managers👋
Welcome back to another FRGNT chart update📈
Diving into some Forex setups using predominantly higher time frame order blocks alongside confirmation breaks of structure.
Let’s see what price action is telling us today! 👀
💡Here are some trade confluences📝
✅Daily Order block identified
✅4H Order Block identified
✅1H Order Block identified
🔑 Remember, to participate in trading comes always with a degree of risk, therefore as professional risk managers it remains vital that we stick to our risk management plan as well as our trading strategies.
📈The rest, we leave to the balance of probabilities.
💡Fail to plan. Plan to fail.
🏆It has always been that simple.
❤️Good luck with your trading journey, I shall see you at the very top.
🎯Trade consistent, FRGNT X
EURGBP SHORT DAILY FORECAST Q3 D11 W28 Y25EURGBP SHORT DAILY FORECAST Q3 D11 W28 Y25
It’s Fun Coupon Friday! 💸🔥
Professional Risk Managers👋
Welcome back to another FRGNT chart update📈
Diving into some Forex setups using predominantly higher time frame order blocks alongside confirmation breaks of structure.
Let’s see what price action is telling us today! 👀
💡Here are some trade confluences📝
✅Daily Order block identified
✅4H Order Block identified
✅1H Order Block identified
🔑 Remember, to participate in trading comes always with a degree of risk, therefore as professional risk managers it remains vital that we stick to our risk management plan as well as our trading strategies.
📈The rest, we leave to the balance of probabilities.
💡Fail to plan. Plan to fail.
🏆It has always been that simple.
❤️Good luck with your trading journey, I shall see you at the very top.
🎯Trade consistent, FRGNT X

USDCAD LONG DAILY FORECAST Q3 D11 W28 Y25USDCAD LONG DAILY FORECAST Q3 D11 W28 Y25
It’s Fun Coupon Friday! 💸🔥
Professional Risk Managers👋
Welcome back to another FRGNT chart update📈
Diving into some Forex setups using predominantly higher time frame order blocks alongside confirmation breaks of structure.
Let’s see what price action is telling us today! 👀
💡Here are some trade confluences📝
✅Daily Order block identified
✅4H Order Block identified
✅1H Order Block identified
🔑 Remember, to participate in trading comes always with a degree of risk, therefore as professional risk managers it remains vital that we stick to our risk management plan as well as our trading strategies.
📈The rest, we leave to the balance of probabilities.
💡Fail to plan. Plan to fail.
🏆It has always been that simple.
❤️Good luck with your trading journey, I shall see you at the very top.
🎯Trade consistent, FRGNT X

Institutional Master classThis masterclass goes beyond retail-level education, focusing on real institutional trading techniques, smart money concepts, order flow analysis, and professional risk management. It bridges the gap between retail and professional trading, giving learners the edge to think, analyze, and trade like the big players.
How institutions read market structure and liquidity
Smart money footprints: order blocks, imbalances, and manipulation
Volume Profile, VWAP, and order flow tools
Option positioning and open interest analysis
Institutional risk and capital management systems
Psychological control and execution discipline
By the end of this masterclass, you'll be equipped with the knowledge, confidence, and strategy to interpret institutional activity, manage trades professionally, and compete at a global level.
