GBPUSD is in the Selling DirectionHello Traders
In This Chart GBPUSD HOURLY Forex Forecast By FOREX PLANET
today GBPUSD analysis 👆
🟢This Chart includes_ (GBPUSD market update)
🟢What is The Next Opportunity on GBPUSD Market
🟢how to Enter to the Valid Entry With Assurance Profit
This CHART is For Trader's that Want to Improve Their Technical Analysis Skills and Their Trading By Understanding How To Analyze The Market Using Multiple Timeframes and Understanding The Bigger Picture on the Charts
Gbpusdanalysis

GBPUSD: Pause in Momentum as Price Reassesses the Broader MoveGBPUSD is currently showing signs of hesitation following its recent advance, with price action suggesting a temporary pause rather than a completed move. The structure reflects a period of recalibration, where momentum has slowed and the market appears to be evaluating the next phase. This type of behaviour often develops as participants adjust positioning before the next directional expansion unfolds.
Disclosure: We are part of Trade Nation's Influencer program and receive a monthly fee for using their TradingView charts in our analysis.

Q1 | W2 | Y26 GBPUSD — FRGNT WEEK AHEAD FORECAST📅 Q1 | W2 | Y26
📊 GBPUSD — FRGNT WEEK AHEAD FORECAST
🔍 Analysis Approach
I’m applying a developed version of Smart Money Concepts, with a structured focus on:
• Identifying Key Points of Interest (POIs) on Higher Time Frames (HTFs) 🕰️
• Using those POIs to define a clear and controlled trading range 📐
• Refining those zones on Lower Time Frames (LTFs) 🔎
• Waiting for a Break of Structure (BoS) as confirmation ✅
This process keeps me precise, disciplined, and aligned with market narrative, rather than reacting emotionally or chasing price.
💡 My Motto
“Capital management, discipline, and consistency in your trading edge.”
A positive risk-to-reward ratio, combined with a high-probability execution model, is the backbone of any sustainable trading plan 📈🔐
⚠️ On Losses
Losses are part of the mathematical reality of trading 🎲
They don’t define you — they are necessary, expected, and managed.
We acknowledge them, learn, and move forward 📊➡️
🙏 I appreciate you taking the time to review my Daily Forecast.
Further context and supporting material can be found in the Links section.
Stay sharp 🧠
Stay consistent 🎯
Protect your capital 🔐
— FRGNT 🚀📈🔥
FX:GBPUSD

GBPUSD Weekly PlanThe chart is more complex. Yes, I see a test of the bullish 1W OB and the formation of a 1D RB as a sign of buyer interest, which makes an upside delivery toward the 1W FP logical.
What I don’t like is the early formation of a bearish 1D order flow, which could lead to a deeper correction, potentially down to the 1W FVG in the discount area of the weekly trading range.
Therefore, for now, I am more inclined to observe the chart rather than actively trade.

GBPUSD – H4 Supply & Demand | Bearish TrendGBPUSD has reacted into H4 supply and delivered a bearish Break of Structure, confirming a shift in market structure.
Price has swept internal sell-side liquidity but failed to reclaim bullish structure, suggesting continuation rather than reversal.
Bias: Bearish
Idea: Sell rallies into H4 or refined lower-timeframe supply
Targets: Liquidity lows below
Invalidation: Strong reclaim above H4 supply
As long as price remains below supply, the **path of least resistance remains to the downside**.

GBPUSD Supply Rejection After UTA,Range Breakdown in FocusGBPUSD shows a well-structured market cycle starting from DTA (Demand-to-Accumulation), where price consolidated before a strong impulsive move higher into UTA. This breakout phase attracted buyers, but the rally was ultimately capped by a clearly defined strong supply zone, where aggressive selling pressure entered the market. After the rejection from supply, price transitioned into a sideways range, signaling distribution rather than continuation.
Within this range, multiple attempts to push higher failed, confirming that buyers were losing control while sellers absorbed liquidity. The buyer zone below the range acted only as a temporary pause and did not generate a sustainable bullish response. This behavior supports the idea that smart money is offloading positions rather than building new longs.
As price breaks down from the range structure, bearish continuation becomes the higher-probability scenario. The first downside target lies below the range lows, with extended targets aligned toward the higher-timeframe demand zone area. As long as price remains below the strong supply zone, rallies are considered corrective, and the overall bias remains bearish toward the marked targets.

GBP.USD longs from 1.33800My focus on GU this week is to look for buy opportunities in line with the bullish trend. Price has left behind a clean 8hr demand zone that caused a break of structure to the upside, and I’ll be waiting for a retracement into that area.
Once price taps into this demand zone, I’ll look for long setups to target further upside.
Confluences for Buys:
• Price approaching a clean 8hr demand zone
• POI sits within the ideal Fibonacci dealing range
• Break of structure to the upside confirms bullish bias
• Liquidity resting above that price may look to take
P.S. If price continues higher without retracing into my zone, I’ll wait for another bullish break of structure and then identify a new POI to trade from.

#GBPUSD: Three Targets Swing Buy 720+ Pips Move **Trading Setup For GBPUSD 1 Daily Time Frame**
🔺After a while where the price was mostly down, it hit a low of 1.30 but then turned around. Since then, it has been climbing steadily, with little dips that have only made it go higher. Right now, it is at 1.3490, which we think is a good time to start a long position in GBPUSD.
🔺Trading at the current price is a smart move because the price is up, which helps keep our risk in check and makes the trade more likely to succeed. We can put a stop-loss order below the blue line we marked.
🔺To make some money, we have set three goals. First, we aim for 1.3657, which is a big wall that the price needs to get over. Once it does, we can look at the second goal, which is 1.42. We will keep doing the same thing until we reach our final goal of 1.42.
🔺We would love for you to like and comment on our analysis, as it helps us make more content. Thanks so much for your support!
Sincerely,
Team SetupsFX_🏆❤️

GBPUSDPrice is testing the bullish 1W OB, receives a buyer reaction, and forms confirmation in the form of a 1D RB. Based on this, I expect upside continuation toward the 1W FP target.
An additional scenario within the bullish 1D order flow can be considered: 1D OB ➡️ 4H OB ➡️➡️➡️ 1D/1W FP.
A lower-priority scenario is upside continuation via a sweep of the 1D FP (RB) within the 1W OB zone.

GBP/USD Price Outlook – Trade Setup📊 Technical Structure
FOREXCOM:GBPUSD GBP/USD has rebounded sharply from the 1.3449–1.3454 support zone, but the recovery has stalled near the 1.3479–1.3484 resistance zone, which aligns with a descending trendline resistance from the late-December highs. This confluence has capped upside attempts so far.
On the 1-hour chart, price action shows hesitation candles near resistance, suggesting that bullish momentum is losing strength. The broader structure remains corrective within a descending trend, with price still trading below the key trendline.
As long as GBP/USD fails to sustain above 1.3484, the technical bias favours a pullback back toward support.
🎯 Trade Setup (Bearish Bias)
Entry Zone: 1.3479 – 1.3484
Stop Loss: 1.3492
Take Profit 1: 1.3454
Take Profit 2: 1.3449
Estimated Risk-to-Reward: approx. 1 : 2.19
The bearish setup remains valid as long as price stays below 1.3484 on an hourly closing basis.
🌐 Macro Background (Simplified)
From a macro perspective, expectations of Federal Reserve rate cuts in 2026 continue to weigh on the US Dollar, which has helped GBP/USD stabilize above recent lows. However, short-term USD weakness may already be partially priced in.
At the same time, the Bank of England’s gradual easing path limits aggressive upside in Sterling. BoE officials have emphasized that each subsequent rate cut will be a “closer call,” keeping policy relatively cautious compared with market expectations for the Fed.
In short: macro forces support near-term stability, but technical resistance suggests limited upside and a corrective pullback risk.
🔑 Key Technical Levels
Resistance Zone: 1.3479 – 1.3484
Support Zone: 1.3454 – 1.3449
Bearish Invalidation: Hourly close above 1.3484
📌 Trade Summary
GBP/USD has recovered from support but is struggling to break above a key resistance zone reinforced by a descending trendline. With upside momentum fading near 1.3484, a short-term pullback toward 1.3454–1.3449 is favoured.
The bearish outlook remains valid unless price breaks and holds above 1.3484, which would signal a shift toward bullish continuation.
⚠️ Disclaimer
This analysis is for reference only and does not constitute trading advice. Financial markets involve significant risk; proper risk and position management are essential.

GBPUSD 1D planI like GBP slightly more, as we see a reaction from the 1D FVG in the form of a formed 1D RB, and on the 4H timeframe a bullish 4H OB has been formed after a liquidity sweep.
This setup can be considered as: 1D FVG → 1D RB → 1D FVG (2RR).

GBPUSD(20251230)Today's AnalysisMarket News:
Last week, Trump posted a lengthy statement on social media, which he called the "Trump Rule." He stated that the Federal Reserve, led by his soon-to-be-nominated new chairman, should lower interest rates to help keep the stock market and economy thriving, even at the risk of stimulating inflation. Trump posted, "I expect my new Fed chair to lower interest rates when the markets are doing well, not to destroy them without reason."
Technical Analysis:
Today's Buy/Sell Threshold:
1.3497
Support and Resistance Levels:
1.3543
1.3526
1.3515
1.3480
1.3469
1.3452
Trading Strategy:
If the price breaks above 1.3515, consider buying, with a first target price of 1.3526.
If the price breaks below 1.3497, consider selling, with a first target price of 1.3480.


GBPUSD - buy now it's going upGBPUSD was in a recent downtrend for the last few weeks and struggled to stay bullish, but recently it has just broken a strong resistance trend line which it tested several times and failed to break through. GBPUSD is very likely to hit the next major resistance zone which is market as the "TAKE PROFIT" LEVEL. There are many clear signs of new bullish movements. Buy GBPUSD now it's going up

DeGRAM | GBPUSD will test the support level📊 Technical Analysis
● GBP/USD has reached a well-defined support zone near 1.3470–1.3490 after a sharp selloff, where price previously reacted with strong bullish impulses. The decline slowed near the lower boundary of the descending structure, signaling potential exhaustion of sellers.
● A corrective rebound is forming after multiple bearish legs, while price attempts to stabilize below former resistance turned support around 1.3490. A move above 1.3505 would confirm short-term upside toward the upper trendline.
💡 Fundamental Analysis
● The pound finds support from reduced USD demand amid thin holiday liquidity and a pause in US macro pressure, allowing short-term corrective rebounds in GBP pairs.
✨ Summary
● Short-term long from support. Key support: 1.3470–1.3490. Upside targets: 1.3505–1.3520. Bias weakens below 1.3465.
-------------------
Share your opinion in the comments and support the idea with a like. Thanks for your support!

GBPUSD (1W + 1D Plan)The primary plan is a pullback into the discount area of the daily trading range combined with a test of the 1W OB, followed by upside continuation with confirmation on the lower timeframe.
As an alternative, GBP looks relatively strong on the chart, so I also allow for continuation to the upside after interaction with the nearest 1W OB and 1D FVG zones.
I will publish an update if new conditions are formed.

GBPUSD is in the Selling DirectionHello Traders
In This Chart GBPUSD HOURLY Forex Forecast By FOREX PLANET
today GBPUSD analysis 👆
🟢This Chart includes_ (GBPUSD market update)
🟢What is The Next Opportunity on GBPUSD Market
🟢how to Enter to the Valid Entry With Assurance Profit
This CHART is For Trader's that Want to Improve Their Technical Analysis Skills and Their Trading By Understanding How To Analyze The Market Using Multiple Timeframes and Understanding The Bigger Picture on the Charts

GBPUSD: Bullish Trend To Continue Dominating! Dear Traders,
Overview of GBPUSD📊📈
🔺The US dollar is expected to continue declining, which will likely push our GBPUSD price to an all-time high. As the new year begins, we believe this will be a key level for traders to monitor.
🔺🔺GBP has been bullish against other currencies. Next week’s price behaviour will be crucial in this trade.
Entry, Exit And Take Profit💥
🔺🔺Enter as shown in the chart, using strict risk management. Set your take profit to swing one at 1.44. For your stop loss, set it below 200 pips only if that aligns with your strategy.
Team SetupsFX_

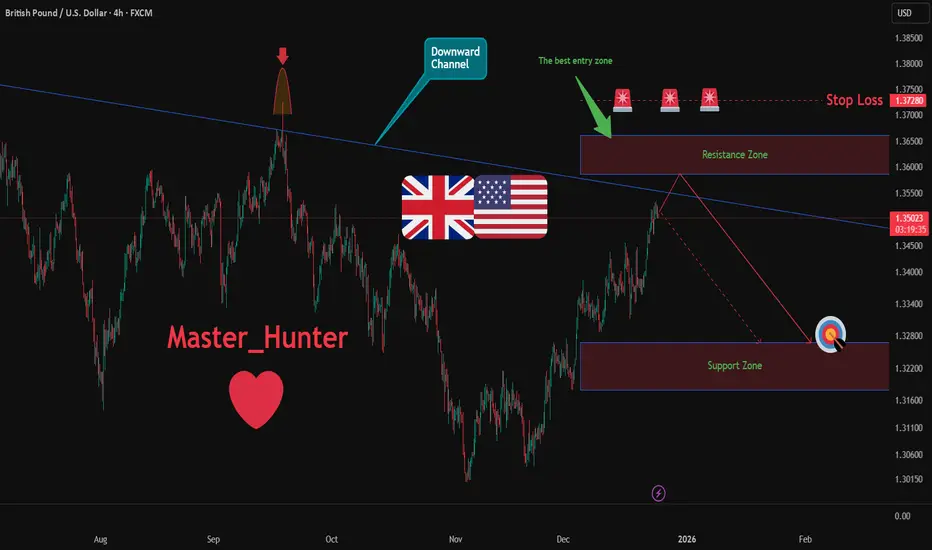
GBPUSD: Bearish Drop to 1.327?As the previous analysis worked exactly as predicted, FX:GBPUSD is eyeing a bearish reversal on the 4-hour chart , with price testing a key resistance zone after forming lower highs in a downward channel, converging with a potential entry area that could spark downside momentum if sellers defend amid recent volatility. This setup hints at a pullback opportunity in the uptrend, targeting lower support levels with risk-reward exceeding 1:2 .🔥
Entry between 1.3586–1.3660 for a short position (entry at these levels with proper risk management is recommended). Target at 1.3268 . Set a stop loss at a close above 1.3728 , yielding a risk-reward ratio of more than 1:2 . Monitor for confirmation via a bearish candle close below entry with rising volume, leveraging the channel's bearish bias.🌟
Fundamentally , GBPUSD is trading around 1.351 in late December 2025, with no major high-impact economic releases for GBP or USD this week due to Christmas (December 25) and New Year holidays, resulting in thin trading volumes and potential increased volatility from low liquidity. Markets are expected to remain quiet, with focus shifting to upcoming data in early January 2026. 💡
📝 Trade Setup
🎯 Entry (Short):
1.3586 – 1.3660
(Entry at these levels is valid with proper risk & capital management.)
🎯 Target:
1.3268
❌ Stop Loss:
• Close above 1.3728
⚖️ Risk-to-Reward:
• > 1:2
💡 Your view?
Does GBPUSD reject the 1.36 resistance zone and rotate lower toward 1.3268, or will thin holiday liquidity fuel a squeeze higher first? 👇
Also, Merry Christmas :))
GBPUSD: Bearish-Neutral. Scalp It Down For The Short Term Welcome back to the Weekly Forex Forecast for the week of Dec 22-26th.
GBPUSD structure appears to be more bearish than EURUSD. In fact, there is a bearish SMT there. I expect there to be some weakness in the market over the next couple of days, and scalping it downward would be the best bet.
Enjoy!
May profits be upon you.
Leave any questions or comments in the comment section.
I appreciate any feedback from my viewers!
Like and/or subscribe if you want more accurate analysis.
Thank you so much!
Disclaimer:
I do not provide personal investment advice and I am not a qualified licensed investment advisor.
All information found here, including any ideas, opinions, views, predictions, forecasts, commentaries, suggestions, expressed or implied herein, are for informational, entertainment or educational purposes only and should not be construed as personal investment advice. While the information provided is believed to be accurate, it may include errors or inaccuracies.
I will not and cannot be held liable for any actions you take as a result of anything you read here.
Conduct your own due diligence, or consult a licensed financial advisor or broker before making any and all investment decisions. Any investments, trades, speculations, or decisions made on the basis of any information found on this channel, expressed or implied herein, are committed at your own risk, financial or otherwise.

GBPUSD - buy nowGBPUSD was in a recent downtrend for the last few weeks and struggled to stay bullish, but recently it has just broken a strong resistance trend line which it tested several times and failed to break through. GBPUSD is very likely to hit the next major resistance zone which is market as the "TAKE PROFIT" LEVEL. There are many clear signs of new bullish movements. Buy GBPUSD now

GBPUSD is in the Selling DirectionHello Traders
In This Chart GBPUSD HOURLY Forex Forecast By FOREX PLANET
today GBPUSD analysis 👆
🟢This Chart includes_ (GBPUSD market update)
🟢What is The Next Opportunity on GBPUSD Market
🟢how to Enter to the Valid Entry With Assurance Profit
This CHART is For Trader's that Want to Improve Their Technical Analysis Skills and Their Trading By Understanding How To Analyze The Market Using Multiple Timeframes and Understanding The Bigger Picture on the Charts

GBPUSD Enters a Decision Phase After Recent ExpansionGBPUSD is showing a clear pause in momentum on the 4H timeframe, with price action becoming more compressed after its recent directional move. This behaviour often reflects a market in transition, where participation slows as traders reassess positioning and macro expectations. Rather than immediate continuation, current structure points to a period of recalibration, setting the stage for the next meaningful move once clarity returns.
Disclosure: We are part of Trade Nation's Influencer program and receive a monthly fee for using their TradingView charts in our analysis.
