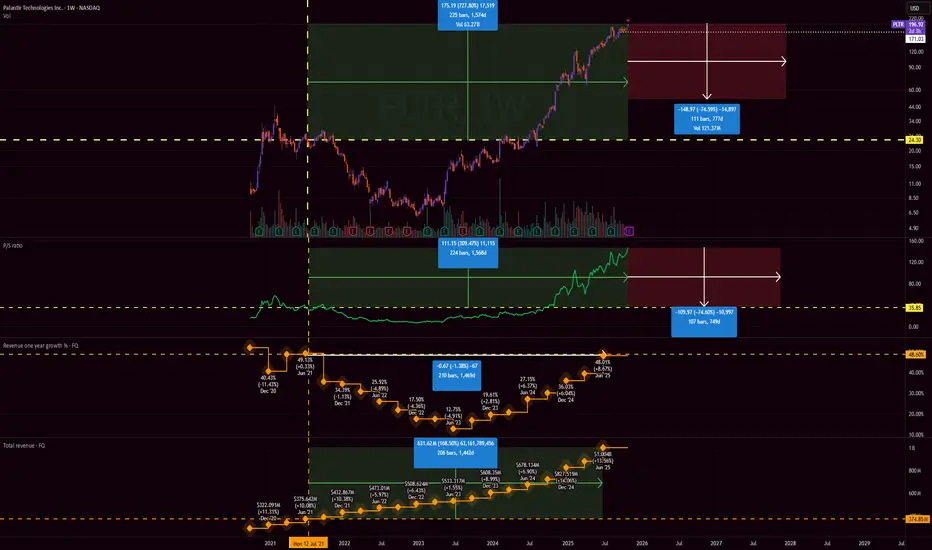
Palantir is at dot-com levels of overvaluationTl;dr, Palantir is grossly overpriced against the general market, as well as against its own financial metrics from 4 years ago, and its valuation metrics put it in peak dot-com bubble territory.
Metrics
Palantir's current price puts it at a market cap of $467.35B. With expected $3.5B in annual revenues in 2025, the price/sales (PS) ratio is at ~147 . PS ratios are the financial metric to watch for growth stocks, since growth companies prioritize revenue growth.
A high PS ratio should mean that the market expects high revenue growth. While Palantir's revenue growth is pretty high, it's not as exceptional as the PS ratio would imply. It seems that the market is not only extrapolating the revenues to continue rising, but it's also extrapolating that the growth itself (or first derivative of revenues) is going to keep increasing for years sequentially. Palantir has to generate far higher annual growth than it currently has to come close to justifying this valuation, I'd expect at least 175% annually.
For reference, Nvidia traded at a PS ratio of 43 in mid 2023, and then generated 125% growth 2 years in a row. The PS ratio stayed relatively stable since then, and never went past 43. Important thing to note here is that Nvidia also has higher net profit margins than Palantir, and profit margins play a role in how PS is interpreted (since earnings is what really matters). Palantir's profit margins have been growing consistently, from 10% -> 16% -> 32% annually, but still not close to Nvidia's 50%. Further profit margin growth would help to justify the overvaluation.
Comparisons
As the chart shows, Palantir's annualized revenue growth last quarter is equivalent to its growth in 2021 at ~50%. Revenues since then increased by 170%. Palantir at the time traded at a PS of 37, which is pretty high for 50% growth, but not too crazy.
If the stock traded at the same PS ratio as in 2021, where its growth was the same, the stock would be trading at ~$53 today at a market cap of $120B.
A PS ratio of >100 implies extreme bubble levels. From what I've found, during the very peak of the dot-com bubble:
Yahoo! traded at PS 100
Amazon traded at ~50
Ask Jeeves traded at ~55
CMGI traded at >300
Internet Capital Group traded at >200
Webvan traded at ~150
With Palantir trading at a PS of 147, it's well within the peak dot-com levels of overvaluation. While the entire tech/AI market is currently at very high valuations, Palantir still towers far above them.
Some examples of other high growth stocks today:
Crowdstrike at PS 30
AppLovin at PS 41
ServiceNow at PS 16
Netflix at PS 11
Even with the stock screener I couldn't find a stock that came close to trading Palantir's PS ratio, except for Microstrategy (which has no revenues as a crypto holding company) and for moonshot pharma R&D stocks which also have little to no sales by design.
The point of this idea is to show how grossly and absurdly overpriced this stock is, but it's not a recommendation to take a short position. The stock is so far decoupled from reality that you should consider it as equivalent to a meme coin. The financials don't matter, and it's simply an asset with a limited supply that is in high demand, so the price keeps going up.
Growth
Fiserv | FI | Long at $69.91For the first time since its IPO in 1986, a "major stock" crash has happened to Fiserv NYSE:FI . Previously, the stock "crashed" and followed the trajectory of ups and downs of the S&P 500, but this one is different. And, perhaps, a major opportunity for savy investors.
I won't say much about the financials since after today's earnings call the stock plummeted and earnings/revenue projections will get revised serval times, but this was a high-growth opportunity in the past. What I see today is a huge overreaction to a company going through a growth transition, but by all means, not dead... yet www.tradingview.com
I think we'll see leadership shakeups, layoffs, and system adaptions into 2026. This drop, and where it landed near my major crash simple moving average, hints this price cut was planned (at least algorithmically) and I won't be surprised if the near-term bottom is in or almost in in the $60s. Thus, at $69.91, NYSE:FI is in a personal buy-zone.
Conservative Targets into 2028:
$85.00 (+21.6%)
$100.00 (+43.0%)

USDJPY — Fibonacci Confluence and Trend Continuation SetupThe USDJPY pair is currently consolidating around the 153.78–153.35 Fibonacci zone after testing the 0.236 retracement from the recent swing high at 154.47. Price is holding above the short-term ascending trendline, indicating that bullish structure remains intact unless we see a clean break below the 0.618 retracement (152.64).
Key Technical Zones:
Resistance: 154.47 (swing high)
Support 1: 153.35 – 152.64 (Fib confluence and trendline zone)
Support 2: 151.50 / 150.70 (major retracement & potential buy zone)
Trade Outlook:
I’m monitoring a potential pullback toward 153.35–152.90, where buyers may re-enter for another push toward 154.40–155.00.
If price fails to hold above 152.60, the bias shifts to short-term bearish, with targets near 150.70–149.70 (1.272–1.618 extension levels).
Bias:
Bullish continuation favored while above 152.60, supported by recent USD strength and stable U.S. yields.
However, keep an eye on the upcoming Fed & BoJ events, as policy tone could shift volatility and trend momentum.

Applied Materials | AMAT | Long at $169.75Republican Ashley Moody recently dropped $200k-$500k on Applied Materials $NASDAQ:AMAT. The semiconductor boom may not be over...
Price-to-earnings: 21.68x (great in comparison to others...)
Debt-to-equity: 0.34x (low)
Cash flow: $10.4 billion (FY2024)
Insiders awarded options recently
Unless NASDAQ:NVDA brings the market down, NASDAQ:AMAT is in a personal buy zone at $169.75. While the price may dip in the near-term to the $140s, bullish until the semi boom dies...
Targets:
$195.00
$215.00
$240.00

Global E-Online | GLBE | Long at $34.55Global-e Online NASDAQ:GLBE provides a direct-to-consumer, cross-border e-commerce platform. It enables merchants to sell internationally and shoppers to buy globally, handling localization, payments, shipping, and logistics for worldwide transactions. Some companies NASDAQ:GLBE handles transactions for include Bath & Body Works, Victoria's Secret, SKIMS, Forever 21, and many more.
Technical Analysis
NASDAQ:GLBE is currently in a consolidation / "share accumulation" phase (i.e. trading sideways, overall), and the price is riding within my selected historical simple moving average. Often, the price will bounce along this area until momentum picks up and then it's off to the races to fill all the open price gaps above on the daily chart. The only concern I have is there is an open price gap on the daily chart near $21 that will likely get filled at some point. However, the earnings and revenue projections, if accurate, may delay this area from being filled for some time.
Revenue and Earnings Growth into 2028
538% earnings-per-share growth expected between 2025 ($0.34) and 2028 ($2.17).
98% revenue growth projected between 2025 ($946 million) and 2028 ($1.87 billion).
www.tradingview.com
Health
Extremely healthy, financially.
Debt-to-Equity: 0x (can't beat that)
Quick Ratio / Ability to Pay Today's Bills: 2.5x (no issues)
Altman's Z-Score/Bankruptcy Risk: 11.6 (extremely low risk)
Action
The projected growth of NASDAQ:GLBE makes sense if there is continued rapid on-boarding of blue-chip clients. There is always the chance other companies, like Shopify, will partner, too. The company is also extremely financially healthy. It should be able to weather the storm in the near-term if there is a financial downturn. That is the only major risk I see here. If the economy flips globally, such companies, regardless of their performance, will get hit hard. However, if the growth is accurate, this is a no-brainer value/growth play. Time will tell.... thus, at $34.55, NASDAQ:GLBE is in a personal buy zone with near-term risks of a drop to $21 or below if the world economy flips.
Targets into 2028
$50.00 (+44.7%)
$60.00 (+73.7%)

ASML Holding | ASML | Long at $680.00NASDAQ:ASML Holding, a developer and servicer of advanced semiconductor equipment systems for chipmakers, dipped backed into my overall, long-term selected simple moving average (SMA). From here, stocks typically bounce or drop, but given the AI boom is far from "over", I anticipate another bounce to eventually close the gap near $1,060. It may show some minor weakness to close the gap in the low $600s and get the bears excited. But, unless the economy further shows major weakness in the semiconductor space, NASDAQ:ASML is in my personal "buy zone" at $680.
Target #1 = $730.00
Target #2 = $915.00
Target #3 = $1,060.00

Why Bitcoin’s 4-Year Cycle Might Be Its Biggest LimitationFor years, traders have treated Bitcoin’s 4-year halving as sacred — a mechanical driver of boom and bust. But what if the real reason these cycles repeat isn’t the code… but the crowd?
Mechanically, Bitcoin’s issuance schedule is a smooth, predictable decline. The halving simply adjusts the slope of supply — it doesn’t dictate price. Yet, like clockwork, markets rise and fall every four years. Why?
Because we expect them to.
This expectation creates a self-fulfilling feedback loop:
- Pre-halving optimism fuels accumulation and speculative positioning.
- Post-halving euphoria drives parabolic rallies as new participants flood in.
- Overvaluation and leverage eventually unwind, triggering brutal corrections.
The halving became the metronome of market psychology — a narrative so powerful that it shaped behavior more than fundamentals ever did.
🧠 The Institutional Shift
Now, that narrative is being rewritten.
Institutions don’t trade on memes or cycles — they trade on models, liquidity, and risk.
Unlike retail investors, institutions hate volatility. They don’t chase euphoria; they manage exposure.
- ETFs and funds accumulate steadily through structured inflows.
- Option and futures desks hedge risk dynamically, suppressing volatility.
- Algorithmic allocators rebalance based on Sharpe ratios, not halving hype.
This structural participation acts as a volatility dampener — flattening the amplitude of Bitcoin’s historic boom-bust waves.
🌍 From “Halving Cycle” to “Liquidity Cycle”
As Bitcoin matures, the real driver of its price action is shifting away from internal events and toward macro liquidity conditions :
- When global liquidity expands (rate cuts, QE, easing credit), Bitcoin thrives.
- When liquidity contracts (rate hikes, QT, risk-off sentiment), Bitcoin cools.
In this new phase, the halving’s scarcity still matters — but it’s no longer the heartbeat.
Instead, Bitcoin is syncing to the rhythm of global capital flows.
📈 The New Market Identity
We’re watching Bitcoin transition from a reflexive narrative asset to a macro-integrated store of value .
If this continues, the implications are profound:
- Shallower drawdowns and fewer liquidation cascades.
- More consistent accumulation across cycles.
- Higher institutional allocation as volatility compresses.
Ironically, the same psychological loop that once fueled Bitcoin’s meteoric rise may now be what caps its potential.
The halving didn’t make Bitcoin cyclical — investor behavior did .
And as smart money takes over, that feedback loop may finally be breaking.
🚀 What This Might Mean for Future Bull Runs
If institutions continue to dominate Bitcoin’s liquidity, the next bull runs may look less like fireworks and more like steady expansion — smoother, slower, but more sustainable.
Instead of 12-month parabolas followed by multi-year winters, we could see:
- Extended accumulation phases where price grinds higher over longer horizons.
- More efficient corrections that reset leverage without catastrophic selloffs.
- Reduced retail blow-off tops as narrative-based speculation loses power.
That doesn’t mean the explosive upside is gone — it means the path to higher valuations might look more like a compound growth curve than a recurring bubble.
The next phase of Bitcoin’s evolution isn’t about chasing the halving — it’s about understanding liquidity, positioning, and psychology on a global scale.
- The crowd traded Bitcoin like a story.
- Institutions are turning it into a system.

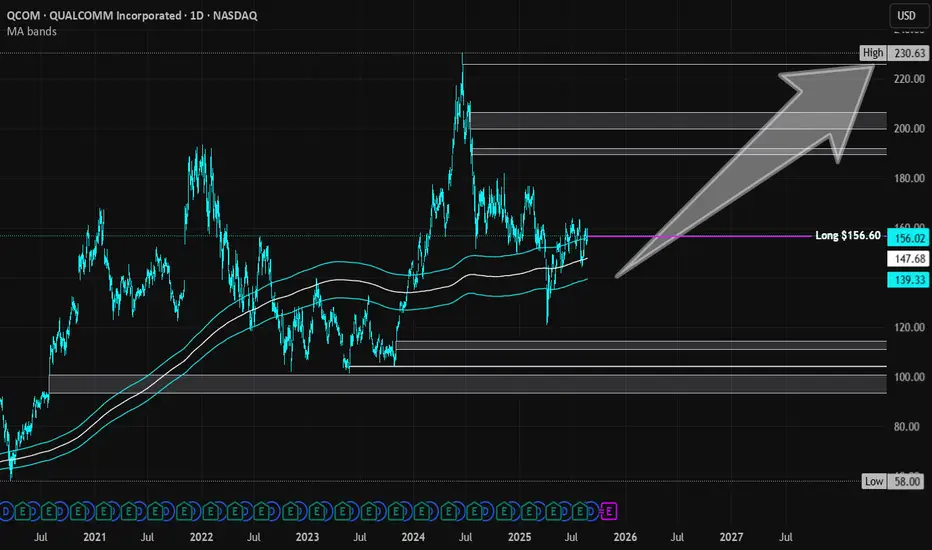
Qualcomm Inc | QCOM | Long at $156.60Qualcomm NASDAQ:QCOM is a global leader in wireless technology, focusing on 5G chipsets, AI-capable Snapdragon processors, and connectivity solutions for smartphones, IoT, and automotive. Revenue through 3 quarters of 2025 is ~$40B. Revenue growth is anticipated to be 10-12%, year over year (2026: ~$45B; 2027: ~$50B; 2028: ~$56B). 5G adoption, AI chip demand, and automotive needs should continue to drive the stock price. Earnings per share are projected to grow 12-14%, year over year (2026: ~$11.20; 2027: ~$12.80; 2028: ~$14.70). Thus, the future looks quite bright for NASDAQ:QCOM .
Regarding price, it is currently trading at a PE of 15x and has a 2.25% dividend. The price is resting just above my historical simple moving average channel. I do anticipate it to drop into the channel (down in the high $130's-$140's) in the near-term due to typical September selloffs. However, I plan on adding more in the zone. A major bear case would be a major drop into the $90's to fill the price gaps on the daily chart before moving higher. I do not think this will happen unless a major catalyst in the market emerges - but always be prepared. Regardless, it is a strong company providing products and services that are in high demand. Currently fairly valued, I believe it become undervalued as the demand for 5G and new phone chips with AI capabilities emerges.
Thus, at $156.60, NASDAQ:QCOM is in a personal buy zone with a likely near-term drop into the $130's and $140's.
Targets into 2028:
$191.00 (+22.0%)
$225.00 (+43.7%)
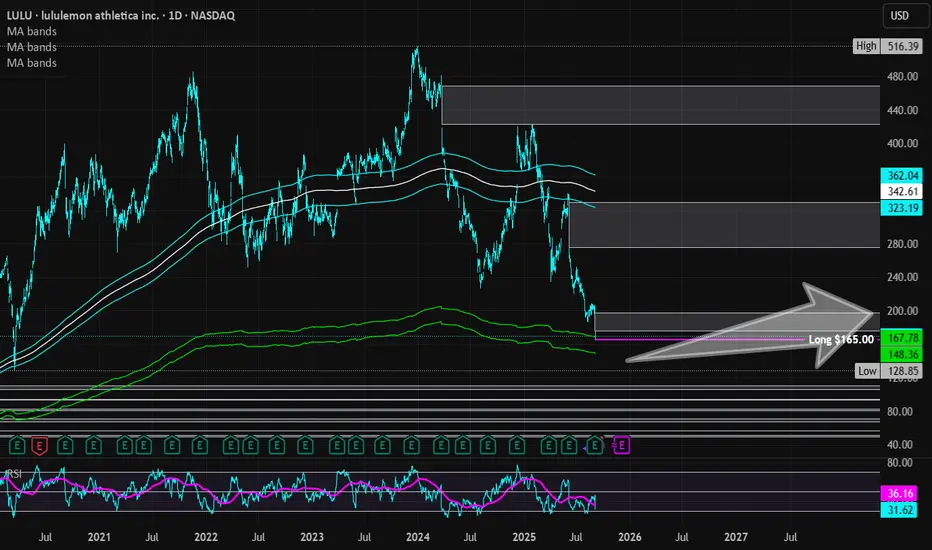
Lululemon Athletica | LULU | Long at $165.00Lululemon $NASDAQ:LULU. If you don't think the US is in a recession, examine most retail stocks right now. But this doesn't mean doom and gloom are here from a US government/news narrative - in fact, the complete opposite. AI and tech are solely propping up the US stock market ... but pay no attention to the issues behind the curtain! Once interest rates start dropping, trading and investing are going to get wild before the cracks open up.
Okay, off my soap box...
NASDAQ:LULU entered by "crash" simple moving average zone (green lines) today after earnings. Competition is finally catching up to the company, but expansion into China and other foreign areas *may* revive them in the next 1-2 years. While most analysts are relatively bullish, I'll stay centered. I wouldn't be surprised if the stock dips into the $140's and $150's in the near-term. Bigger news will have to come out for me to stay long-term, but I'm holding here or even lower. Additional entries will be made in the $140's-$150's to swap out the position I just made at $165.00 for the future.
Thus, at $165.00, NASDAQ:LULU is in a personal buy zone with the risk of a continued drop to the $140's and $150s. Christmas rally potential...
Targets into 2028:
$185.00 (+12.1%)
$197.00 (+19.4%)
Netflix Earnings Market OverreactionAt this point we all know that Netflix is a common part of an average American's life. However, we came to terms with reality that the global field has a larger effect on the NASDAQ:NFLX than we might think. As we saw in the Q3 '25 earnings report, Brazil levied a one time tax bill on Netflix that charged them over half a billion in back taxes under a court ruling in local rules. This expense has not actually been paid yet, but has been reported on the financial reports as seen in the recent report. However, this should cause some eyebrows to raise as the stock has dropped over 18% from the all time high and over 8% this week. Most would assume that Netflix blew it on the earnings and that the stock should be toxic until 2026, but this may not be the case for those who look a little closer.
Firstly, lets tackle the elephant in the room. As stated before, Netflix showed nearly a $619,000,000 one-time tax expense levied by the Brazilian government concerning back taxes in revenues. Sure, this isn't necessarily good for their business, and it could be assumed that the Netflix was not very excited to report this on their statements. However, the nature of this tax should imply that this is not an ongoing part of their operations and this should not be expected in the quarters to come. Netflix also felt the need to state that operating margin would have beaten guidance had this not shown up on the income statement. So although this isn't good, it's not a core part of the companies health and operations continue to be profitable and should expect to stay that way.
Unfortunately, this odd tax expense overshadowed a key statistic, and no it's not some ratio or percentage. It's the Q3 stock buyback number which comes out to:
- 1,500,000 shares bought back
- Average price @ $1,220
- About $1.8 Billion in total spent on buybacks.
Even with these impressive numbers, we still cant fully capture just what Netflix is capable of in this aspect. Currently, they are sitting on $10 billion in pending authorization for stock buyback with no shelf registration. This means that Netflix is currently only allowed to buy their own shares back and not sell any to the financial markets until they file a shelving registration with the SEC. Now, there shouldn't be any need to explain why these metrics are bullish but the recent events show what was stated previously, and that is: the market has overreacted to the Netflix earnings miss.
So what's the course of action? The simple answer we can pose is to buy the dip. Simply buy the asset on discount and wait for it to rise, then sell for what should be a market beating profit. It also seems that some analysts are already on this case, with some projecting a 30% upside in the near future. I wouldn't disagree with them as Netflix looks to be a very attractive price. I wouldn't expect it to move in such a manner as my SanDisk callout but I also don't see a reason why this trade cant turn a nice profit going into the new year.
Basis Price @ $1,100
Time expectation: 1-6 months
Target price: $1,350-$1,500

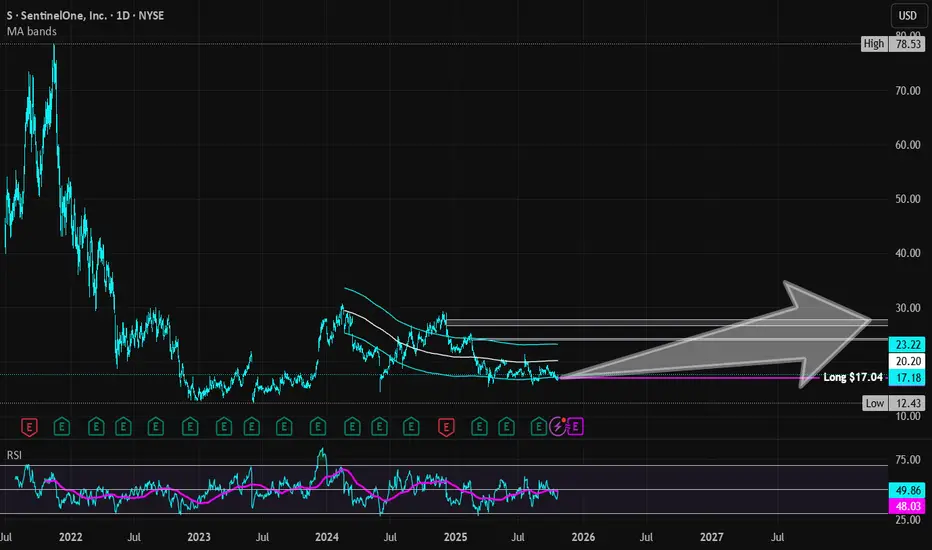
SentinelOne | S | Long at $17.04SentinelOne NYSE:S : a cybersecurity company that uses an autonomous AI-powered platform to performs real-time threat detection, prevention, and remediation across endpoints, cloud, and IoT.
Technical Analysis
Price is consolidating along my historical simple moving average (a regression to the mean). This is after a meteoric rise in 2021 to $78.53 (just after the IPO) and then collapse to $12.43 in 2023. While near-term ups and downs may persist for a bit, usually a price consolidation near the historical simple moving average eventually leads to a major move. The simple moving average band is getting tighter, signaling the potential for a move out of the zone "soon". Given the grow, niche, and need, the future may be bright with this one.
Growth
www.tradingview.com
820% growth expected in earnings per share between 2024 ($0.05) to 2027 ($0.46)
75% revenue growth projected between 2024 ($821 million) to 2027 ($1.4 billion)
Health
Debt-to-equity: 0 (perfection)
Altman's Z Score \ Bankruptcy Risk: 3.3 (extremely low risk)
Quick Ratio: 1.7 (they are able to pay current bills without relying on debt)
Insiders
Warning: Lots of selling and no buying...
openinsider.com
Action
SentinelOne NYSE:S is an extremely healthy company with very high-growth potential. However, the cybersecurity landscape is highly competitive, but NYSE:S is forming a niche with AI-powered tools. While insider selling is a red flag, that is all I can see here besides competition (or the company secretly falling apart behind the scenes). That's the risk we all take as investors. Thus, at $17.04, NYSE:S is in a personal buy zone.
Targets into 2028
$24.00 (+40.8%)
$27.50 (+61.4%)
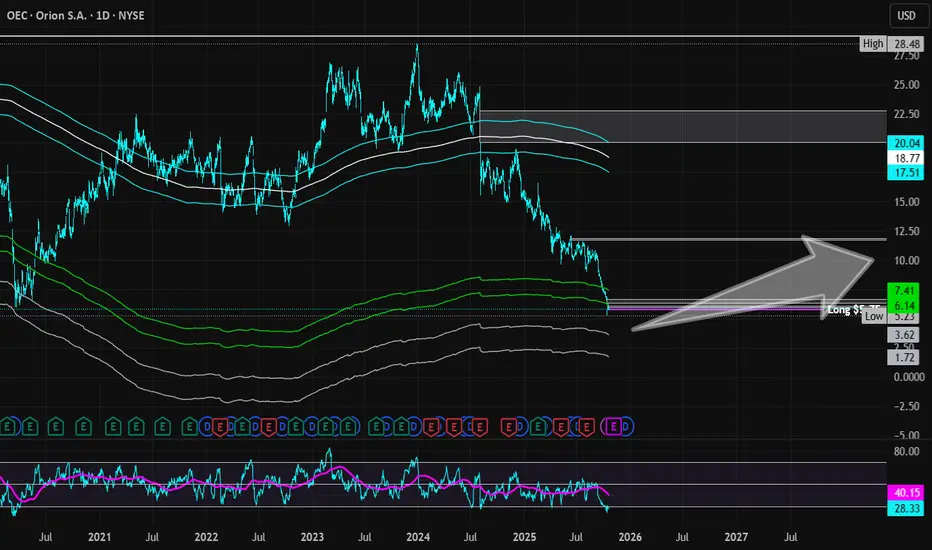
Orion S.A.| OEC | Long at $5.75Orion NYSE:OEC : Another chemicals company in the dumps, but is it justified - long-term?
Technical Analysis
Price fell through my "crash" simple moving average zone (green lines). The last time this happened the price moved down to my "major crash" zone (gray lines) and subsequently rallied to a 4x investment 1.5 years later. Not to say that same trajectory will happen, but this company (like all chemical companies) are historically cyclical. The price may continue to drop into the $3's in the near-term and complete the "major crash" touch, but a longer-term outlook is likely to generate positive returns... likely...
Growth
A bad 2025, but beyond that, projections show growth in earnings and revenue through 2027: www.tradingview.com
Fair Value and Health
Fair value: $8.30
Tangible Fair Value: $6.58
Company cut its 2025 guidance due to softer demand and shifted focus to free cash flow generation.
Debt-to-equity: 2.19x (high)
Action
While this is mostly a technical analysis play, there are so many opportunities right now with chemical companies. The tape beyond 2025 is likely to be positive and those who can stomach the near-term risks (i.e. $3's) may do well long-term. But there are better plays out there for the impatient.
Targets into 2028
$6.60 (+14.8%)
$9.00 (+56.5%)
Diwali Setup: Long on Hope, Short on Doubt.Wishing you and your loved ones a Diwali filled with light, laughter, and new beginnings.
May this festival bring clarity to your path, warmth to your heart, and prosperity to your home.
🪔✨ Happy Diwali
This festive season, I’m charting more than markets—I’m charting renewal.
May your trades be guided by clarity, your risk managed with wisdom, and your journey lit with purpose.
🪔📈 #DiwaliSetup #TradingViewIndia #CandlesOfClarity #TechnicalAnalysis #FestivalOfLights

GoDaddy | GDDY | Long at $128.90GoDaddy NYSE:GDDY is the world's largest domain registrar, managing over 84 million domains for over 21 million customers. AI, particularly through GoDaddy's Airo platform and related GenAI tools, is poised to drive outsized growth by supercharging product innovation, customer value, and operational efficiency.
Technical Analysis
The stock has dropped 35% so far in 2025, but this was after a meteoric 208.5% rise from October 2023 to December 2024. The price has now regressed to my selected historical mean - a typical share-accumulation region for algorithmic trading when it comes to high-growth stocks. While this is often a solid area of support, it may dip down to $115 to shakeout retail traders. Obviously, further declines would occur if fundamentals change, but the forward growth is highly attractive, and I doubt it will "crash" from here if the outlook remains positive.
Earnings and Revenue Growth into 2028
Projected earnings-per share growth between 2025 ($5.98) and 2028 ($11.12): 86.0% (AI effect...)
Projected revenue growth between 2025 ($4.92 billion) and 2028 ($6.19 billion): 25.8%
Current P/E: 22x (remaining tech sector: 45.7x)
www.tradingview.com
Insiders
Warning: Lots of insider selling and no recent buying.
openinsider.com
Health
Debt-to-equity: 9x (very high, but due to aggressive share repurchases rather than distress)
Cash flow remains a bull case cornerstone, with accelerating free cash flow conversion (>100% of EBITDA) underscoring operational leverage from AI efficiencies and premium customer shifts.
Action
GoDaddy NYSE:GDDY is a prominent name and leader in domain registration. As AI enhancements lead to improvements in operational margins, earnings are likely to grow tremendously into 2028. Once agentic AI search enters the scene, it will be very interesting to better understand the importance of such a domain registration company for its successful implementation. While the price may dip beyond the historical mean to shakeout some retail traders, I think the future of this currently undervalued, high-growth company into 2028 is very bullish. Thus, at $128.90, NYSE:GDDY is in a buy-zone with potential near-term risk between $100 and $115.
Targets into 2028
$160.00 (+24.1%)
$200.00 (+55.2%)

Bioceres Crop Solutions | BIOX | Long at $1.43Technical Analysis
Bioceres Crop Solutions NASDAQ:BIOX has entered my selected "crash" simple moving average. This area is often a zone of share accumulation and may result in a trend reversal (or a short-term stair-step down to $1 or lower before trading sideways).
Growth, Fundamentals, & Health
Not expected to become profitable again until 2028.
Earnings-per-shares growth from 2026 (-$0.26) to 2028 ($0.56): +323%
Revenue growth from 2026 ($350 million) to 2028 ($511 million): +46%
Current Fair Value: $5
Debt-to-Equity: 0.9x (very good / healthy)
Altman's Z-Score/Bankruptcy Risk: .9 (high risk, some financial distress)
Action
75% technical analysis play and only 25% based on company fundamentals. The only major risk based on the data is bankruptcy. The near-term could be rough for the company, but the outlook into 2028 shows significant growth. Thus, at $1.43, NASDAQ:BIOX is in a personal buy zone. There could be near-term risk near $1 or a bit lower, but this one is a total gamble. Time will tell.
Targets into 2028
$2.00 (+39.9%)
$4.00 (+179.7%)

CCJ/QQQ long NYSE:CCJ NASDAQ:QQQ AMEX:NUKZ $CCJ/NASDAQ:QQQ
Secular shift and outperformance in uranium and nuclear energy companies compared to QQQ

diwali pick 6 : ganesh consumer productkey facts about Ganesh Consumer Products, organized by category:
Product Portfolio (42 products, 232 SKUs)
– Whole Wheat Flour: Sharbati, White, Multigrain, Diabetes Control, Gluten-Free Atta
– Value-Added Flours: Bakery Maida, Super Fine Maida, Tandoori Atta, Rumali Atta
– Roasted Gram Flour (Sattu): Multigrain, Sweet, Jaljeera, Chocolate Sattu
– Spices: Turmeric, Chili, Coriander (whole & powder), Cumin (whole & powder), blended masalas
Manufacturing Footprint (7 plants)
– West Bengal (Kolkata): Jalan Complex I (Sooji/Maida 47,850 TPA; 72% util), Jalan Complex II (Spices 2,552–5,104 TPA; 2–27% util), Padmavati Unit (Atta 47,850 TPA; 80% util; Maida/Sooji 47,850 TPA; 54% util; Dalia 7,656 TPA; 74% util)
– Food Park: Sattu 15,950 TPA (49%), Besan 6,380 TPA (62%), ethnic flours 6,380 TPA (37%)
– Uttar Pradesh: Varanasi (Atta 47,850 TPA; 41%), Agra (Sooji/Maida 47,850 TPA; 63%)
– Telangana: Hyderabad (Maida/Sooji 63,800 TPA)
Business Model & Distribution
– 77% B2C revenue; remaining from B2B sales and by-product off-take
– 28 C&F agents, 9 super-stockists, 972 distributors, 70,000+ retail outlets
– Presence in 204 modern-trade stores and on multiple e-commerce platforms
IPO & Use of Proceeds
– Raised ₹409 crore in September 2025 IPO (listed Sep 29, 2025)
– Fresh issue ₹130 crore to: repay debt; fund Darjeeling gram-flour/Sattu unit capex; general corporate purposes
This comprehensive network, diversified SKU base, robust manufacturing capacity, and capital infusion position Ganesh Consumer for continued growth in its core flour and spice categories.

diwali personal favourite pic 4: vip ind my thesis is In BHARAT, THE tourism HAS TO to pick pace and this a proxy play in the same segment
healthy time and price correction seemingly completes .
India’s organized luggage market reached an estimated ₹4,450 crore in retail value during CY 2024–25, expanding at a robust 9.6% CAGR
over the past five years and accounting for roughly 12 million units sold annually.
Modern retail outlets and branded stores command around 65% of sales, while e-commerce contributes 20% and traditional/unorganized channels .
the remaining 15%. Hard-shell suitcases lead the category with a 52% share, followed by soft-side trolleys at 28%, backpacks and duffels at 15%, and travel accessories at 5%.
At the forefront of the market, VIP Industries holds a 32% revenue share, underpinned by its extensive distribution network,
while Safari Industries occupies the second spot with an 18% share by focusing on the value segment. American Tourister, part of the Samsonite Group, captures 15% of the market, and Samsonite itself secures 10% by positioning in the premium segment.
Youth-oriented Skybags accounts for 7%, and a diverse set of domestic players—including Wildcraft and Carlton—make up the remaining 18%. In terms of pricing, 45% of units are sold in the economy segment (under ₹2,000), 40% in the mid-range (₹2,000–5,000), and 15% in the premium bracket (above ₹5,000). Looking ahead,
the market is projected to reach nearly ₹6,300 crore by CY 2028 at a faster 10.5% CAGR, driven largely by premium and “smart” luggage innovations such as ABS-PC blends and RFID-enabled locks, as well as the continued growth of e-commerce and omnichannel retail strategies.

Why Global Markets Matter for GrowthGlobal markets play a central role in the development and growth of economies around the world. In an increasingly interconnected world, no economy operates in isolation. Trade, investment, technology, and financial flows cross borders at an unprecedented scale, shaping the pace and quality of economic growth. Understanding why global markets matter for growth requires examining their multifaceted influence on investment, productivity, innovation, employment, and resilience.
1. Access to Larger Markets
One of the most immediate benefits of global markets is access to a larger pool of consumers. Domestic markets are often limited in size, particularly for smaller or developing economies. By participating in global markets, firms can scale their operations, sell to international consumers, and achieve higher revenue.
For example, companies in countries like South Korea or Germany have leveraged global demand for electronics and automobiles to grow rapidly. Access to foreign markets allows businesses to produce at larger scales, reduce per-unit costs, and benefit from economies of scale. These efficiencies, in turn, contribute to higher profitability and reinvestment in growth initiatives, such as research, infrastructure, and human capital.
2. Attraction of Foreign Investment
Global markets are also crucial for attracting foreign direct investment (FDI) and portfolio investment. FDI provides not just capital but also advanced technology, managerial expertise, and global best practices. Countries that are well integrated into global markets become attractive destinations for multinational corporations seeking efficiency, skilled labor, or strategic locations.
Foreign investment can accelerate growth by funding new projects, improving infrastructure, and creating jobs. For instance, the inflow of FDI into India’s technology and manufacturing sectors has fueled innovation, increased employment, and enhanced productivity. Beyond direct capital, foreign investment signals confidence to other investors, creating a virtuous cycle of growth and integration into global economic systems.
3. Enhanced Competition and Productivity
Integration into global markets exposes domestic firms to international competition. While this can be challenging, it encourages businesses to improve efficiency, innovate, and adopt better management practices. Competition ensures that resources are allocated more effectively, firms focus on core competencies, and consumers benefit from higher quality products at competitive prices.
Research shows that countries more integrated into global trade networks experience higher productivity growth. For example, Vietnam’s integration into global supply chains for electronics and apparel has forced domestic firms to adopt advanced technologies and production methods, improving overall productivity and growth.
4. Technology Transfer and Innovation
Global markets facilitate the exchange of ideas, technology, and innovation. Firms that operate internationally gain access to the latest technological advancements and can adopt them faster than purely domestic firms. This process—often referred to as technology transfer—enhances productivity and encourages the development of new products and services.
Innovation is further stimulated through collaboration with foreign partners, exposure to international best practices, and learning from global competitors. Countries that embrace global markets tend to have stronger innovation ecosystems, which can drive long-term economic growth. For instance, the rise of China’s high-tech manufacturing sector was fueled by its engagement with global markets, allowing it to adopt and eventually innovate on advanced technologies from abroad.
5. Diversification and Risk Management
Global markets allow countries and businesses to diversify their economic activities, reducing dependence on a single sector or market. Diversification helps stabilize economic growth by mitigating the impact of domestic shocks or downturns in specific industries.
For example, countries reliant solely on commodity exports may face volatility when global commodity prices fluctuate. Engaging in global markets—through trade, investment, or financial integration—enables economies to spread risk and maintain more stable growth. Access to global financial markets also provides avenues for risk hedging, such as currency and commodity derivatives, which help businesses plan and invest with confidence.
6. Employment Generation and Human Capital Development
Participation in global markets often leads to higher employment opportunities. Export-oriented industries, multinational operations, and global supply chains require labor, often leading to job creation in manufacturing, services, and technology sectors.
Beyond job creation, global engagement improves human capital. Exposure to international standards, training, and work culture elevates skills and productivity. Workers in globally connected industries often receive better training and experience, which contributes to overall economic growth and competitiveness. For example, countries like Ireland and Singapore have leveraged global market access to develop highly skilled labor forces, fueling sustained growth in technology, finance, and services.
7. Capital Market Development
Global markets are not limited to trade and investment in goods; they also include financial markets. Countries with integrated capital markets can attract international investors, diversify funding sources, and lower the cost of capital.
Access to global capital allows governments and firms to finance large-scale infrastructure projects, research and development, and business expansion. Moreover, global financial integration promotes transparency, efficiency, and the adoption of international best practices in governance and regulation, further supporting sustainable growth.
8. Strengthening Macroeconomic Resilience
Global market participation helps economies become more resilient to domestic economic shocks. By having access to multiple trade partners, diversified investment sources, and integrated financial networks, countries can buffer themselves against downturns in any single market.
For example, during global recessions, countries with strong trade and investment links may still maintain growth by leveraging alternative markets or attracting counter-cyclical investment. In contrast, economies isolated from global markets often face deeper and longer recessions due to a lack of external support.
9. Driving Policy Reforms and Institutional Development
Engagement with global markets often necessitates reforms in policy, regulation, and institutions. To attract investment and participate effectively in international trade, countries adopt policies that improve transparency, ease of doing business, property rights, and financial regulation.
These reforms, spurred by global market participation, create a more conducive environment for growth. For instance, reforms in trade policies, taxation, and investment protection in countries like India and Vietnam have been directly linked to their successful integration into global markets and sustained economic growth.
10. Promoting Sustainable and Inclusive Growth
Finally, global markets have the potential to promote more sustainable and inclusive growth. Trade and investment can encourage the adoption of environmentally friendly technologies, higher labor standards, and corporate social responsibility practices.
International engagement also provides opportunities for developing economies to integrate into high-value supply chains, generating employment and reducing poverty. While globalization has its challenges, responsible participation in global markets can align economic growth with social and environmental objectives, contributing to broader development goals.
Conclusion
Global markets matter for growth because they provide access to larger consumer bases, attract foreign investment, stimulate competition and productivity, facilitate technology transfer, and enhance employment and human capital development. They also promote diversification, strengthen financial markets, and drive institutional reforms, contributing to more resilient, sustainable, and inclusive economic growth.
In an interconnected world, the countries that engage effectively with global markets are better positioned to harness resources, innovation, and opportunities that drive long-term prosperity. Conversely, isolation from global markets can limit growth potential, reduce efficiency, and slow the pace of modernization. For policymakers, businesses, and investors, understanding the dynamics of global markets is crucial for crafting strategies that leverage international opportunities while managing risks.

Hidden Gem QRL - 1000X/30.000XQRL is an old guy from 2018 with 2 external audits.
It's the first and only Quantum Resistance crypto out there, do your own reasearch.
It implements XMSS quantum safe algo.
I've been studying this for years and I didn't find flaws, since I don't like to be scammed, glad if you find something I overlooked.
Narrative: Quantum supremacy is speeding up in exponentials, with nations and privates pouring billions in research, and in 3/5 years it will break ALL crypto security based on ECDSA.
BTC and ETH will have extreme difficulties in migrating to quantum safe protocols.
Don't believe what the masses are saying, banks are already working on quantum safety and PQ internet protocols are on exponential adoption , but I doubt BTC and ETH will make it in time.
This is why I bought a small insurance bag of QRL.
This will soon implement POS and EVM with SPHINX+ algo, recommended by NIST.

Alaska Airlines | ALK | Long at $49.77If the numbers (not the "economic downturn" reports on the news) are true, more and more people...year over year... are actually flying: www.tsa.gov
In 2024, Alaska Airlines NYSE:ALK carried 36 million paying passengers, an increase from 35 million in 2023. The airline group reported 648 million available seat miles for the 12 months ending December 2023, and a 35% year-over-year increase in paying passenger miles for the fourth quarter of 2024. As of 2024, NYSE:ALK is the fifth-largest airline in North America by scheduled passengers carried .
Technical Analysis
NYSE:ALK entered the channel of my selected historical simple moving average ("regression to the mean"). Given the existing upward momentum and growth prospects, it's "likely" going to continue moving up after consolidating in the channel. However, dropping to the bottom of the channel (low $40's) is a possibility. As long as the fundamentals and outlook remain promising for the company, I suspect low oil and dropping interest rates will finally send airlines stock prices up.
Revenue and Earnings Growth into 2028
Continued growth after 2025: www.tradingview.com
Insiders
Warning: A LOT of selling and no buying.
openinsider.com
Action
The projected growth of NYSE:ALK makes sense as more people are flying. The great wealth transfer is putting money in the hands of the middle class... but the next few years may be the last run as we merge into a two-class system. So, while the stock may dip in 2025 as the economy slows (in certain segments), rising passenger numbers, lower oil, and dropping interest rates are likely to reward airlines. Thus, at $49.77, NYSE:ALK is a personal buy zone with near-term risk to the low $40's.
Targets into 2028
$68.00 (+36.6%)
$79.00 (+58.7%)

DraftKings | DKNG | Long at $34.36Technical Analysis
DraftKings NASDAQ:DKNG entered the bottom channel of my selected historical simple moving average ("regression to the mean"). Given the existing upward momentum and growth prospects, it's "likely" going to close the highest open price gap on the daily chart at $59.12.
Revenue and Earnings Growth into 2028
Doubling of revenue projected by 2028 ($9.92 billion) compared to 2024 ($4.77 billion)
371.4% projected earnings increase from 2024 (-$1.05) to 2028 ($2.85)
www.tradingview.com
Health
Debt-to-Equity: 1.9x (medium-level risk)
Altman's Z-Score/Bankruptcy Risk: 2.8 (very low risk, but over 3 is best)
Insiders
Warning: A LOT of selling and no buying.
openinsider.com
Action
The projected growth of NASDAQ:DKNG makes sense as more people entering the risky gambling world. While economic downturns are not favorable for vacation gambling destinations, they are favorable for online betting as consumers seek "viable" economic options... it's a dirty game we are all playing as traders here. While there is risk of the price gaps down to $15-$16 getting closed during a real crash, I just don't think the market is there... yet. Insiders selling and the competitive landscape are red flags, but from the technical analysis to the fundamentals, this looks like a promising growth stock. Thus, at $34.36, NASDAQ:DKNG is a personal buy zone with near-term risk between $28-$30.
Targets into 2028
$47.00 (+36.8%)
$58.00 (+68.8%)

Taurus Acquisition:24/7 Customer Support for Client SatisfactionTaurus Acquisition is a financial services company recognized for its consistent, client-centered approach. One of the most appreciated aspects of the platform — frequently mentioned in Taurus Acquisition reviews — is its 24/7 customer support, designed to ensure that every trader and investor can receive timely help regardless of location or time zone.
In today’s global market, accessibility isn’t just a feature — it’s a necessity. Traders operate around the clock, and financial platforms must be equally responsive. Taurus Acquisition has addressed this challenge by providing continuous customer assistance, ensuring that every inquiry or issue is resolved without unnecessary delay.
Why 24/7 Support Matters
Modern investors expect more than automated responses or limited-hour service. They want real communication and reliable feedback when managing funds or executing trades.
That’s why Taurus Acquisition made the decision to implement full-day support — to give clients direct access to human assistance anytime.
This approach is often highlighted in Taurus Acquisition reviews, where users note the speed, politeness, and clarity of communication from the support team. Many mention that even late-night or early-morning issues are handled with professionalism and urgency, something still rare in the financial services space.
Building Trust Through Responsiveness
Client satisfaction in trading and finance depends heavily on transparency, reliability, and communication.
When traders know they can contact a live support team 24/7, it enhances their confidence and reduces stress during market volatility. Users repeatedly point out that Taurus Acquisition’s constant availability helps them act decisively, especially in time-sensitive trading situations.
Consistency is another key factor. Reviews often emphasize that responses are not only fast but also informative and solution-oriented — helping clients fully understand their options rather than receiving generic answers.
What Clients Are Saying
Across multiple Taurus Acquisition reviews, traders highlight:
Prompt responses via chat and email, even outside typical business hours.
Professional and respectful communication.
Clear explanations of platform updates and trading functions.
Real assistance during account setup, verification, or withdrawal steps.
For many users, this round-the-clock service isn’t just convenient — it’s what sets Taurus Acquisition apart from other brokers. In an environment where reliability equals security, continuous support becomes a sign of a legit and trustworthy broker.
Commitment to Client Satisfaction
Taurus Acquisition positions its customer service not as an add-on, but as a core part of its operational philosophy. The company’s mission is to provide an experience where traders feel informed, supported, and in control at all times.
By maintaining open communication channels day and night, Taurus Acquisition reinforces its reputation as a reliable platform that values its users’ time and trust.
In the competitive world of finance, 24/7 support is no longer optional — it’s a standard of professionalism that the company proudly upholds.
About Taurus Acquisition
Taurus Acquisition Ltd.
22 Bishopsgate, London, England, EC2N 4BQ
Company Number: 07705676
Taurus Acquisition is a financial services platform focused on delivering accessible, transparent, and responsive solutions for modern investors. With continuous support, flexible account options, and a commitment to long-term client relationships, the company aims to make trading more confident, efficient, and secure for users worldwide.
