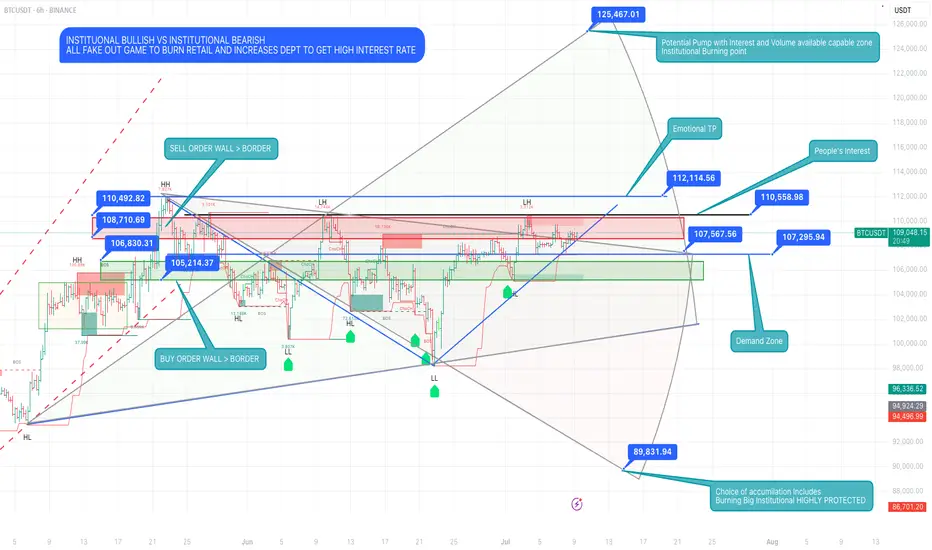
The Whale’s Blueprint: Read It Before It Happens🧠 The Real Game
Institutional Bullish vs Institutional Bearish — It Was Never About Direction.
This chart isn’t about setups.
It’s a blueprint of manipulation, a battlefield map where:
• Retail gets trapped at emotional highs
• Liquidity gets swept in layers
• Institutions reload in silence
• And the price becomes the puppet, not the player
🔺 Top Red Zones (106K–112K):
These aren’t resistance. They’re execution zones for sell walls, fake breakouts, and late long liquidations.
🔻 Green Demand Zones (105K & Below):
Not support. They’re reaction chambers — where whales absorb panic and retail exits in fear.
💥 125K is not a fantasy. It’s a controlled explosion waiting to happen —
But only if the trap is set right and the fuel (volume + interest) loads in.
🧱 Real accumulation doesn’t happen in comfort.
It happens in the shadows, at the edges of fear.
This isn’t price action.
This is power action.
⸻
“Most trade the surface.
Snipers wait beneath it…
and strike before the story reveals itself.”
#BTCUSDT #LiquidityGame #WhaleTrap #InstitutionalZones #SniperMindset #KaizenMethod #TheRealGame
Growth
JD.cm | JD | Long at $33.16Like Amazon NASDAQ:AMZN and Alibaba NYSE:BABA , I suspect AI and robotics will enhance JD.com's NASDAQ:JD automation in warehousing, delivery, and retail. There is some risk here, like other Chinese stocks, that they could be delisted from the US market if trade/war tensions rise. But I just don't think that is likely (no matter the threats) due to the importance of worldwide trade and investment. I could be way wrong, though...
NASDAQ:JD has a current P/E of 8.1x and a forward P/E of 1.2x, which indicates strong earnings growth ahead. The company is healthy, with a debt-to-equity of 0.4x, Altmans Z Score of 2.6, and a Quick Ratio of .9 (could be better).
From a technical analysis perspective, the historical simple moving average (SMA) band is still in an overall downtrend but starting to level out (accumulation of share area). It is possible, however, that the price may drop into the $20s to close out the existing price gaps on the daily chart as tariff threats arise. But that area is another personal entry zone if fundamentals hold.
Thus, while it could be a bumpy ride and the risk is there for delisting, NASDAQ:JD is in a personal buy zone at $33.16 (with known risk of drop to the $20s in the near-term).
Targets into 2028:
$44.00 (+32.7%)
$52.00 (+56.8%)

Alibaba | BABA | Long at $108.84Like Amazon, I suspect AI and robotics will enhance Alibaba's NYSE:BABA e-commerce, logistics, and cloud computing operations. There is some risk here, like other Chinese stocks, that they could be delisted from the US market if trade/war tensions rise. But I just don't think that is likely (no matter the threats) due to the importance of worldwide trade and investment. I could be way wrong, though...
NYSE:BABA has a current P/E of 14.2x and a forward P/E of 2x, which indicates strong earnings growth ahead. The company is very healthy, with a debt-to-equity of 0.2x, Altmans Z Score of 3.3, and a Quick Ratio of 1.5. If this were a US stock, investors would have piled in long ago at the current price.
From a technical analysis perspective, the historical simple moving average (SMA) band has started to reverse trend (now upward), indicating a high potential for continued (overall) price movement up. It is possible, however, that the price may reenter the SMA band in the near-term - the $80s aren't out of the question - as tariff threats arise. But that area is another personal entry zone if fundamentals hold.
Thus, while it could be a bumpy ride and the risk is there for delisting, NYSE:BABA is in a personal buy zone at $108.84 (with known risk of drop to the $80s in the near-term).
Targets into 2028:
$125.00 (+14.8%)
$160.00 (+47.0%)

$30 easy by 2026I'm holding the 1/16/26 25C those are the highest and furthest out options you can get on hood. Bought at 1.55 on 7/2 now worth 3.30 good entries if eth pulls back would be 12 and 10 best case. I see this running quick I will sell atleast half at 30. They hold and are staking over 500M worth of eth largest amount for any publicly traded company, yeild will be great for them but they are obviously selling shares to purchase eth so there's plenty of risk company only has 5 employees according to hood still under 1B last time I checked. 50ma is around 16 should be a clear path to 30 maybe psychological resistance at 20.
Bitcoin, Missiles & Macro Risk | IRAN vs IsraelThe goal is an endless war, not a successful war - Julian Assange
Asia woke up to a wave of geopolitical and digital disruption, Yesterday, Israel declared war on Iran and reportedly terrorized top Iranian scientists, generals and their families during the night. Meanwhile, U.S. media continues to label IRGC leaders as terrorists despite the fact that these same individuals were instrumental in the fight against ISIS (if you remember, even Trump once said that ISIS was created by Obama and the U.S. to control the Middle East which is right fact)
The only country to ever use nuclear bombs killing in Hiroshima and Nagasaki is now pushing for another war, accusing Iran of having a non peaceful nuclear program! on the other hand,the country has committed a genocide in the recent Gaza war (just check some of Julian Assange’s posts on WikiLeaks) want to bring more peace to the world by start a new war!
Netanyahu started the war with Iran and then fled to Greece like a classic politician, while Trump is trying to act like a peacemaker despite helping ignite the conflict in the first place!
Sirens and explosions were heard over Jerusalem eight hours ago as Iran launched a fresh wave of missiles on Israel
S&P 500 futures broke back below the critical 5980 level, while crypto sold off in tandem. Bitcoin dropped 5%, with Ethereum taking a sharper ~9% hit. Volatility spiked, especially on the short end, as traders scrambled for gamma exposure ahead of the upcoming FOMC meeting.
BTC risk reversals flipped decisively bearish front-end puts are now trading as much as 5 vols over calls, highlighting aggressive demand for downside protection. Meanwhile, WTI crude jumped as much as 11% intraday, as markets priced in potential disruptions to Iranian oil exports. A prolonged conflict could constrain global supply, amplify inflation pressures, and complicate the Fed’s rate path.
Tensions have returned to levels not seen since April. Markets are stuck in limbo on edge for further escalation or sudden diplomatic cooling.
Adding to the macro strain, a major internet outage hammered U.S. tech stocks. Cloudflare and Google Cloud disruptions took down key platforms like Spotify, Snap, Discord, and even some Google services. The event renewed concerns around the vulnerability of centralized infrastructure and worsened late-session equity declines.
This tech-driven selloff aligned with a surge in crypto open interest setting off over $1 billion in long liquidations. Yet Bitcoin held up relatively well, reflecting ongoing institutional support.
Backing that narrative, DeFi Development Corp announced a $ 5B equity line to accumulate Solana CRYPTOCAP:SOL ) for its treasury a strong signal of conviction in core crypto assets amid the broader unwind.
BTC looks strong so far and many hedge funds and even BlackRock loading the dips but if you are a future trader then be very careful about the recent geopolitical tension . btc can back to 103k and 102k levels

CRCL & USDC| Circle Just Lit Up Wall StreetAll this hype... over a company behind a $1 coin ?
Circle just pulled off one of the biggest IPO wins of the year , shares nearly tripled on debut
Welcome to the world of stablecoins crypto’s least flashy but most essential sector
Unlike speculative tokens chasing the next moonshot, stablecoins like USDC are built to not move. They’re engineered to stick at $1, no matter what. And yet, they’ve quietly moved trillions in value, underpinned the DeFi ecosystem, enabled fast global payments, and now sit at the center of U.S. regulatory plans for digital finance.
So what is a stablecoin, really? And why is Circle suddenly Wall Street’s favorite crypto firm?
While Bitcoin whipsaws through double digit swings, stablecoins are designed for one thing:
stability . One USDC equals one US dollar! Period. That’s backed by real reserves dollars or short-term Treasuries. You deposit a dollar, Circle mints a USDC. You redeem it, they burn the token and return your cash, Simple? Yes. But with major upside:
🌍 Global access: Anyone online can hold a dollar-equivalent without a U.S. bank.
⚡ Always on transfers: No delays, no bank hours—instant settlement, 24/7.
🔁 Programmable payments: Developers can move value like data—automated, fast, and borderless.
Think of it as the dollar upgraded for the internet age!
No surprise fintechs, payment rails, and crypto protocols are scrambling to integrate stablecoins. Circle runs USDC the second largest stablecoin globally with ~$61 billion in circulation. Only Tether (USDT) is bigger, with over $ 155 billion.
Now, with a massive IPO and public market momentum, Circle isn’t just a crypto story it’s a finance one.
Circle Isn’t Playing Tether’s Game, It’s Playing Wall Street’s
Tether may lead the stablecoin space by volume, but Circle is making a different play: credibility
While Tether has long drawn scrutiny over opaque reserves and offshore operations—now headquartered in El Salvador , Circle has positioned itself as the clean, compliant alternative. U.S regulated, audit friendly, and institution first
Circle doesn’t want to be the biggest.
It wants to be the most trusted especially by regulators, enterprises, and fintechs building on crypto infrastructure. So What Does Circle Actually Do? It issues and redeems USDC
Users send $1, get 1 USDC. Send it back, get $1. Fully backed, no games, no algorithms just a straightforward peg
Safeguards the reserves
Circle holds the backing funds in cash and short-term U.S. Treasuries—managed in part by BlackRock. Reserves are publicly attested each month, offering far more transparency than Tether.
Earns yield
Here’s the real business model: Circle earns interest on the dollars it holds. With high rates in 2023, that added up to hundreds of millions in revenue—most of it from Treasury returns.
Builds infrastructure
Beyond issuing coins, Circle is quietly becoming the foundation for crypto finance. It provides APIs for wallets, powers fintech platforms, and integrates with major players like Visa, Stripe, and Coinbase.
Think of it less like PayPal, and more like the plumbing that PayPal could eventually run on.
The Model Is Simple and Profitable . Circle doesn’t need to charge transaction fees or run a flashy exchange. It earns by holding tens of billions in reserves and collecting the interest. In FY2024, $1.7 billion of its revenue came from just that. Everything else platform fees, API access was minor in comparison.
Circle is betting that in the next phase of digital finance, trust is the real currency.
The Surprise? Circle’s Actually Profitable
Circle didn’t just rake in revenue—it made real money. The company posted $167 million in operating income for FY24, translating to a clean 9% margin. That’s after paying out over $1 billion in partner fees, with the bulk going to Coinbase, which takes a 50% cut of net USDC revenue.
Despite those hefty payouts, Circle is firmly in the black. But here’s what’s critical to understand: most of the assets backing USDC aren’t on Circle’s books.
They’re held off balance sheet in the Circle Reserve Fund, managed by BlackRock
The fund is legally distinct and custodied by BNY Mellon.
It holds U.S. Treasuries and cash to back every USDC in circulation.
But these reserves don’t count as Circle’s corporate assets they’re held in trust for USDC holders. As a result, even though Circle controls more than $50 billion in reserve assets, those don’t appear on its balance sheet in the traditional sense. You’ll find them in footnotes, attestations, and disclosures ,not in line-item equity or cash.
This structure gives Circle both regulatory clarity and balance sheet flexibility while ensuring that users’ dollars are safely ring-fenced.

LITECOIN (LTC) - On The Verge Of Exploding - ETF Catalyst?Litecoin: A Decentralized Network with a Differentiated Risk Profile
Litecoin (LTC), launched in 2011 by former Google engineer Charlie Lee, is one of the oldest and most active Layer-1 blockchain networks in the cryptocurrency space. Often referred to as the “digital silver” to Bitcoin’s “digital gold,” Litecoin was designed to offer faster transactions, lower fees, and broader accessibility while maintaining a similar monetary policy and codebase.
This post aims to provide an overview of Litecoin’s technical structure, usage, risk profile, and current developments—without speculative bias—so readers can form their own assessments.
1. Transparent Origins and Founder Dynamics
One key difference between Litecoin and Bitcoin lies in the identity of their respective creators. Bitcoin was developed by Satoshi Nakamoto, a pseudonymous and still-unknown individual or group, who is estimated to hold 750,000 to 1.1 million BTC—a significant portion of the total supply that has never moved. The dormant status of these holdings has occasionally raised concerns about future market impact if they were ever activated.
In contrast, Litecoin was founded by Charlie Lee, a known and public figure who was active in the community before, during, and after the launch. In 2017, Lee announced he had sold or donated nearly all his LTC holdings to avoid any potential conflict of interest. Today, no founder or insider is known to hold a disproportionate share of the Litecoin supply. This level of transparency and decentralization has been interpreted by some as a factor that lowers long-term governance and concentration risk.
2. Structural Simplicity and Leverage Exposure
Another distinction between Litecoin and Bitcoin lies in market structure and exposure to leverage.
Bitcoin is widely used as collateral in crypto lending markets and institutional derivatives, including perpetual futures and structured products. This has introduced significant systemic risk during periods of market stress, as high leverage has historically led to cascading liquidations across centralized and decentralized platforms.
Litecoin, in contrast, has relatively limited exposure to leveraged products and collateralized lending. It is not commonly used as collateral in CeFi or DeFi protocols, and institutional futures markets for LTC are smaller and less active. As a result:
Litecoin is less likely to trigger or be affected by mass liquidations
It has reduced systemic risk due to lower market entanglement
Its price tends to reflect more organic supply/demand dynamics
It is less involved in cross-collateralized or rehypothecated loan systems
This simpler structure may appeal to risk-aware investors looking for cleaner exposure without the reflexivity effects common in heavily leveraged markets.
3. Scarcity and Monetary Policy
Litecoin shares a similar deflationary model with Bitcoin, with a hard cap of 84 million LTC and scheduled halving events every four years. The most recent halving occurred in August 2023, reducing the block reward from 12.5 to 6.25 LTC per block.
With over 75 million LTC already mined, fewer than 9 million remain in future issuance. The protocol’s monetary policy is deterministic and cannot be altered unilaterally, which may appeal to those who prioritize predictable supply and inflation resistance.
While Litecoin’s cap is four times higher than Bitcoin’s, the relative issuance schedule and halving dynamics mirror Bitcoin’s design. Some investors view this as a hedge against fiat currency debasement, although the asset's volatility and adoption context should be taken into account.
4. Network Fundamentals and Real-World Use
Litecoin has maintained near 100% uptime since inception, and its transaction throughput and fee structure are generally favorable compared to many competing networks.
In 2024, Litecoin became the most used crypto for payments via BitPay, surpassing Bitcoin in transaction volume, driven by its fast 2.5-minute block times and low transaction fees. It is supported by major platforms including PayPal, and accepted by thousands of online and retail merchants.
From a security perspective, Litecoin’s hashrate reached all-time highs in 2025, partly due to merge-mining with Dogecoin, which has helped strengthen its proof-of-work infrastructure. Network upgrades like MWEB (MimbleWimble Extension Blocks) have added optional privacy layers to Litecoin’s UTXO model, while Lightning Network integration supports instant payments.
These developments suggest that Litecoin continues to evolve, with emphasis on efficiency, user privacy, and practical usability.
5. Institutional Presence and ETF Outlook
Litecoin has seen modest but growing institutional involvement. Products such as the Grayscale Litecoin Trust (LTCN) have existed for several years, and Coinbase introduced Litecoin futures trading in 2024. Fidelity also offers LTC trading and custody to institutional clients.
More notably, a Spot Litecoin ETF application is currently under review by the U.S. Securities and Exchange Commission (SEC), with analysts from Bloomberg estimating a 95% probability of approval before the end of 2025. If approved, this would make Litecoin one of the first proof-of-work assets outside of Bitcoin to gain direct exposure through a regulated ETF vehicle.
Should that happen, it may increase access, liquidity, and legitimacy among traditional investors. However, as always, regulatory decisions remain uncertain and subject to broader political and market conditions.
6. Technical Structure and Long-Term Price Action
From a macro-technical perspective, Litecoin has historically followed a pattern of higher lows and higher highs across each market cycle. This structure remains intact as of 2025, with a strong support at 81 USD on a 6 months timeframe.
Summary
Litecoin presents a combination of characteristics that differentiate it from other crypto assets, including:
✅ A public, transparent founder and no major insider dominance
✅ Limited exposure to leveraged lending, reducing systemic risk
✅ Deterministic monetary policy with a fixed supply and halving schedule
✅ Real-world usage in payments and retail adoption
✅ Strong network security and development activity
✅ Potential ETF approval that may broaden accessibility
These features do not necessarily imply outperformance, but they form the basis for an asset with a relatively clean structure, historical resilience, and a distinct position in the crypto ecosystem.
🔎 Disclaimer:
The information presented here is for educational and informational purposes only and should not be interpreted as financial advice.
Always conduct your own research, assess your individual risk profile, and make investment decisions based on your own analysis and objectives.

Give me 3 reasons not to be bullish on SolanaSolana’s Total Value Locked (TVL) expanded from $396M on Dec 26, 2022 to $8.69B by July 4, 2025, a 2,094% increase (~22x growth) across 80 weeks . This translates to a weekly geometric growth multiplier of ~1.089, or an 8.9% compound weekly rate .
This rapid TVL expansion reflects capital inflows, increased DeFi participation, and regained trust in Solana’s infrastructure following the FTX collapse.
————————————————
LST Ecosystem Expansion :
Liquid staking derivatives (JitoSOL, mSOL) accounted for a significant share of inflows, as yield-seeking capital returned with Ethereum-style primitives on Solana.
MEV Monetization & Compression Tech :
Validator-side MEV solutions and data compression (via Firedancer and ZK-state) improved scalability and trust in Solana’s low-latency environment.
Resurgence of DeFi-NFT Hybrids :
Protocols like Tensor and HadeSwap blurred lines between DeFi and NFTs, generating sticky liquidity and reinforcing Solana’s unique narrative.
Restored Institutional Confidence :
Post-FTX reforms and a more diversified validator ecosystem helped re-attract institutional capital, supported by enhanced wallet infra (e.g., Backpack, Phantom) and custodianship.
This pattern, paired with the geometric growth trend, suggests Solana’s DeFi ecosystem is entering a new structural bull phase, underpinned by both technical confirmation and fundamental evolution.
Anyways, let me know in the comments 3 reasons not to be bullish on Solana as we speak.
(PS: QC-resistant issues don’t apply only for Solana but for all major crypto assets!)

NewtekOne | NEWT | Long at $10.92NewtekOne NASDAQ:NEWT is a financial holding company providing business and financial solutions to small- and medium-sized businesses across the U.S. Services include Newtek Bank, business lending, SBA loans, electronic payment processing, payroll and benefits, insurance, and technology solutions. While the stock has taken a major hit recently, insiders have scooped up over $1 million in shares with an average price of $11.70. Currently trading at a P/E of 5.6x, forward P/E of 6.6x, and near book value, the stock may be poised for a move up soon with the anticipation of interest rates dropping. Revenue is up 24.93% from $271.15M (2023) to $338.73M (2024) and earnings are forecast to grow 11.63% per year, but the company does have a high debt-to-equity ratio (over 5x).
Tariffs could indirectly impact NASDAQ:NEWT by increasing costs for its small- and medium-sized business clients, particularly in industries reliant on imports (e.g., manufacturing, retail). Higher costs may reduce client profitability, increasing loan default risks or reducing demand for Newtek’s lending and payment processing services. But an interest rate reversal may greatly limit the impact (longer-term).
So, at $10.92, NASDAQ:NEWT is in a personal buy zone.
Targets into 2027:
$12.00 (+9.9%)
$14.00 (+28.2%)

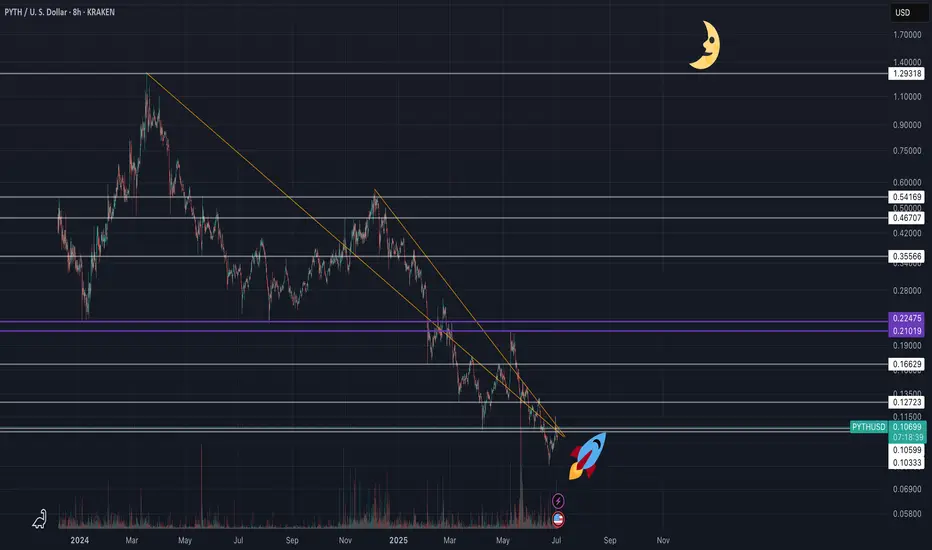
PYTH NETWORK (PYTHUSD) - (10X - 50X Potential)Pyth Network is an oracle protocol originally built for Solana, optimized for ultra-low latency and first-party data directly from exchanges and market makers. Unlike Chainlink’s node-aggregator model, Pyth enables real-time price feeds (as fast as 400ms) sourced directly from over 100 institutional providers, including Binance and Cboe.
🧩 Why Pyth?
DeFi apps need fast, accurate pricing to avoid exploits and ensure fair trading. Pyth delivers high-frequency, high-integrity data, especially valuable for derivatives, perpetuals, and high-speed DeFi protocols.
🌐 Massive Expansion
What started on Solana now powers 100+ blockchains, including Ethereum L2s, Cosmos, Sui, Aptos, TON, and more. As of 2025, over 420 protocols integrate Pyth, with over $48B+ monthly trading volume secured. It has become the #2 oracle in DeFi by usage, dominating ecosystems like Solana, Sui, and Injective.
📊 Tokenomics & Unlocks
Max supply: 10B PYTH
Circulating: ~5.75B (mid-2025)
Next major unlock: May 2026 (~2.1B tokens)
Utility: Governance, staking, publisher rewards, and oracle integrity
Pyth’s decentralized governance is growing, with a DAO now guiding key protocol parameters. It’s also expanding beyond price feeds, launching products like randomness (Entropy) and MEV mitigation tools (Express Relay).
Disclaimer: This is not financial advice. Always do your own research before making investment decisions.
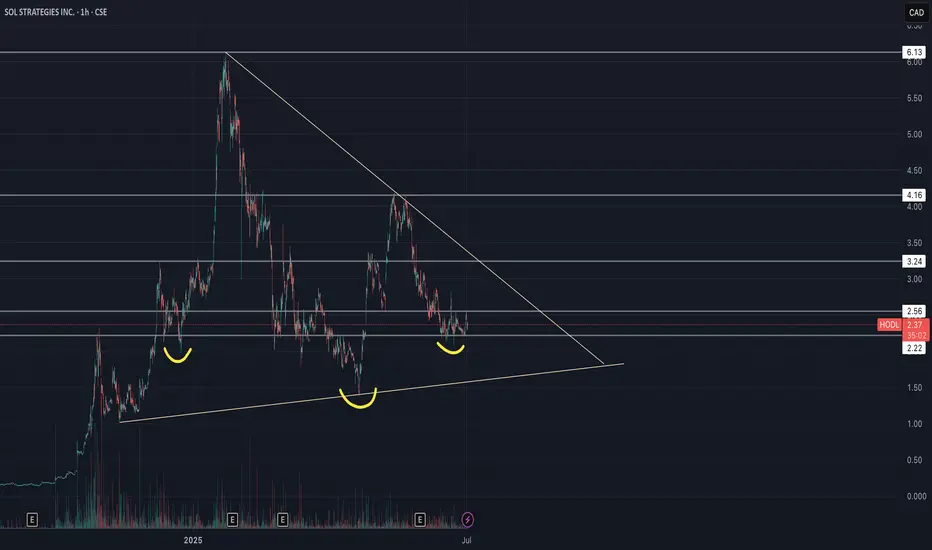
Sol Strategies Inc (HODL) - Inverse H&S🚀 SOL Strategies (HODL) – Public Market Gateway to Solana Yield
SOL Strategies (CSE: HODL) is a publicly traded company laser-focused on the Solana ecosystem. With nearly 395,000 SOL held (most of it staked) and over 3.7 million SOL delegated to their validators, they generate consistent income through staking rewards and validator commissions.
Their business model is simple:
📌 Accumulate SOL → Stake it → Run institutional-grade validators → Earn yield
📌 Expand through partnerships (3iQ, Neptune, BitGo, Pudgy Penguins)
📌 Hold strategic Solana ecosystem tokens like JTO and jitoSOL
📌 Operate with SOC 2-certified infrastructure and pursue a Nasdaq listing
SOL Strategies is not just holding crypto – they are building core infrastructure for Solana, giving equity investors direct exposure to staking economics in one of the fastest-growing blockchain networks.
📊 For traders: HODL stock offers a pure-play vehicle for Solana exposure, with an income-generating twist.
⚠️ Always do your own investment research and make your own decisions before investing.
MUSK on TRUMP's Bill | "outrageous, disgusting abomination"Elon Musk’s sided against the latest Trump-backed tax-and-spending package, in a plot twist between the recent partners turned enemies.
Musk called the legislation a “massive, outrageous, pork-filled Congressional spending bill” and a “disgusting abomination,” publicly shaming senators and representatives who backed it.
With such a strong opinion against it one may wonder, is this going to negatively affect Tesla?
Together with this strong reaction, the price has already been trading lower for the past few days.
The administration has defended it as the “One Big Beautiful Bill,” insisting it will stimulate growth, even though Elon Musk warned the bill would swell the U.S. budget deficit by roughly $2.3–2.5 trillion over the next decade, calling the added debt “crushingly unsustainable”.
When I first read this, it made me think of Tesla's long generated “green credits”, which in 2024 alone, brought in roughly $2.76 billion. “green credits” (officially, zero-emission or regulatory credits) work by building more clean vehicles than required and selling the excess allowances to other automakers that need them to comply with emissions mandates.
Now I'm no expert on US policy, and so I roped in GPT to help me explain how this new bill implicates TESLA's profit:
Under the Senate’s “big, beautiful” tax-and-spending bill, Tesla’s regulatory-credit business faces two assaults:
❗ Repeal of CAFE- and ZEV-mandates
The bill would eliminate penalties for automakers missing Corporate Average Fuel Economy targets and roll back zero-emission vehicle mandates that currently force legacy manufacturers to buy credits if they fall short. Remove those penalties and mandates, and there’s no structural need for credits—undercutting the very market that funds Tesla’s $2–3 billion-a-year credit-sales business
❗ End of consumer EV tax incentives
By phasing out the $7,500 new-EV credit (and the $4,000 used-EV credit) within months of enactment, the bill dampens U.S. EV demand overall. A smaller EV market means fewer opportunities for Tesla to leverage fleet-wide ZEV regulations against higher-emitting rivals—further squeezing credit prices and volume
Bottom line: Without CAFE/ZEV obligations and with EV purchase subsidies gone, Tesla’s “green-credit” line—a major profit driver in recent quarters—would likely collapse, removing a key buffer against manufacturing and pricing pressures.
This could be the beginning of a bear market for Tesla lasting throughout the rest of the Trump administration.
________________________
NASDAQ:TSLA

SharpLink Gaming Inc (SBET) - Falling Wedge & Inverse H&S🚀 SharpLink Gaming ( NASDAQ:SBET ) – Ethereum, Joe Lubin & a Bullish Setup
SharpLink Gaming has undergone a bold transformation: the company is now the largest public holder of Ethereum (ETH), with ~198,000 ETH acquired since June 2025. Over 95% of it is staked, already earning 200+ ETH in rewards – turning ETH into a yield-bearing treasury asset.
Driving this shift is Joe Lubin, co-founder of Ethereum and CEO of ConsenSys, who recently became Chairman of SharpLink. Under his leadership, SBET is betting big on Ethereum as “digital capital”, aiming to merge iGaming and Web3.
📊 Technical Setup:
SBET is forming a falling wedge and an inverse head and shoulders – both classic bullish reversal patterns. After a post-announcement retracement, the chart suggests growing potential for a breakout as fundamentals strengthen.
🧠 My thesis: This is MicroStrategy playbook 2.0 – but with ETH instead of BTC. SharpLink gives equity exposure to Ethereum + staking yield + visionary leadership.
🔔 Worth watching closely.
⚠️ Always do your own investment research and make your own decisions before investing.

How I screen for long term investmentsIn this video, I’ll show you the exact stock screener I use to find long-term investment opportunities — the kind of stocks you can buy and hold for years.
I’ll walk you through the key metrics to look for, how to use free tools like TradingView screener, and what red flags to avoid. This strategy is perfect for beginner and experienced investors who want to build long-term wealth, not chase hype.
Whether you're looking for undervalued stocks, consistent compounders, or just trying to build your long-term portfolio, this screener can help.
Hope you enjoy!!

Rockwell Automation | ROK | Long at $268.96Rockwell Automation NYSE:ROK appears to be gaining upward momentum once again. With two price gaps above (highest near $333+) and the historical simple moving average lines showing a positive change, this company could be poised to fill the gaps soon. A strong billion-dollar company with rising revenue, but stay cautious of the slightly high debt, insider selling, and changing economy / tariff implications.
At $268.96, NYSE:ROK is in a personal buy-zone.
Targets:
$300.00
$333.00

KULR | High-Growth Channel Reversal – Targets +298% to +2,368%📍 Ticker: AMEX:KULR (KULR Technology Group, Inc.)
📆 Timeframe: 1W (Weekly)
📉 Price: $7.11
📈 Pattern: Rising parallel channel with bullish consolidation
🔍 Technical Setup:
AMEX:KULR is respecting a clean ascending channel since early 2023 and is currently consolidating just above key support and the lower trendline, forming a launch base.
🔵 Key Resistance: $6.51 has flipped to support
📈 Price bounced from demand zone + holding mid-channel
📊 Volume profile supports accumulation at lows
🧠 Trade Plan & Dynamic Stop:
📥 Entry Zone: $6.80–$7.20
⛔ Trailing Stop: A few % below the lower rising trendline
→ Trail it dynamically as the channel rises (e.g. ~4–7% buffer under trendline)
🎯 Targets & ROIC:
🎯 Target 1: $9.45
→ Return: +31.3%
🎯 Target 2: $28.81
→ Return: +305.1%
🎯 Target 3 (Channel Top): $168.12
→ Return: +2,268%
⚠️ Key Technical Notes:
Bullish retest of major breakout zone ($6.50) is holding
Trendline structure is strong → perfect for trend-following strategy
Trailing stop method protects gains without prematurely exiting
Momentum expected to increase above $9.00
💬 Is KULR about to explode higher with the next growth leg?
Watch for confirmation above $9.50 for breakout acceleration.
#KULR #ChannelBreakout #SmallCapTech #ExplosiveSetup #TrendTrading #TargetTraders

Parcl - PRCL-USD - 30 Million Market Cap (100x Potential)www.tradingview.com
CHATGPT Research Summary:
Parcl: Unlocking Real Estate Exposure on the Blockchain
Introduction:Parcl is a groundbreaking decentralized platform that enables traders and investors to speculate on real estate market price movements much like they trade crypto or equities. By combining real-time housing data with blockchain technology, Parcl offers around-the-clock, borderless, and highly liquid exposure to global residential real estate markets. In this comprehensive blog post, we’ll explore what Parcl is, how it works, what it means to own the EGX:PRCL token, the unique opportunities it provides for investors (including AI-driven strategies), its core strengths, and the risks and challenges it faces. The tone is professional, investment-focused, and designed for the TradingView audience.
What is Parcl and How Does It Work?
Parcl allows users to trade real estate price indices for global cities without ever owning or transacting physical property. Each index represents the aggregated median price per square foot/meter for residential properties in a specific city. Users can go long or short on these indices using perpetual contracts with up to 10x leverage, entirely on-chain and settled in USDC.
Built on Solana, Parcl leverages the blockchain's high speed and low fees to offer a seamless and cost-efficient trading experience. Users only need a Solana-compatible wallet (e.g., Phantom) to deposit USDC, select a city index, and place a trade. There are no barriers such as down payments, brokers, or escrow delays — just rapid, decentralized access to global housing markets.
Data integrity is ensured through Parcl Labs, which aggregates millions of housing data points daily to generate real-time city indices. These feeds are streamed on-chain via oracles like Pyth Network, ensuring transparency and reliability.
What Does It Mean to Own EGX:PRCL ?
The EGX:PRCL token is the governance and utility token of the Parcl ecosystem. Holders of PRCL can:
Participate in protocol governance by voting on changes to platform parameters, fee structures, and market expansions.
Access premium real estate data and analytics through Parcl Labs.
Receive airdrops, rewards, or staking incentives as part of community growth and loyalty initiatives.
While PRCL doesn’t currently offer revenue sharing, it grants holders influence over protocol decisions and potential future economic alignment as the ecosystem matures.
A New Asset Class for Investors and AI Agents
Parcl opens up a completely new asset class: blockchain-native, synthetic real estate exposure. This has major implications:
For retail investors, it democratizes access to real estate, which was previously limited by geography, capital requirements, and illiquidity.
For sophisticated traders, it enables granular bets (e.g., short New York, long Miami) and high-frequency strategies previously impossible in traditional real estate.
For AI agents and algorithmic investors, Parcl provides composable, on-chain access to a diversified asset class that can be rebalanced and traded programmatically.
In short, Parcl makes real estate a liquid, programmable, and globally accessible financial primitive.
Core Strengths: Why Parcl Stands Out
Solana-native speed & cost-efficiency: Enables fast execution and micro-investments ($1+), ideal for retail users and automated agents.
Unique data infrastructure: Parcl Labs’ real-time indices provide unparalleled accuracy and granularity.
Sophisticated perpetual AMM model: Handles liquidity and market balancing with dynamic funding rates and cross-margining.
Growing community and product-market fit: With 80,000+ users and over $1.3B in cumulative volume, Parcl is becoming the most liquid real estate trading venue in the world.
Risks and Threats to Consider
Regulatory uncertainty: Synthetic real estate products may eventually face classification as securities or derivatives in some jurisdictions.
Liquidity dependencies: The AMM model depends on sufficient USDC liquidity pools; low liquidity could cause slippage or insolvency risk.
Smart contract vulnerabilities: As with all DeFi platforms, there is non-zero risk of exploits or oracle manipulation.
Platform dependency: Parcl is tightly coupled to Solana — if the chain experiences downtime or congestion, the protocol may be impacted.
Investors should also be aware of token unlocks and potential dilution from early backers and treasury allocations.
Future Outlook and 100x Potential
With a current market cap near $30 million, Parcl represents a high-upside, early-stage bet on tokenized real estate. If the project gains traction and achieves broader adoption, it’s feasible to imagine a future market cap of $2.5 to $3 billion, representing a 100x potential from current levels.
Factors that could drive this include:
Expansion to more global cities
Increased PRCL utility and staking incentives
Growing demand for real-world assets (RWAs) on-chain
Enhanced support for automated and AI-driven strategies
Final Thoughts
Parcl is redefining what it means to invest in real estate. By transforming local, illiquid property markets into a global, composable, and liquid asset class, Parcl enables both human and AI investors to access and trade the housing market like never before.
Whether you’re a trader looking for uncorrelated exposure, a long-term investor seeking innovation, or a technologist building AI agents — Parcl offers a compelling opportunity.
⚠️ Disclaimer: This is not financial advice. Always do your own research and make investment decisions based on your individual risk profile.

OKLO — when nuclear momentum breaks resistanceSince late 2024, OKLO had been consolidating inside a clear rectangle between $17 and $59. The breakout from this long-term range triggered a new bullish impulse. The price has since returned to retest the breakout zone, now aligned with the 0.618 Fibonacci retracement at $51.94. The retest has completed, and the price is bouncing upward, confirming buyer interest.
Technically, the trend remains firmly bullish. The price closed above the prior range, EMAs are aligned below, and the volume spike during breakout supports genuine demand. The volume profile shows a clean path toward $100, indicating limited resistance ahead. The structure suggests a controlled rally rather than an exhausted move.
Fundamentally, OKLO is a next-generation SMR (Small Modular Reactor) company focused on delivering compact, efficient nuclear power solutions. Following its public debut via SPAC and recent capital injection, OKLO is transitioning from development to implementation. Institutional interest is holding strong, and the broader move toward decarbonization and energy independence places the company in a strategic position.
Target levels:
— First target: $100 — psychological and technical resistance
— Second target: $143 — projected from prior range breakout
OKLO isn’t just another clean energy ticker — it’s a quiet disruptor with nuclear potential. The chart broke out. The volume confirmed. Now it’s time to see if the market follows through.

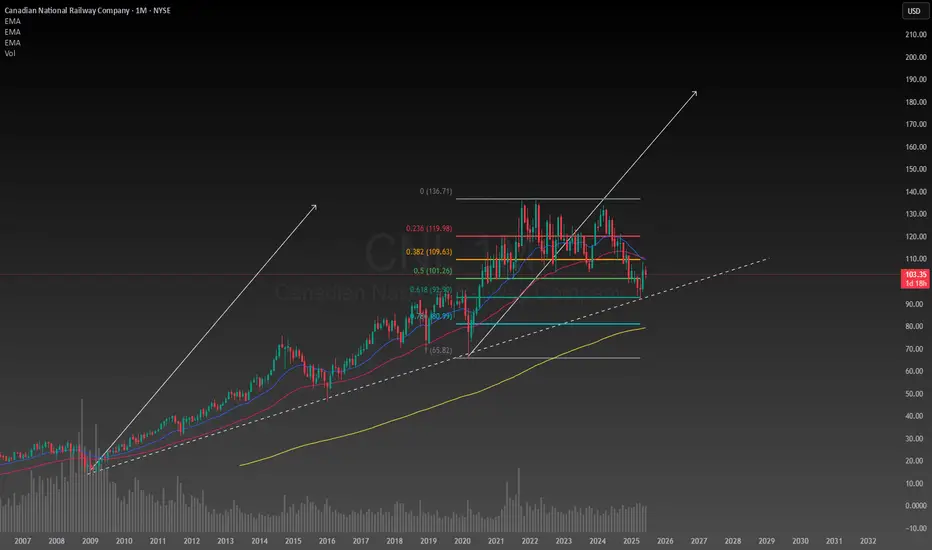
Canadian National Railway has huge upside potentialA decades old trendline still unbroken after months of correction, the Canadian economy seems to be in a great position considering the circumstances. After conducting a simple technical analysis predicting a second leg up the upside potential is enormous if I am right about this. The downside is I am looking at a monthly chart so this will need to be a position trade or long term investment to achieve the desired results. Even if my target is reached I will likely hold onto the stock for years afterwards because the company will continue to make money. The intrinsic value for CNI is between $120 and $225 so it is well below the intrinsic value making any new position on it now at a bargain deal. I will likely be allocating a significant portion of my portfolio to it in the next few days to weeks.
A BNPL Bubble Is Actually Why I'm Bullish, For NowBNPL is growing and inflating at an increasing rate. From concert tickets to burritos, everyone is using buy now pay later. The global market is projected to hit 560 billion dollars in 2025, up from around 492 billion in 2024, and climb to 912 billion by 2030 at a compounding growth rate of 10.2%. Just in the U.S. alone, demand is expected to reach 122 billion next year and scale to 184 billion by the end of the decade. The trajectory is steep, with the structural weaknesses already showing.
Block is positioned at the center of BNPL. In Q1 2025 they reported:
2.29 billion in gross profit, up 9 percent YoY
466 million in adjusted operating income, up 28%
10.3 billion in GMV through Afterpay, with 298 million in BNPL gross profit, up 23% YoY
The stock took a hit. It dropped 9 percent in February and another 21 percent after missing Q1 earnings, but this is seen as typical early bubble behavior. There is short term fear but continuing growth and acceleration. Klarna’s credit losses, IPO delays, and regulatory friction are not problems, they are actually signals that the sector is growing faster than the market, or quite frankly, anyone can control.
BNPL is becoming the default credit system for younger consumers. It is overused and expanding too fast. That is the formula for both upside and implosion. However with that, timing will be everything here, and knowing when to close will be crucial if BNPL can't stabilize.
Baseline expectation: SQ trades in the 80 to 90 range in the short term
Midterm upside: 120 by 2027
Long-term target: 180 to 220 if BNPL stabilizes and Block captures its runway

XAUUSD (Gold) Technical Setup – Smart Recovery from Demand Zone📅 Published: June 26, 2025
📍 Timeframe: 15-Minute
📈 By: MR_MARK0
🔍 Market Context:
Gold recently faced strong selling pressure, dropping sharply from the $3,340 zone and testing the key demand area between $3,314–$3,318, highlighted in green. This zone held as solid support, triggering a bullish reaction with a series of higher lows forming.
Currently, XAUUSD is attempting to reclaim the mid-range zone $3,323–$3,326 (gray), which could act as a pivot for intraday sentiment.
🧠 Trade Insight:
✅ Support Respected: Price bounced strongly from the green demand zone, signaling potential accumulation.
🔄 Neutral Zone Retest: The market is hovering around a mid-level area, indicating indecision — but also opportunity.
📈 Upside Targets: If price holds above $3,326, buyers may target the overhead resistance zones:
TP1: $3,331
TP2: $3,336
TP3: $3,340+
⚠️ Risk Management Tip:
Avoid entering at resistance. Instead, watch for a clear breakout with retest or re-entry near $3,318–$3,320 for low-risk long setups. Always use tight stop-losses below the demand zone to manage risk.
📌 Conclusion:
This is a classic intraday recovery setup. If momentum sustains, we may see a retest of upper supply zones. Conservative traders should wait for confirmation before entering. The market is showing early signs of strength — watch this level closely.

RELIANCE Croosed resistance, strong sentiments supporting upmove. Strong trend reversal clearly visible in weekly timeframe.

PLTR 1D — When the tea is brewed and the handle’s in placePalantir’s daily chart is shaping up a textbook cup with handle pattern — one of the most reliable continuation setups in technical analysis. The cup base was formed over several months and transitioned into a consolidation phase, building a rectangle structure where smart money likely accumulated positions before a breakout.
Now here’s the key: price has not only broken out — it’s settled above all major moving averages, including EMA 20/50/100/200 and MA 50/200. The breakout candle was supported by surging volume, signaling strong participation from institutional buyers. When all the averages start bending upwards, it's usually not by accident.
The breakout above the $121 resistance zone unlocked a pathway toward a target at $187 , derived by projecting the height of the cup upward from the breakout level. This kind of structure, once confirmed, often fuels aggressive continuation — and this one’s got the setup locked in.
From a fundamental perspective, Palantir is holding solid ground: strong earnings reports, expanding government and commercial contracts, and aggressive development in AI services. Institutional interest is rising steadily, and that momentum is visibly reflected in price action.
To sum it up: price has launched cleanly out of the consolidation zone, pierced all critical MAs and EMAs, and continues to gain momentum. While the market sips its tea, this cup is boiling hot. Just don’t forget your stop loss — this is a trading desk, not a tea party.
If you enjoy posts like this, drop a like, share it around, and let’s hear your thoughts below. It keeps ideas moving and the content flowing — free, sharp, and relevant.
