BTCUSD Below a Downtrend Line: Don’t Rush to Trust the BounceBTCUSD is still trading in a bearish-leaning environment , as neither the news backdrop nor the technical structure supports a clear bullish reversal yet. Profit-taking from large players, combined with cautious year-end sentiment, means recent Bitcoin rebounds are more technical in nature rather than the start of a new uptrend. In a thin-liquidity environment, the market tends to favor selling rallies instead of chasing higher prices.
On the chart, price remains below the descending trendline and capped by the Ichimoku cloud, confirming that sellers continue to control the primary trend. Upside attempts have been shallow and quickly sold into, reflecting a lack of conviction from buyers. The 89,500 area stands out as a key resistance zone, where price has tested multiple times without a decisive breakout.
In the short term, the most reasonable scenario is for BTC to rebound into resistance and then weaken, before revisiting support around 86,800. A clean break below this level could open the door for further downside extension. Conversely, only a strong breakout and sustained hold above 89,500–90,000 would truly invalidate the current bearish structure.
Harmonic Patterns

GOLD - The market may update its ATH after a correction...FX:XAUUSD bounces off 4475 and updates its local maximum in the distribution phase to 4519.4. Against the backdrop of low liquidity associated with the end of the calendar year, movements may be sharp and unpredictable...
The fundamental background remains unchanged, supporting gold: a weak dollar, tense geopolitical situation, mixed data from the US. However, the main problem at the moment is low liquidity due to the holidays.
The Asian market bought up the supply and drove up the price. After such a strong movement, the market may enter a consolidation or correction phase, during which it may test 4508-4500 before rising.
Resistance levels: 4519, 4526, 4550
Support levels: 4508, 4500
A low-liquidity market is easier to manage (in terms of manipulation). Accordingly, use strong setups and short targets for trading, as movements can be sharp and unpredictable.
I expect the bull market to continue after the correction.
Best regards, R. Linda!

Elise | BTCUSD | 30M – Distribution → BOS → Liquidity SweepBITSTAMP:BTCUSD
The sell-side liquidity sweep produced a technical bounce; however, price has failed to reclaim key structure or break descending resistance. This indicates a corrective retracement, not accumulation. Until a bullish structure shift occurs, downside continuation remains the higher-probability scenario.
Key Scenarios
❌ Bearish Continuation (Primary Bias)
Rejection below descending trendline keeps BTC vulnerable to another liquidity run.
🎯 Target 1: 86,600
🎯 Target 2: 86,200 – 86,000
✅ Bullish Invalidation
Only a 30M close above 88,000 with structure shift invalidates bearish continuation and opens room for higher retracement.
Current Levels to Watch
Resistance 🔴: 87,900 – 88,000
Support 🟢: 86,600 → 86,000
⚠️ Disclaimer: This analysis is for educational purposes only. It is not financial advice.

Nasdaq - Tech is rallying during 2026!💰Nasdaq ( TVC:NDQ ) is remaining totally bullish:
🔎Analysis summary:
The Nasdaq and the entire tech sector is about to finish a very strong year of 2025. Going into 2026, market structure remains totally obvious and is clearly showing massive upside potential. Every major dip, especially going into 2026, leads to a massive buying setup.
📝Levels to watch:
$25,000 and $21,000
SwingTraderPhil
SwingTrading.Simplified. | Investing.Simplified. | #LONGTERMVISION

AVAXUSDT Forming Falling WedgeAVAXUSDT is forming a clear falling wedge pattern, a classic bullish reversal signal that often indicates an upcoming breakout. The price has been consolidating within a narrowing range, suggesting that selling pressure is weakening while buyers are beginning to regain control. With consistent volume confirming accumulation at lower levels, the setup hints at a potential bullish breakout soon. The projected move could lead to an impressive gain of around 70% to 80% once the price breaks above the wedge resistance.
This falling wedge pattern is typically seen at the end of downtrends or corrective phases, and it represents a potential shift in market sentiment from bearish to bullish. Traders closely watching AVAXUSDT are noting the strengthening momentum as it nears a breakout zone. The good trading volume adds confidence to this pattern, showing that market participants are positioning early in anticipation of a reversal.
Investors’ growing interest in AVAXUSDT reflects rising confidence in the project’s long-term fundamentals and current technical strength. If the breakout confirms with sustained volume, this could mark the start of a fresh bullish leg. Traders might find this a valuable setup for medium-term gains, especially as the wedge pattern completes and buying momentum accelerates.
✅ Show your support by hitting the like button and
✅ Leaving a comment below! (What is your opinion about this Coin?)
Your feedback and engagement keep me inspired to share more insightful market analysis with you!

STABLEUSDT | Perfect C&H FormationHello traders,
A perfect C&H formation is always welcome to see on our charts. Pretty simple with a very good R:R
What you want to look for as a TP target is the same depth of the cup.aka.distance from SH to SL.
Good Luck!
All our analysis is shared with honesty, care, and real effort. If you find value in it, a like or comment means a lot to show your support🙏📊

MSTR BULLISH DEC 25 2025MSTR is looking bullish and I have discussed the price action deeply. If you have any questions feel free to DM me.
NOTE: DO NOT BUY CALLS & YES YOU CAN SELL PUTS

SiLVER: $75| Building a Short Positiona Billionaire once said that
when you see something parabolic
coupled with coordinated news releases
in major networks
thats the time to BOOK YOUR GAiNS on the way up
or eyeball the mylti year channel to Size in Your SHORTS
for Contrarian Speculators only
as when you see it on Social Media and Prints
you are probable late to the PARTY
Risk OFF Silver time to upsize on BiTCOiN

Elise | XAUUSD | 30M – Bullish Channel ContinuationOANDA:XAUUSD
Gold rallied strongly from the accumulation base and continues to trade within a well-defined bullish channel. Multiple pullbacks into channel support have been defended, indicating strong buyer presence. Current consolidation near mid-channel suggests a corrective pause rather than distribution. As long as price holds above channel support, continuation toward the upper channel boundary remains the high-probability scenario.
Key Scenarios
✅ Bullish Case 🚀
Holding above 4,470–4,460, price is likely to rotate higher toward channel resistance.
🎯 Target 1: 4,540
🎯 Target 2: 4,575–4,580
❌ Bearish Case 📉
A 30M close below 4,450 breaks channel structure and invalidates the bullish continuation.
Current Levels to Watch
Resistance 🔴: 4,540 → 4,580
Support 🟢: 4,470 / 4,450
⚠️ Disclaimer: This analysis is for educational purposes only. Not financial advice.

Is it Bear flag on weeklyHello Everyone, All I am seeing strong Bear flag pattern, it can be a fake out but higher chances that it may break downwards and touch around 67-69 area. I am still opened to either side but leaning towards bearish side currently. Let's see how does it go.

Elise | BTCUSD | 30M – Sell-Side Sweep → Bullish ReversalBITSTAMP:BTCUSD
BTC swept sell-side liquidity around the 86,800–87,000 zone, triggering stop losses before aggressively reversing upward. This impulsive move signals institutional accumulation, not retail buying. The current pullback is corrective in nature, and as long as price holds above the swept low, continuation toward buy-side liquidity remains the primary expectation.
Key Scenarios
✅ Bullish Case 🚀
If price holds above 88,400–88,600, continuation toward buy-side liquidity is likely.
🎯 Target 1: 89,800
🎯 Target 2: 90,200 – 90,400 (Buy-Side Liquidity Pool)
❌ Bearish Case 📉
A 30M close below 87,000 invalidates the bullish setup and signals failed displacement.
Current Levels to Watch
Resistance 🔴: 89,800 → 90,400
Support 🟢: 88,400 / 87,000
⚠️ Disclaimer: This analysis is for educational purposes only. Not financial advice.

ETHUSDT – A Bullish Trend Is Starting to Re-emergeETHUSDT is entering a recovery phase as market sentiment gradually stabilizes after the previous corrective move. Recent news shows no new negative pressure, while speculative capital is beginning to rotate back into major altcoins as Bitcoin and gold hold firm at elevated levels. This environment creates favorable conditions for ETH to regain bullish momentum in the short term.
On the H4 chart, the price structure indicates that ETH is closely respecting an ascending trendline, consistently forming higher lows. The area around 2,920 is acting as a key support zone, where price has reacted positively multiple times. Holding above the Ichimoku cloud and maintaining the trendline suggest that selling pressure is fading, with buyers gradually reclaiming control.
In the near term, ETH is likely to consolidate above the 2,920 level before extending higher toward the 3,070 region. Any pullbacks that occur should be viewed as technical corrections within a newly forming uptrend, as long as the main support zone remains intact.

ETHUSD - Confirmation Over PredictionPrice has reacted strongly from the bullish order block and is now consolidating below a key intraday resistance zone (white/green area). After the recent displacement to the downside, price is showing signs of stabilization and potential short-term reversal.
Trade Idea:
Entry: Look for buy opportunities only if a 15-minute candle closes cleanly above the white/green resistance zone, confirming bullish acceptance.
Confirmation: A strong bullish close above this level signals short-term market structure alignment in favor of buyers.
Target: Upside continuation toward the next resistance / liquidity zone as marked on the chart.
Invalidation: Failure to close above resistance or a strong rejection from this zone keeps the setup invalid and increases the probability of further consolidation or a retest of lower levels.
This is a confirmation-based setup, prioritizing patience and clarity to avoid false breakouts and low-probability entries.

NOMUSDT Forming Falling WedgeNOMUSDT is forming a clear falling wedge pattern, a classic bullish reversal signal that often indicates an upcoming breakout. The price has been consolidating within a narrowing range, suggesting that selling pressure is weakening while buyers are beginning to regain control. With consistent volume confirming accumulation at lower levels, the setup hints at a potential bullish breakout soon. The projected move could lead to an impressive gain of around 140% to 150% once the price breaks above the wedge resistance.
This falling wedge pattern is typically seen at the end of downtrends or corrective phases, and it represents a potential shift in market sentiment from bearish to bullish. Traders closely watching NOMUSDT are noting the strengthening momentum as it nears a breakout zone. The good trading volume adds confidence to this pattern, showing that market participants are positioning early in anticipation of a reversal.
Investors’ growing interest in NOMUSDT reflects rising confidence in the project’s long-term fundamentals and current technical strength. If the breakout confirms with sustained volume, this could mark the start of a fresh bullish leg. Traders might find this a valuable setup for medium-term gains, especially as the wedge pattern completes and buying momentum accelerates.
✅ Show your support by hitting the like button and
✅ Leaving a comment below! (What is your opinion about this Coin?)
Your feedback and engagement keep me inspired to share more insightful market analysis with you!

Bulllflag QQQ Tight stopPretty clear in the picture consolidating around price you could argue its a triple top but people often forget even within a triple top you can rip past price just to come back down. Doubt we see an explosive move today but something to be mindful of

NOMUSDT UPDATENOM
UPDATE
NOM Technical Setup
Pattern: Falling Wedge Pattern
Current Price: $0.00787
Target Price: $0.02500
Target % Gain: 218.21%
Technical Analysis: NOM is breaking out of a falling wedge pattern on the 1D chart, indicating bullish potential. The price has recently surged above the resistance trendline, supported by renewed buying interest. This breakout setup suggests the possibility of continuation toward the projected target zone near $0.02500, assuming the breakout holds and momentum sustains.
Time Frame: 1D
Risk Management Tip: Always use proper risk management.

AVAXUSDT UPDATEAVAX
UPDATE
AVAX Technical Setup
Pattern: Falling Wedge Pattern
Current Price: $12.45
Target Price: $36.00
Target % Gain: 189.16%
Technical Analysis: AVAX is showing signs of breaking out of a falling wedge pattern on the 1D chart, indicating bullish potential if price can sustain above the wedge resistance. The current price action has held above key support levels, and a confirmed breakout with rising volume could validate continuation toward the $36.00 target zone measured from the wedge.
Time Frame: 1D
Risk Management Tip: Always use proper risk management.

CADJPY→ Trade Analysis | BUY SetupCADJPY is moving in an UP trend channel.
The chart broke through the dynamic Resistance line, which now acts as support.
We expect a decline in the channel after testing the current level which suggests that the price will continue to rise
Hello Traders, here is the full analysis.
I think we can soon see more fall from this range! GOOD LUCK! Great BUY opportunity CADJPY
I still did my best and this is the most likely count for me at the moment.
-------------------
Traders, if you liked this idea or if you have your own opinion about it, write in the comments. I will be glad 🤝

Netflix - This stock will drop another -30%!📽️Netflix ( NASDAQ:NFLX ) is still totally bearish:
🔎Analysis summary:
A couple of months ago, Netflix retested a major resistance trendline. This was a clear sign for us to take profits and Netflix has already been dropping about -30%. Looking at structure, the next support is the previous all time high, meaning Netflix will drop another -30%.
📝Levels to watch:
$70
SwingTraderPhil
SwingTrading.Simplified. | Investing.Simplified. | #LONGTERMVISION

Thin Liquidity, Gold Can Fly: Are You Buying at the Right Level?Hello traders, let’s continue with today’s XAUUSD outlook.
Personally, I believe the primary trend of XAUUSD remains BULLISH , supported by both fundamental news and technical structure . However, in a thin holiday liquidity environment , the market may choose one of two clear scenarios below before confirming its next directional move.
From a news perspective, gold has just printed a record high during the Asian session , driven by rising safe-haven demand amid escalating U.S.–Venezuela geopolitical tensions . With year-end trading volumes remaining light , defensive capital flows tend to amplify price swings, making gold more prone to sharp breakouts or fast pullbacks than usual.
Scenario (1) – Direct continuation higher:
If price holds firmly above the 4,480 area (support zone 1) and buying pressure remains steady, gold could push directly toward the 4,550 target. This is the trend-following scenario, favored when safe-haven sentiment stays dominant and no strong selling pressure appears at current levels.
Scenario (2) – Deeper pullback, then rally:
If the market needs to “cool off”, price may correct toward the 4,400 area (support zone 2). Should this zone be well defended, the pullback would likely be technical in nature, forming a stronger base for the next bullish leg toward 4,550. This scenario often unfolds when RSI eases and buyers step back in at more favorable prices.
Conclusion:
Regardless of which path the market takes, 4,550 remains the key short-term objective. The most important factor is discipline: buy only with confirmation at support, and avoid FOMO during strong holiday-driven volatility.
Note: This is only a trading idea for reference. I’d be happy to hear your views—feel free to share your perspective or leave a comment below.

WTI OIL on its 1D MA50 again. Sell signal.Last week (December 17, see chart below) we gave a strong Buy Signal on WTI Crude Oil (USOIL) after it hit and rebounded on the 8-month Support.
The resulting rally easily hit our $58.50 Target and today the price tests the 1D MA50 (blue trend-line) for the first time since the previous Lower High of the 5-month Channel Down. This is an automatic technical Sell Signal as at the same time the 1D RSI is reversing near its 4-month Resistance Zone.
Our short-term Target is again the $55.20 Support.
---
** Please LIKE 👍, FOLLOW ✅, SHARE 🙌 and COMMENT ✍ if you enjoy this idea! Also share your ideas and charts in the comments section below! This is best way to keep it relevant, support us, keep the content here free and allow the idea to reach as many people as possible. **
---
💸💸💸💸💸💸
👇 👇 👇 👇 👇 👇

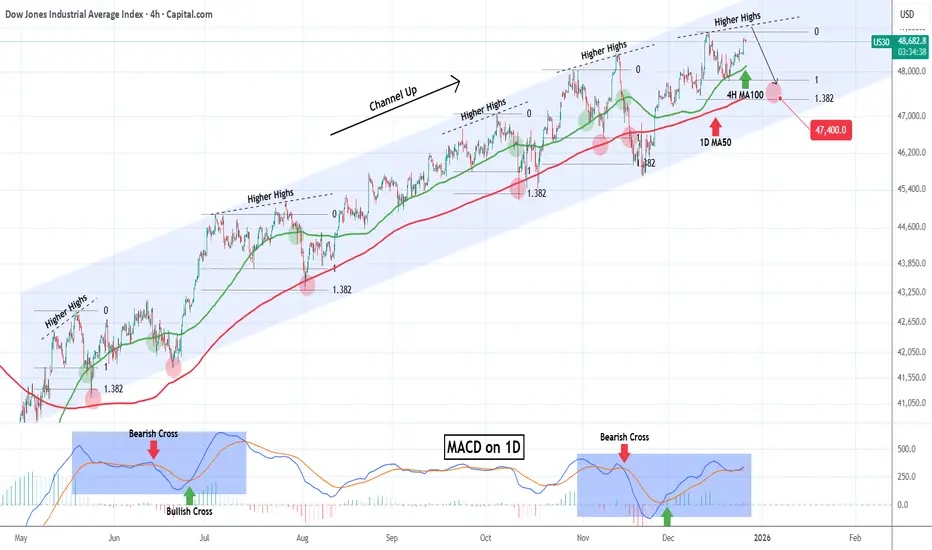
DOW JONES headed towards a rejection.Dow Jones (DJI) has been trading within a nearly 8-month Channel Up and is close to its All Time High (ATH) after rebounding last week on its 4H MA100 (green trend-line).
This pattern is cyclical and every time the latter support broke after a medium-term rally from its 1D MA50 (blue trend-line), the index got rejected on a Higher Highs trend-line and corrected back to the 1D MA50. Even the 1D MACD is printing a sequence similar to June - July.
As a result, we expect the new year to find Dow on its 1.382 Fibonacci extension at 47400 at least, which is the Fib level that every such correction pulled back to.
---
** Please LIKE 👍, FOLLOW ✅, SHARE 🙌 and COMMENT ✍ if you enjoy this idea! Also share your ideas and charts in the comments section below! This is best way to keep it relevant, support us, keep the content here free and allow the idea to reach as many people as possible. **
---
💸💸💸💸💸💸
👇 👇 👇 👇 👇 👇
GOLD SELL BIAS📊 Market Structure Breakdown
1️⃣ Higher Timeframe Context
• Price previously rallied strongly into a premium supply zone (red shaded area at the top).
• That zone aligns with previous highs + imbalance, making it a high-probability sell area.
• Reaction from the zone was impulsive, not corrective → confirms strong selling interest.
⸻
2️⃣ Liquidity & Structure Shift
• After rejecting supply, price:
• Swept equal highs / internal liquidity
• Printed a bearish displacement (strong red candles)
• This confirms a market structure shift (MSS) from bullish → bearish.
⸻
3️⃣ Bearish Consolidation (Distribution)
• The sideways price action after the drop forms a bearish flag / distribution range:
• Lower highs
• Weak bullish attempts
• This tells us institutions were reloading shorts, not accumulating longs.
⸻
4️⃣ Support Break = Continuation Signal
• Price broke:
• The range low
• A rising internal trendline
• Breakdown candle closed with momentum, confirming continuation to the downside.
⸻
5️⃣ Targets & Draw on Liquidity
• Downside draw:
• Internal equal lows
• Discount demand zone (grey shaded area below)
• That area is where buyers are likely to step in, not where sellers chase.
⸻
🔑 Key Confluences (Why This Works)
✔ HTF supply zone
✔ Liquidity sweep before reversal
✔ Bearish displacement (MSS)
✔ Distribution → breakdown
✔ Clean liquidity target below
This is smart money execution, not random price movement.
⸻
🧠 Trader Insight (Psychology)
Most traders:
• Buy inside premium ❌
• Panic sell at discount ❌
Professionals:
• Sell into liquidity + premium
• Take profits at discount + demand
