BITCOIN turning the Bull Flag into Support??Bitcoin (BTCUSD) has been trading sideways, almost flat, since the July 03 High, supported by the 1D MA50 (blue trend-line).
Perhaps the strongest development of the week though is the fact that this consolidation has been taking place at the top (Lower Highs) of what we previously identified as a Bull Flag pattern.
Together with the 1D MA50, this Lower Highs trend-line forms a formidable Support, which as long as it holds, can technically fulfil the technical expectations out of this pattern and target the 2.0 Fibonacci extension at $168500.
Is this one step closer to our 'fair valued' $150k Target for this Cycle? Feel free to let us know in the comments section below!
-------------------------------------------------------------------------------
** Please LIKE 👍, FOLLOW ✅, SHARE 🙌 and COMMENT ✍ if you enjoy this idea! Also share your ideas and charts in the comments section below! This is best way to keep it relevant, support us, keep the content here free and allow the idea to reach as many people as possible. **
-------------------------------------------------------------------------------
💸💸💸💸💸💸
👇 👇 👇 👇 👇 👇
Harmonic Patterns

BITCOIN Is there enough time for another parabolic rally?Bitcoin (BTCUSD) is practically consolidating on the short-term, having just recently been rejected off its new All Time High (ATH). Despite the short-term volatility, the long-term outlook is still a very strong, structured uptrend, a Channel Up pattern that is now technically aiming for its next Higher High.
Incredibly enough, this Channel Up since the November 2022 market bottom, has been almost entirely within the Buy Zone (green) of the Fibonacci Channel Up going back all the way to April 2013!
As you can see during the previous two Cycles, every time BTC got above that Buy Zone, it started a parabolic rally. So far, we haven't got such rally on the current Cycle and with time running out (assuming the 4-year Cycle model continues to hold), do you think we will get one this time around?
Feel free to let us know in the comments section below!
-------------------------------------------------------------------------------
** Please LIKE 👍, FOLLOW ✅, SHARE 🙌 and COMMENT ✍ if you enjoy this idea! Also share your ideas and charts in the comments section below! This is best way to keep it relevant, support us, keep the content here free and allow the idea to reach as many people as possible. **
-------------------------------------------------------------------------------
💸💸💸💸💸💸
👇 👇 👇 👇 👇 👇

EURUSDHello Traders! 👋
What are your thoughts on EURUSD?
Following its recent rally, EURUSD has reached a key resistance zone, which also aligns with a trendline. The pair failed to break above this area and has been rejected.
Given the weak momentum and bearish reaction, we do not expect a breakout at this stage.
Instead, we anticipate some consolidation around the resistance, followed by a downward move toward the specified support level.
Don’t forget to like and share your thoughts in the comments! ❤️

Gold - The clear top formation!🪙Gold ( TVC:GOLD ) just created a top formation:
🔎Analysis summary:
Over the past four months, Gold has overall been moving sideways. Following a previous blow-off rally of about +25%, this cycle is very similar to the 2008 bullish cycle. Bulls are starting to slow down which will most likely result in the creation of at least a short term top formation.
📝Levels to watch:
$3.000
🙏🏻#LONGTERMVISION
Philip - Swing Trader

Setupsfx_ | XAUUSD(Gold):07/07/2025 Update | Gold dropped nicely when the market opened last night, dropping around 600 pips. However, it couldn’t hold on to the gains and came right back to the selling zone. There are two entry points and two potential targets.
Good luck and trade safely!
Team Setupsfx_

S&P500 Strong Buy Signal flashed for the 3rd time in 2 years!The S&500 index (SPX) is comfortably trading above its previous All Time High (ATH) and shows no signs of stopping here. Coming off a 1D MA50/ 100 Bullish Cross, we expect the 1D MA50 (blue trend-line) to turn now into the first long-term Support going towards the end of the year.
The last 1D MA50/ 100 Bullish Cross (December 15 2023) was nothing but a bullish continuation signal, which extended the uptrend all the way to the 2.0 Fibonacci extension, before a pull-back test of the 1D MA100 (green trend-line) again.
The 1W RSI is now on the same level (63.30) it was then. In fact it is also on the same level it was on June 05 2023, which was another such bullish continuation signal that peaked on the 2.0 Fib ext.
This suggests that we have a rare long-term Buy Signal in our hands, only the 3rd time in 2 years that has emerged. Based on that, we should be expecting to see 7600 as the next Target before it hits the 2.0 Fib ext and pulls back to the 1D MA100 again and there is certainly enough time to do this by the end of the year, assuming the macroeconomic environment favors (trade deals, potential Fed Rate cuts etc).
-------------------------------------------------------------------------------
** Please LIKE 👍, FOLLOW ✅, SHARE 🙌 and COMMENT ✍ if you enjoy this idea! Also share your ideas and charts in the comments section below! This is best way to keep it relevant, support us, keep the content here free and allow the idea to reach as many people as possible. **
-------------------------------------------------------------------------------
Disclosure: I am part of Trade Nation's Influencer program and receive a monthly fee for using their TradingView charts in my analysis.
💸💸💸💸💸💸
👇 👇 👇 👇 👇 👇

PEPEUSDT Critical Decision Zone – Massive Move Incoming?🧠 Macro Technical Analysis
PEPEUSDT is currently hovering within a critical demand zone (0.00000095 – 0.00000110), an area that has historically acted as a strong accumulation base and a launchpad for previous rallies. The chart structure shows multiple interactions with this zone, highlighting its significance as a key inflection level.
This zone is not just a support — it’s a make-or-break battlefield between bulls and bears. Price is consolidating within this zone, setting the stage for a potential explosive breakout or a dangerous breakdown.
🔍 Pattern Breakdown & Key Technical Levels
Accumulation Zone (Yellow Box):
Seen from April 2024 to now, price has bounced several times from this region. The multiple touches and long wicks confirm strong buying interest here.
Sideways Channel / Range-Bound Structure:
Price action between 0.00000110 and 0.00000283 has formed a clear horizontal range, and the current price is once again testing the lower boundary of this range.
Implied Move Projection (Yellow Arrow):
A potential breakout from this range could trigger a measured move to the upside, aiming for the previous high at 0.00000283 — representing a +150% upside potential from current levels.
📈 Bullish Scenario:
1. Price holds above 0.00000100, maintaining structure above demand.
2. Break and daily close above:
0.00000127 (minor resistance)
Then 0.00000140, which could trigger acceleration.
3. Target levels to watch:
🟡 0.00000162 – Intermediate resistance
🟡 0.00000180 – Confluence zone
🟡 0.00000211 – Mid-range mark
🟡 0.00000240 – Major breakout checkpoint
🟡 0.00000283 – Range high and final bullish target
Break above 0.00000283 could open a parabolic rally.
📉 Bearish Scenario:
1. Breakdown below 0.00000095, followed by rejection from the bottom of the demand zone.
2. This could signal:
Weak market structure
Failed accumulation
Invalidation of the bullish setup
Key downside levels:
🔻 0.00000080 – Local support
🔻 0.00000065 – Historical low defense
🔻 0.00000038 – Macro capitulation zone
⚠️ Breakdown from current levels will turn this accumulation into distribution.
🧭 Strategic Takeaway:
PEPE is trading at a decisive zone. A bounce from this level could signal the start of a new bullish phase, while a breakdown could usher in a deeper bearish trend. Traders should closely monitor volume spikes, breakout candles, and confirmations above 0.00000127 to validate bullish momentum.
This is a low-risk, high-reward setup for disciplined traders with proper risk management.
#PEPEUSDT #PEPE #CryptoTechnicalAnalysis #AltcoinBreakout #MemeCoinSeason #CryptoTrading #AccumulationZone #BreakoutAlert #BullishCrypto #BearishScenario

AUDUSDHello Traders! 👋
What are your thoughts on AUDUSD?
The AUDUSD pair reached a resistance zone, which was accompanied by a negative divergence, signaling weakening bullish momentum. This led to a bearish reaction from that area.
We expect that, after some consolidation around this resistance, the pair will likely continue its decline at least toward the specified support level.
Don’t forget to like and share your thoughts in the comments! ❤️

FLOKI/USDT — Major Breakout Incoming? The Calm Before a BullishThe daily chart of FLOKI/USDT reveals a highly compelling technical setup. After a prolonged downtrend that started in late 2024, FLOKI is now testing a key descending trendline — signaling a potential trend reversal and the beginning of a new bullish phase if a breakout is confirmed.
📊 Detailed Technical Analysis:
🔍 Pattern Formation:
Descending Trendline Resistance: Acting as a dynamic resistance since the November 2024 high, capping every major rally attempt.
Consistent Higher Lows: Since March 2025, FLOKI has been forming a series of higher lows — an early bullish sign of accumulation.
Volatility Squeeze: Recent candles are consolidating near the apex of the triangle, suggesting a breakout move is imminent.
Bullish Structure Forming: A successful breakout would complete a bullish reversal pattern on the daily chart.
🟢 Bullish Scenario (Breakout Confirmation):
If the price closes above 0.0001079 on the daily timeframe and confirms a clean breakout above the descending trendline, we can anticipate an extended move to the upside.
🎯 Key upside targets based on historical resistance zones:
1. Target 1: 0.00011535 → Previous minor resistance
2. Target 2: 0.00013414 → March 2025 supply zone
3. Target 3: 0.00016078 → Strong horizontal resistance
4. Target 4: 0.00020000 → Major psychological level
5. Target 5: 0.00028779 → Previous swing high (November 2024)
💥 A full breakout move to the top could offer over 200% potential upside, making it a high-reward setup for well-managed long entries.
🔴 Bearish Scenario (Rejection):
If FLOKI fails to break above the descending trendline:
⚠️ We could see a retracement to lower support levels:
Minor Support: 0.00007500
Key Support: 0.00005700
Last Defense: 0.00004548 → Previous cycle low
A breakdown below these support levels would invalidate the bullish setup and shift momentum back in favor of the bears.
🧠 Pro Tips:
Watch for Volume Confirmation during the breakout — high volume adds credibility.
Focus on Body Closes, not just wicks, when identifying valid breakouts.
Manage Risk Wisely — a stop loss just below the trendline offers solid risk-to-reward.
📅 Conclusion:
FLOKI/USDT is at a critical technical juncture. A confirmed breakout above the descending trendline could spark a strong bullish trend, while a rejection may lead to deeper correction or consolidation.
💡 The next few candles will likely determine the medium-term direction for FLOKI.
#FLOKI #FLOKIUSDT #AltcoinBreakout #CryptoSetup #TechnicalAnalysis #BullishCrypto #BreakoutTrade #TrendReversal #CryptoSignals

GBPUSD - Macro Trend Continues!Hello TradingView Family / Fellow Traders. This is Richard, also known as theSignalyst.
📈GBPUSD has been overall bullish trading within the rising channel marked in red. And it is currently retesting the lower bound of the channel.
Moreover, the green zone is a strong structure.
🏹 Thus, the highlighted blue circle is a strong area to look for buy setups as it is the intersection of the lower red trendline and structure.
📚 As per my trading style:
As #GBPUSD approaches the blue circle zone, I will be looking for bullish reversal setups (like a double bottom pattern, trendline break , and so on...)
📚 Always follow your trading plan regarding entry, risk management, and trade management.
Good luck!
All Strategies Are Good; If Managed Properly!
~Rich
Disclosure: I am part of Trade Nation's Influencer program and receive a monthly fee for using their TradingView charts in my analysis.

SOL Harmonic Setup — $95 Sweep May Precede Rally Toward $200 +Solana may be forming a rare bullish harmonic pattern, suggesting a possible sweep of the $95 low before a reversal targets the $200 region. Critical resistance levels remain key in the short term.
Solana is showing early signs of a high-probability harmonic setup that could lead to a powerful bullish reversal — but not before a potential sweep of the recent $95 low. From a technical perspective, price is currently trading near the point of control, battling resistance layers that may trigger the next corrective leg in the pattern. If confirmed, this harmonic could produce a textbook C-to-D leg completion before launching a move toward the $200+ zone.
Key Technical Points:
- Point of Control Battle: Price is currently testing the POC with weak momentum
- Resistance at Value Area High + 0.618 Fib: Confluence zone could trigger rejection
- C-Leg Completion Around $95: Potential low before bullish harmonic activates toward $200+
Solana’s price action has entered a critical zone of decision. Price is hovering near the point of control — the highest volume-traded level in the current range — and is now contending with a strong confluence of resistance just above. This includes the value area high and the 0.618 Fibonacci retracement, both of which have historically produced strong rejections.
If Solana fails to break through this resistance cluster with conviction, it increases the probability of a C-leg rejection within the emerging bullish harmonic pattern. This corrective move could send SOL back down toward the $95 region, sweeping the previous low and completing a technical bottom.
Such a move — while bearish in the immediate short term — would not invalidate the bullish thesis. In fact, a sweep of $95 could act as the final leg (D) completion of what may evolve into a textbook “godly harmonic” pattern. These structures are rare and powerful, typically resulting in sharp reversals when key conditions align. The eventual upside target for this move lies in the $200+ region, in line with the prior macro swing highs and high time frame resistance levels.
Until this scenario is confirmed or invalidated, Solana remains range-bound between major high time frame levels. Traders should stay alert for signs of rejection at current resistance — or, conversely, a volume-backed breakout above the value area high that would negate the harmonic setup.

Heading Yesterday's Resistance Zone, Price Will ReactAfter a recovery to 107.500 BTCUSD is recovering to the upside again towards the resistance of 1.09500. This is the convergence zone between the trendline and yesterday's high. BTCUSD price may correct lower from this zone. Then find some new bullish momentum at strong support zones towards an all-time high.
Support 107.500 - 105.300
SELL Trigger: Break bellow 107.500
Resistance: 109.500- 110.500

09.07.25 Morning ForecastPairs on Watch -
FX:GBPUSD
FX:EURAUD
OANDA:JP225USD
FX:USDCAD
A short overview of the instruments I am looking at for today, multi-timeframe analysis down to what I will be looking at for an entry. Enjoy!

Bitcoin New ATH Targeting $115K–$120KAfter topping out at the previous ATH, Bitcoin formed a classic diamond top pattern which triggered a drop to the $98,115 level. Now, Bitcoin appears to be forming a second diamond — but this time, the breakout structure suggests a bullish reversal rather than a top.
This second diamond formation indicates consolidation before a strong upward move, potentially driving BTC toward a new all-time high between $115K and $120K.
Watch for confirmation of the breakout. If price holds above key resistance levels post-pattern, the bullish scenario gains strength.

Bullish momentum to extend?Ethereum (ETH/USD) is reacting off the pivot which is a pullback support and could rise to the 78.6% Fibonacci resistance.
Pivot: 2,595.10
1st Support: 2,525.42
1st Resistance: 2,735.62
Risk Warning:
Trading Forex and CFDs carries a high level of risk to your capital and you should only trade with money you can afford to lose. Trading Forex and CFDs may not be suitable for all investors, so please ensure that you fully understand the risks involved and seek independent advice if necessary.
Disclaimer:
The above opinions given constitute general market commentary, and do not constitute the opinion or advice of IC Markets or any form of personal or investment advice.
Any opinions, news, research, analyses, prices, other information, or links to third-party sites contained on this website are provided on an "as-is" basis, are intended only to be informative, is not an advice nor a recommendation, nor research, or a record of our trading prices, or an offer of, or solicitation for a transaction in any financial instrument and thus should not be treated as such. The information provided does not involve any specific investment objectives, financial situation and needs of any specific person who may receive it. Please be aware, that past performance is not a reliable indicator of future performance and/or results. Past Performance or Forward-looking scenarios based upon the reasonable beliefs of the third-party provider are not a guarantee of future performance. Actual results may differ materially from those anticipated in forward-looking or past performance statements. IC Markets makes no representation or warranty and assumes no liability as to the accuracy or completeness of the information provided, nor any loss arising from any investment based on a recommendation, forecast or any information supplied by any third-party.

BTC - Drooling for 110K!So my acc was banned for a day and Im soo back! So i feel if it stays sideways for the orange line what we want, looks really good to take 110k to 110,202! breaks below orange line goes to red, stances - GETS CHANGED!

FISUSDT Forming Bullish WaveFISUSDT is currently showing an interesting bullish setup, capturing the attention of crypto traders who are watching for fresh altcoin opportunities. The formation of a bullish wave pattern, supported by steady volume, suggests that FIS could be primed for a strong breakout in the near term. Technical analysts are forecasting a potential price surge of 40% to 50%+ if the bullish momentum sustains and key resistance levels are cleared with conviction.
The sentiment around FIS is improving as more investors recognize its utility and real-world use cases within decentralized finance and staking solutions. The network’s continuous development and strategic partnerships are adding to its long-term growth narrative. This has helped FIS build a loyal community and attract new capital inflows, which is crucial for maintaining positive price action.
From a technical perspective, traders should look for confirmation of this bullish wave pattern by tracking the breakout above trendline resistance and keeping an eye on volume spikes. If the breakout is supported by strong buying interest, the coin could deliver impressive returns in the coming weeks. The crypto market’s overall uptrend could further support this move, making FISUSDT one to watch closely for swing trading setups.
✅ Show your support by hitting the like button and
✅ Leaving a comment below! (What is You opinion about this Coin)
Your feedback and engagement keep me inspired to share more insightful market analysis with you!

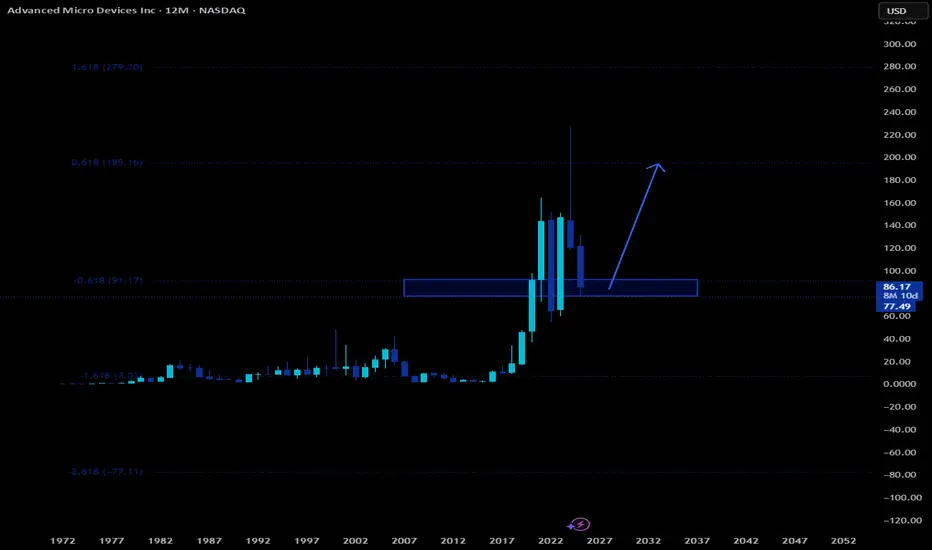
AMD HUGE LONG AMD has a huge level around $180 that is begging to be tested. We are at major support on the yearly. I expect a huge move in AMD in the coming weeks to the upside.
MAVIA/USDT Breakout from Falling Wedge | Targets Ahead$MAVIA has broken out of a well-defined falling wedge pattern on the 4H chart — a structure known for bullish reversals. The breakout is backed by strong volume and a sharp RSI spike, confirming the bullish momentum.
Key Observations:
Pattern: Falling wedge breakout
Volume: Strong breakout candle with momentum
RSI (14): Currently at 78 — indicating overbought territory
Retest Zone: A pullback toward 0.150–0.155 may offer a better entry
Trade Setup:
Entry: 0.150–0.160
Stop Loss: 0.143 (below wedge support)
Targets: 0.1692, 0.1819, 0.2045, 0.2282, 0.2725
Conclusion:
The breakout looks promising, but RSI suggests short-term cooling. The ideal strategy is to wait for a retest before entering. Keep risk tight as it's early in the breakout phase.
DYOR | Not financial advice

USDJPY is about to sellFrom my analysis, we can see that usdjpy is about to sell... because of the bearish signal ... wait for breakout for confirmation. Trade responsibly. Goodluck
USD/JPY... Long/// 1:1 R:RHello. USD/JPY looks strong on daily time frame. RSI on 4h and 1h very high. GL

ENA/USDT Breakout Watch Signs of Reversal from a Key Demand Zone🔍 Full Technical Analysis:
ENA/USDT has been forming a Descending Triangle pattern since the December 2024 high — a structure often seen in continuation moves, but here it may act as a potential reversal pattern, especially since price is consolidating around a strong historical demand zone.
The price is hovering within a key support area between $0.1940–$0.2624, which has repeatedly held against bearish pressure. Recent candles are showing signs of accumulation, indicating possible base formation before a breakout.
✅ Bullish Scenario (Breakout Setup):
If the price successfully:
1. Breaks above the descending trendline (yellow line), and
2. Confirms with a breakout above the $0.28–$0.30 zone with strong volume,
We could see a powerful bullish reversal with the following upside targets:
📈 Target 1: $0.3720
📈 Target 2: $0.4569 – breakout structure confirmation
📈 Target 3: $0.6540 – prior resistance zone
📈 Target 4: $0.7702
📈 Target 5: $0.8928
💥 Extended Targets: $1.2512 – $1.3300 (Major High from December 2024)
🚨 A clean breakout from this setup may trigger major FOMO and offer multi-level swing trading opportunities.
❌ Bearish Scenario (Breakdown Risk):
If the downtrend continues and:
The price fails to break above the trendline, and
Breaks below $0.1940, which is the historical low support,
Then the door opens for further downside towards: 🔻 Bearish Target: $0.1600 or lower
⚠️ A confirmed breakdown below this key zone would suggest trend continuation and weakness in buyer interest.
🧠 Strategic Summary:
Strong Demand Zone + Historical Support suggest high probability of trend reversal.
Descending Triangle offers a textbook breakout opportunity with favorable risk-reward.
High RR potential makes this setup ideal for swing traders and mid-term investors.
💡 Success tip: Wait for breakout confirmation and volume spike before entering.
#ENAUSDT #CryptoBreakout #DescendingTriangle #BullishReversal #AltcoinSetup #CryptoTrading #SwingTrade #TechnicalAnalysis #ChartPatterns #SupportAndResistance
