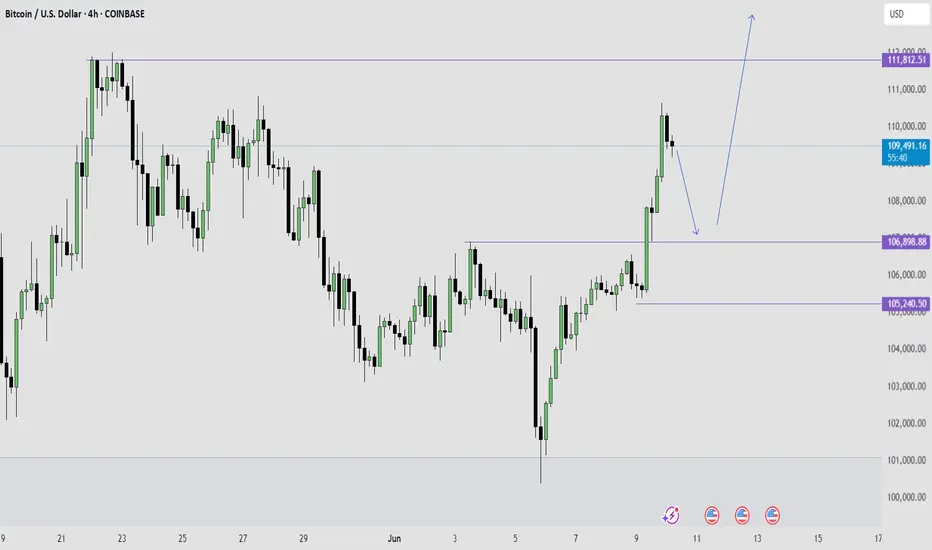
BTC to sweep liquidity?4 Hour Analysis:
- Market moving out consolidation phase (Accumulating late buyers)
- May sweep the 1st buyside liquidity (see chart)
- Or may sweep the ATH above the 1st buyside liquidity (see arrow on the right of the chart)
Ictconcepts

Buys on Gold based on 50% candle range and order blockGold has been dropping but there has been lack of volume which indicates the sellers going out and we just took out the 4hr 50% of the long wick , also having an 1hr Order block, which makes me looking for buys

GALA GOING TO MOON ''AS per my analysis gala meet the daily advanced order block at 0.01710 and mitigation block at same level and there is also a bullish order block FVG of daily time frame At 0.01780 to 0.01540 these all are IMPORTANT POI and its help to reverse the trend and other side if we talk about the target we can see recent swing high 0.02040 0.02194 and 0.02363 these level contain high liquidity and price must go to grab the liquidity and there is 1D bearish order block at 0.03294 we see the price soon at this level "
BAIS:- BULLISH
ENTRY:- 0.01710
STOPLOSS:- 0.01410
TARGET :- 0.03290
DISCLAIMER :- its not a Financial Advice
THANK YOU ;

Trading AUDUSD NZDUSD | Judas Swing Strategy 25/06/2025This week the Judas Swing strategy has delivered two clean setups on OANDA:AUDUSD and $NZDUSD. Both trades played out beautifully, hitting their targets and ending the day with a solid +4% return (2% each), reinforcing the power of patience, structure, and sticking to the rules.
Let’s break down how each trade unfolded:
Trade 1: OANDA:AUDUSD Long — Textbook Setup
We kicked off Wednesday’s session watching OANDA:AUDUSD closely after identifying a classic Judas Swing scenario.
First, we saw liquidity swept below the previous session’s low, exactly what we’re looking for. This kind of move is crucial to the strategy, it grabs early sellers or stop orders and sets the stage for a reversal.
Right after the sweep, price broke structure to the upside, confirming our bullish bias. At this point, we didn’t rush in. We waited for price to retrace into our FVG (Fair Value Gap).
Patience paid off and price finally tapped into the FVG, and as soon as the entry candle closed in our direction, we executed the trade.
We risk 1% on every trade, aiming for a 2:1 reward-to-risk. After being in drawdown for a bit, price accelerated sharply and hit our target after being in the trade for 5 hours. Clean setup, clean execution, and a smooth +2% return.
Trade 2: OANDA:NZDUSD Long
OANDA:NZDUSD presented a near-identical setup. Price had been consolidating, but by the time the NY session rolled in, the stage was set.
Just like OANDA:AUDUSD , we saw a liquidity sweep at the lows, followed by a bullish break of structure, textbook Judas Swing again.
This time, the retracement into the FVG came swiftly. We executed as soon as we had confirmation on the candle close.
The trade barely hesitated, and price moved decisively in our direction, steadily climbing until our target was hit. Another +2% return, reinforcing the strategy’s strength when rules are respected
What This Week Reminds Us:
Discipline matters: We don’t chase trades. Both setups met all our checklist criteria
Patience is key: Waiting for the FVG entry and confirmation avoids emotional entries
Risk management is the foundation: With a 1% risk and 2:1 target, you only need to win half the time to be consistently profitable
When you follow a rules-based strategy like Judas Swing, you remove the guesswork and bring structure to your trading decisions.

EURJPY LONG IDEAI have been waiting for this EURJPY long setup to form for the past 2 trading sessions.
This morning I saw this beautiful bullish swing low formed and that is my entry signal for to take a long trade on EURJPY.
REASONS:
EURJPY is super bullish right now.
The Daily and 4Hour time frame trend is extremely bullish. So, am only looking to take a long buy to follow the trend direction.

EUR/JPY higherPrice retraced from Weekly FVG. The retracement had high momentum down, making Fair Value Gaps on the 4H. After 3 things aligned:
1. Price made new 4H Fair Value Gap coming from the Daily Fair Value Gap
2. Price disrespected Swing High in 4H Fair Value Gap
3. Rejection off D FVG closed with perfect 2 candle rejection.
I entered the trade after I've seen the close on the daily timeframe, Stop below the 4H Fair Value Gaps.

EURAUD: Possible Swing Movement of 660 pips expected! FX:EURAUD on daily candles of last few days breakthrough and now dropping back to demand zone where we expect price to bounce strongly and at least we expect target one to accomplished by end of January. While target two and three remain a long away from our current price area. Stop Loss should be below the strong wick of daily candle.
From fundamentals side AUD will be weaken and EURO can be bullish for next few months, taking entry will require a strict risk management as this is a swing trade, do not expect to achieve the target in couple of hours or days.
Good luck and trade safe.

NASDAQ READY TO CONTINUE THE LONG-TERM WEEKLY BULLISH RUN
FX:NAS100
I just entered this buy trade on Nasdaq on the daily time frame.
The trade setup is a Swing trade following the monthly and weekly orderflow.
The Monthly is bullish, the weekly is also bullish, so I entered on the daily time frame retracement.
My overall take profit is a risk reward of 1:4.

GBPUSD IS LOOKING WEAK FOR A HARD SELL OFF SWING TRADEOANDA:GBPUSD Has broken the bullish swing low on 4 Hour time frame with strong sell off bearish candles leaving behind a big bearish imbalances in price. Which extra confirm that price is extremely bearish on 4 Hour time frame.
Now that trend has shifted from bullish trend to a bearish one, am now bearish on GBPUSD.
Bearish shift in market structure that happened on OANDA:EURUSD EURUSD which is a correlating pair with GBPUSD extra confirm this bearish bias on GBPUSD.
likewise also, the Bullish Shift in Market Structure on OANDA:USDCAD USDCAD, which is an opposite correlating pair confirm this sell on GBPUSD.
So, my focus now is selling GBPUSD in every pullback or retest of key bearish levels.
I will update you as the trade develop.

USDCAD SWING TRADE LONG IDEA - MASSIVE BULLISH MOVE COMING?OANDA:USDCAD USDCAD has given a massive bullish break of structure on 4 Hour time frame after tapping to a strong key level on weekly time frame that is serving as support.
Now am bullish on USDCAD for a weekly income swing trading moves.
All I need right now to enter for a long to ride the move is a pull back to key level of support like old highs or imbalance levels.
That is when I will take a bullish long trade on USDCAD.
This is my A+ Trading Setup.
What do you see on your chart?

Could be a Crazy BuyBeen waiting for WEEKS to see GBPAUD Trade into a Daily Orderblock.
Now, Usually, we wait to see how price reacts at this level.
However,
The reason I say this could be a great buy is because
- Dollar Correlation
- Old weekly and Daily Lows Swept
-Liq. Swept into Daily OrderBlock
- London Killlzone
- Its my girl GBPAUD

Bearish USD/CAD Presents a Selling Opportunity Now.FenzoFx—USD/CAD surged to 1.3686, a resistance zone backed by a bearish Fair Value Gap. Stochastic shows 81.0, signaling short-term overpricing. The market remains bearish below 1.3729, with fundamentals pointing to a stronger CAD.
A decline toward 1.362 is likely if USD/CAD stays below 1.3729.

#EURUSD: Nothing to expect from DXY| View Changed Swing Trading|Hey there! So, we were previously thinking EURUSD was going to be bearish, but things have turned around and it’s looking bullish for now.
The extreme bearish pressure on USD has caused all the major USD pairs to be in a range. As the week goes on and we get the NFP data, the market will probably focus more on these economic indicators. So, it’s not surprising to see some market ranges during this time.
We’ll keep a close eye on the market, as there might be some manipulation going on this week.
We recommend waiting until Monday’s daily candle closes to see if the bullish trend is strong enough. Then, based on the price momentum, you can make your decisions.
We hope you have a great week and safe trading! If you like our work and analysis, please consider liking, commenting, and sharing our content.
Cheers,
Team Setupsfx
❤️🚀

Traders, it's time to pay close attention! 🚨 USDJPY 4H Setup Alert – High-Probability Play Unfolding! 🚨
Traders, it's time to pay close attention! 🧠📊
The USDJPY pair has just perfectly tapped into a key bullish Fair Value Gap (FVG) on the 4-hour chart — a classic move in the smart money playbook. What’s more? We've just seen a clean sweep of internal range liquidity (IRL) — a textbook liquidity grab that signals potential accumulation by larger players. 💥💼
This is not just noise — it's a significant signal. The market structure is hinting at a possible shift in momentum, and bullish pressure is building. The trap has been set, the weak hands have been shaken out, and smart money may be preparing for a strong upward push. 📈🐂
🔮 What’s the next move?
All eyes are now on the external range liquidity (ERL) — a prime liquidity pool sitting above current price levels. If price accelerates toward it, this zone could act as the magnet and the catalyst for the next explosive move upward. 🚀
🔥 Key Points to Watch:
Bullish FVG reaction ✅
IRL liquidity swept ✅
Bullish market structure forming 🏗️
ERL liquidity resting overhead — potential target 🎯
Volume profile & order flow confirming accumulation? 👀
⚠️ Stay alert and don’t chase — let the setup come to you.
Smart money might already be stepping in, and if this momentum follows through, we could be witnessing the beginning of a strong leg up.
Mark your charts and monitor closely — opportunity is knocking. 📍🕵️♂️

Bearish Gold ideaThe idea is somehow risky due to geopolitical tensions in the middle east conflict, but it could still play out for short first then bullish to a new all time high.


Judas Swing Monday Recap – Sticking to the Plan Pays 09/06/2025In case you're new to the Judas Swing Strategy, here’s the strategy in a nutshell:
It’s a classic price manipulation strategy where the market fakes a move in one direction (the “Judas” move), usually after the 00:00–08:30 EST window, before sharply reversing. This tactic is often used by smart money to trap retail traders around key highs/lows, followed by a reversal into a Fair Value Gap (FVG) for entry confirmation.
We began Monday spotting a textbook Judas Swing on FX:EURUSD which was our first trade of the day. Price took out session lows, grabbing liquidity, then gave us a break of structure to the upside and a clean reversal into the FVG.
We entered long with our stop loss below the manipulation low. The trade moved nicely into profit and came within points of our target but just as we were anticipating a clean 1:2, price stalled and reversed aggressively, stopping us out.
Trade Outcome: Loss
Risk-Reward: -1%
Lesson: Even the most valid setups will sometimes fail
The next Judas swing setup came on $GBPUSD. Price swept the low of the zone, then gave a break of structure, with price retracing into the FVG. We entered long, placing the stop loss 10 pips below entry price.
The trade rallied hard post-entry, hitting our target with minimal drawdown
Trade Outcome: Win
Risk-Reward: +2%
This is why we take every valid setup. The win here offset the earlier FX:EURUSD loss, keeping us net even on the day at this point
The final Judas swing setup on Monday was on OANDA:AUDUSD , and it couldn’t have been cleaner. After a strong sweep of previous lows, price reversed and broke structure convincingly. An FVG formed and price retraced into it beautifully.
We entered long, placing the stop below the liquidity sweep. Price then rallied steadily throughout the session, and retraced almost hitting our stop loss but turned around and hit our 1:2 target.
Trade Outcome: Win
Risk-Reward: +2%
Despite starting the day with a loss, staying disciplined and trading all valid Judas setups left us with:
1 loss ( FX:EURUSD -1%)
2 wins ( FX:GBPUSD +2%, OANDA:AUDUSD +2%)
Net Gain: +3R
This is why a rules-based approach beats emotional trading. Stick to the process, and the edge takes care of the rest.

Let the market pull back toward the marked FVG.🚨 EUR/USD Traders – Eyes on This Setup! 💹
The market has been respecting a trendline over the past few days, bouncing off support and climbing steadily. 🧗♂️ While doing so, it’s also been tapping into Fair Value Gaps (FVGs)—a clear sign of smart money interest. 📊
🔥 And guess what? We’ve just seen a breakout above the trendline resistance! This could be the beginning of a strong bullish move. BUT… patience is key! 🕰️
📉 Let the market pull back toward the marked FVG zone. If it does, that could give us a golden buy opportunity with high potential upside! 🚀
🧠 Always remember: Do Your Own Research (DYOR)
📛 Not Financial Advice – Trade Smart!

Bitcoin is Super Bullish Right Now - Here is my BTC trade planSince Bitcoin is super bullish on monthly and weekly time frame, my focus is to trade trend continuation pull backs on the 4HR time frame.
For this particular trade, I want to see a pull back to a key level of either imbalance or the old high serving as new support for price.
I will be taking a bullish trend continuation setup on that 4HR pull back.
Target:
I expect to see Bitcoin break that all time high of 111k level and go as high as 150k per one.
Litecoin Hits Key ResistanceFenzoFx—Litecoin took buy-side liquidity at the $91.02 resistance, aligning with monthly highs. A bearish FVG emerged, signaling selling pressure in Tokyo's session. The Stochastic Oscillator at 81.0 suggests a potential bearish wave.
A bearish trend may form if LTC stabilizes below $91.02, targeting $86.77. However, if Litecoin breaks above this level with a bullish engulfing candlestick, the bearish outlook is invalidated.

GBPJPY UPDATE!!Good day traders, I am back again with an update and this time it's on GBP/JPY. On the 1st of June I posted a setup but I mentioned that I will explain it later because I will be able to make my point clearer and easy to understand.
When this setup was posted I had that daily order block in mind, only because I needed to see it revisit the order block for the last time before price could make a run for that internal liquidity resting inside an unfilled FVG(BISI). We can also use that thought as confluence when looking for short term reversals or partial exits. Just by taking a look on the chart I posted again I will put it in the description below, you can see in the sell side of the chart we have a lot of equal lows and ICT teaches us that price looks for relative lows/equal lows and old lows.
On the daily TF price is currently inside a bearish order block and what we do not wanna see is price going over the wick of that wick of a candle that was booked on the 29th of May. We are also inside the premium zone of the wick meaning we can expect to run from there to our objectives below. As always my first objective is always the internal liquidity and that is only because that internal liquidity are my LTF | Highs/Lows.
On the 4H price is inside a balanced price range again that's in my favour meaning I have to note it. ICT teaches that we always wanna trade towards the direction where all our PD arrays are lining up and in this case, it's in the sellside, I believe we are in the starting phase of ICT's sell model.
My name is Teboho Matla but you...you don't know me yet!!

NQ tumbles?Good day traders, I don't know why but I get a bit scared when it comes to analyzing NQ. I always doubt myself with it.
On the weekly TF price is trading inside an order block and for the past two weeks price has visited the order block two times. In the two times that price revisited the order block it failed to close above the midpoint indicating the strength of the order block, going into the new week I am going to use the discount zone of the OB+ as my resistance.
On the daily TF before I say much, THERE IS A GAP, and price did not trade to it since opening high on the 12th May. That gap is my target and I want to see price go and fill that volume imbalance as ICT calls it.
Still on the daily TF...when you read price for past two weeks on NQ, you'll quickly come to a realization that price has been expanding higher since Tuesday 3rd June, but expanding to where?...well liquidity resting above the high of the candle booked on the 29th of May.
Now on the 4 hour TF things are opening up and price is becoming clearer and it goes to show the importance of multi time frame analysis. The lows of Tuesday and Thursday make the relative equal lows that are shown on the chart. The internal liquidity shown below is my short term target or TP1. The red triangle represents that 4H inverse FVG and once price is trading below the inverse any movement inside that inverse should show weakness!

Bitcoin plummets!!Good day traders, I am back with yet another update on BTC/USD. My last update on bitcoin what I was expecting price to do unfortunately did not happen as price was very weak, I had a FVG(SIBI) that I really wanted price to revisit and the two price levels that make up the SIBI are 107752 and 107149.
Now that both our sellside liquidity were taken does that mean price is now gonna look for the buyside liquidity? My honest opinion is I don't think because I said 97k is insight and I believe it can still happen and it will according to my HTF perspective.
On the daily TF we have clear sight of relative highs that we wanna see price take and that might happen today but my short term objective is the high that was booked on Tuesday. That Tuesday's candlestick has a very large wick and from my time learning with ICT's content, wicks contain a lot of price data that can be used either for entries or exits.
4H- Here we had a shift in market structure lower on Thursday but price has been bullish ever since the shift happened. On this respective TF we have equal highs too, and ICT teaches us to always focus our attention on them mainly because price looks for liquidity and imbalances on the 4 hour TF...should we look closely on the left of our screens or chart, there is an order block from the wick I mentioned above. Again what are the rules of an order block?..
FROM TOMORROW PRICE WILL START TO PLUMMET!!
