US30 - Intraday Playbook for NY Session 27/10/2025Here’s my structured 15M game plan heading into the US session today. We’re currently sitting inside a bullish trend, but we’re also at a point where price could either continue higher or shift momentum if key demand levels fail. So I’m prepared for both bullish continuation and a possible bearish reversal scenario.
✅ Overall Trend Context:
Higher highs / higher lows remain intact on the 4H / 1H.
Recent bullish leg may need a liquidity sweep / pullback before continuation.
Key intraday structure levels are now clearly defined.
📈 Bullish Continuation Scenario (Primary Bias)
I’ll look for long setups if price pulls back into demand zones and shows bullish rejection.
⚠️ Valid only while price holds above 47,200.
✅ Long Zone #1: 47,300 – 47,350 (first demand / shallow pullback zone)
✅ Long Zone #2: 47,150 – 47,200 (deeper liquidity pool)
Bullish Confirmation Triggers (15M or 5M):
Rejection wick from demand
Bullish engulfing / candle flip
Break of minor 5M structure after tap
🎯 Bullish Targets:
TP1: 47,450 (reaction zone)
TP2: 47,500 – previous high
TP3: 47,600+ if momentum extends
📉 Bearish Reversal Scenario (Alternate Plan)
I will only shift bearish if price breaks below the key higher-low level.
🔻 Bearish bias becomes active if we break & hold below 47,200.
✅ Plan: Wait for a break → retest of 47,200 – 47,250 as resistance → look for rejection
(5M / 15M bearish engulfing, failed reclaim, or lower high confirmation)
🎯 Bearish Targets:
TP1: 47,050 – first liquidity pocket
TP2: 46,900 – prior swing low / demand zone
TP3: 46,750 – deeper structural support
📍 Key Notes
✅ I won’t chase anything at market open — I’ll wait for liquidity grab and confirmation.
❌ No longs if 47,200 breaks decisively and turns into resistance.
❌ No shorts while above 47,200 unless a clear fakeout rejection occurs at 47,500.
Indextrading

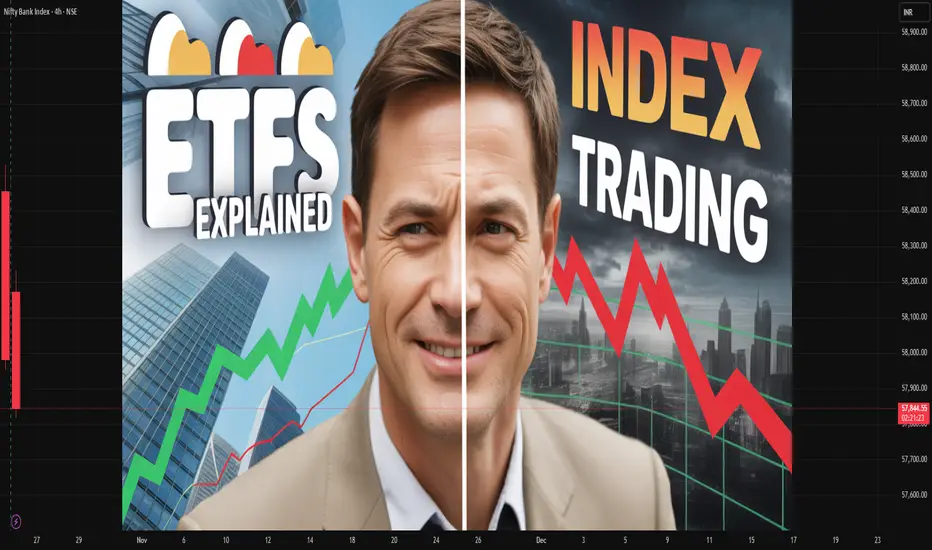
ETFs vs Index TradingIntroduction
The financial markets offer a wide range of instruments that cater to investors of varying risk appetites, time horizons, and objectives. Among these, Exchange-Traded Funds (ETFs) and Index Trading stand out as two of the most popular methods for gaining diversified exposure to markets. While both allow investors to benefit from broad market movements rather than focusing on individual stocks, they differ in structure, flexibility, trading mechanism, cost, and strategic use. Understanding the distinctions between ETFs and index trading is essential for investors aiming to optimize returns while managing risk efficiently.
1. Understanding ETFs
Definition and Structure
An Exchange-Traded Fund (ETF) is a type of pooled investment vehicle that holds a basket of securities — such as stocks, bonds, commodities, or currencies — and is traded on an exchange like a stock. ETFs are designed to track the performance of an underlying index, such as the S&P 500, Nifty 50, or NASDAQ-100, but can also be actively managed in some cases.
Each ETF is composed of shares that represent proportional ownership in the underlying assets. Investors buy and sell ETF shares throughout the trading day at market prices, similar to how they trade stocks. The creation and redemption mechanism, involving authorized participants, helps maintain the ETF’s price close to its Net Asset Value (NAV).
Types of ETFs
Index ETFs – Track a specific market index (e.g., SPDR S&P 500 ETF).
Sector ETFs – Focus on specific industries (e.g., technology, healthcare, energy).
Bond ETFs – Invest in government, corporate, or municipal bonds.
Commodity ETFs – Provide exposure to commodities like gold, silver, or oil.
International ETFs – Offer access to global markets or specific regions.
Thematic ETFs – Focus on trends like renewable energy or artificial intelligence.
Leveraged & Inverse ETFs – Designed for short-term traders seeking amplified or inverse returns.
How ETFs Work
ETFs are managed by fund companies that assemble the basket of assets mirroring an index. When large institutions (authorized participants) buy or redeem ETF shares, they exchange them for the underlying basket of securities. This creation/redemption process ensures liquidity and price alignment with the index.
Investors can hold ETFs in brokerage accounts and trade them intraday. The price fluctuates throughout the day based on supply and demand, unlike mutual funds, which can only be traded at end-of-day NAV.
2. Understanding Index Trading
Definition and Concept
Index trading involves speculating on the price movements of a stock market index such as the Dow Jones Industrial Average (DJIA), S&P 500, FTSE 100, or Nifty 50. Investors do not own the individual stocks within the index but trade based on the overall direction of the index’s value.
Unlike ETFs, which represent ownership in a basket of assets, index trading is generally executed through derivatives such as futures, options, contracts for difference (CFDs), or index funds. The main objective is to profit from market movements — either upward or downward — without holding the physical assets.
Forms of Index Trading
Index Futures – Standardized contracts to buy or sell an index at a predetermined price on a future date.
Index Options – Provide the right (but not obligation) to trade the index at a specific strike price.
CFDs (Contracts for Difference) – Enable traders to speculate on index price changes without owning the underlying assets.
Index Funds – Mutual funds designed to replicate the performance of a specific index (though less flexible than ETFs).
Mechanics of Index Trading
Index traders focus on price charts, technical indicators, and macroeconomic data to forecast market direction. Because indices aggregate the performance of many companies, they offer a snapshot of overall market health. Traders use leverage in futures or CFDs to magnify potential gains — but also risk.
For example, when trading Nifty 50 Futures, a trader is betting on whether the Nifty index will rise or fall by the expiry date. This allows both hedging and speculative strategies.
3. Advantages of ETFs
1. Diversification
ETFs provide instant diversification across a large number of securities. For example, an S&P 500 ETF gives exposure to 500 of the largest U.S. companies, reducing single-stock risk.
2. Cost Efficiency
Most ETFs have low expense ratios compared to mutual funds, as they are passively managed.
3. Liquidity and Flexibility
ETFs can be bought or sold at any time during market hours, offering real-time trading flexibility.
4. Transparency
Holdings are disclosed daily, unlike mutual funds, which reveal their portfolios quarterly.
5. Dividend Income
Equity ETFs often pay dividends from the underlying stocks, which can be reinvested.
6. Tax Efficiency
Because ETFs use an in-kind creation/redemption process, they generally generate fewer taxable events than mutual funds.
4. Advantages of Index Trading
1. High Leverage
Traders can control large positions with small capital outlay, increasing potential returns.
2. Short-Selling Capability
Index derivatives allow traders to profit from falling markets — a feature not typically available with ETFs unless inverse ETFs are used.
3. Hedging Opportunities
Institutional investors use index futures and options to hedge portfolios against market risk.
4. 24-Hour Market Access
Major index futures (like S&P 500, NASDAQ, or FTSE) trade almost round the clock, allowing participation across global time zones.
5. Quick Market Exposure
Traders can gain exposure to the entire market efficiently without buying individual stocks.
5. Risks Involved
ETFs:
Tracking Error – ETF performance may slightly deviate from the underlying index due to fees or imperfect replication.
Liquidity Risk – Niche or thinly traded ETFs may experience wider spreads.
Market Risk – ETFs still carry the same risk as their underlying assets.
Currency Risk – For global ETFs, exchange rate fluctuations can affect returns.
Management Risk – Active ETFs depend on manager skill for performance.
Index Trading:
Leverage Risk – Amplifies both gains and losses.
Market Volatility – Indices can fluctuate rapidly due to macroeconomic or geopolitical events.
Margin Calls – Traders must maintain margin levels; otherwise, positions may be liquidated.
Timing Risk – Short-term trades can be affected by sudden market reversals.
Complexity – Requires understanding of derivatives, rollovers, and expiration dates.
6. Strategic Use Cases
When to Choose ETFs
Long-term investors seeking diversified exposure to markets.
Passive investors focused on wealth building.
Those preferring simplicity and low costs.
Investors who want dividend income.
Retirement portfolios and systematic investment plans (SIPs).
When to Choose Index Trading
Short-term or swing traders seeking profit from volatility.
Institutions looking to hedge market risk.
Traders comfortable with technical analysis and leverage.
Professionals managing derivatives portfolios.
Speculators expecting directional market moves.
7. Cost and Tax Comparison
ETFs:
Costs: Management fees (expense ratios), brokerage commission, and bid-ask spread.
Taxation: In India, equity ETFs held for over a year attract long-term capital gains tax (LTCG) at 10% above ₹1 lakh; short-term gains are taxed at 15%.
Index Trading:
Costs: Margin requirement, overnight rollover charges (for CFDs), exchange fees, and broker commissions.
Taxation: Profits from futures and options are treated as business income and taxed at slab rates. Losses can be carried forward for set-off.
8. Performance and Historical Context
Historically, ETFs have enabled retail investors to participate in market growth efficiently. For instance, the SPDR S&P 500 ETF (SPY), launched in 1993, has become one of the largest funds globally, offering consistent performance in line with the U.S. equity market.
On the other hand, index trading through derivatives has empowered traders to hedge risk and exploit volatility. The launch of index futures, such as Nifty Futures in India, significantly improved market depth and price discovery.
Both instruments have played critical roles in enhancing market efficiency and liquidity.
9. Global and Indian Market Perspective
Global Context
In developed markets like the U.S. and Europe, ETFs dominate retail and institutional portfolios due to low fees and easy access. Global ETF assets surpassed $10 trillion in 2023, driven by the rise of passive investing.
Indian Context
In India, ETFs have gained popularity through platforms like Nippon India ETF Nifty BeES, ICICI Prudential Nifty Next 50 ETF, and SBI ETF Sensex. Meanwhile, index trading through Nifty and Bank Nifty futures and options remains the backbone of India’s derivatives market, attracting massive daily volumes.
10. Future Trends
Thematic ETFs – Growing interest in innovation, AI, green energy, and digital assets.
Smart Beta ETFs – Combining passive and active strategies using factors like value or momentum.
ESG Indexes – Environmentally and socially conscious index products.
Algorithmic Index Trading – Automated strategies enhancing efficiency and reducing emotional bias.
Global Integration – Increasing cross-border ETF listings and index-linked products.
Conclusion
Both ETFs and index trading represent powerful tools for market participation — yet they serve different investor profiles.
ETFs suit long-term, passive investors who value diversification, stability, and simplicity.
Index trading, on the other hand, caters to active traders and professionals aiming to profit from short-term volatility or hedge risk using leverage.
The choice between ETFs and index trading depends on investment goals, time horizon, risk tolerance, and expertise. When used wisely, both can play complementary roles — ETFs for building wealth steadily, and index trading for tactical opportunities and portfolio protection.
In an evolving global financial ecosystem, understanding the nuances between these two approaches empowers investors to navigate markets more effectively, balance risk, and pursue consistent returns in both bullish and bearish environments.
SPX500 | HULL MA & Fibo Confluence Setting Up the Move!🎯 SPX500: The "Polite Thief" Strategy - Stealing Profits Like a Gentleman 🎩💰
📊 Market Overview
Asset: SPX500 (S&P 500 Index CFD)
Trade Type: Swing/Day Trade Opportunity
Bias: Bullish 🐂
Strategy Style: Multi-Layer Entry (The "Thief Method")
🔍 Technical Setup
The Plan: We're eyeing a bullish confirmation with a clean retest/pullback at the 38.2% Fibonacci level, aligned beautifully with our HULL Moving Average. This confluence zone is screaming "buy the dip" louder than your portfolio manager at a market crash! 📈
🎯 Entry Strategy Options:
Option 1: The "Polite Thief" Multi-Layer Approach
Instead of going all-in like it's a Vegas buffet, we're using calculated limit orders:
📍 Layer 1: 6620
📍 Layer 2: 6640
📍 Layer 3: 6660
📍 Layer 4: 6680
Feel free to add more layers based on your account size and risk appetite!
Option 2: Market Execution
Jump in at any current price level if the setup confirms during live hours.
🛡️ Risk Management
Stop Loss: 6580
⚠️ Disclaimer: Dear Ladies & Gentlemen (Thief OG's), this is MY stop loss based on MY analysis. You're the captain of your own ship! 🚢 Set your risk parameters according to YOUR comfort level and account size. Risk management is YOUR responsibility.
💎 Profit Target
Target Zone: 6860
This level represents our "Electric Shock Wall" 🔌⚡ - a confluence of:
Strong historical resistance
Overbought territory potential
Bull trap zone (where late entries get caught)
Exit Strategy Note: I'm not your financial advisor! 💼 When you see green, secure those gains at YOUR discretion. The market doesn't care about our targets - take profit when YOU feel comfortable!
🌐 Related Pairs to Watch
Keep your eyes on these correlated instruments:
📈 AMEX:SPY (S&P 500 ETF) - Moves in lockstep with SPX500; watch for volume confirmation
📈 NASDAQ:QQQ (Nasdaq-100 ETF) - Tech-heavy index; bullish momentum here supports SPX strength
📈 AMEX:DIA (Dow Jones ETF) - Broader market sentiment indicator
📈 TVC:VIX (Volatility Index) - Inverse correlation; falling VIX = bullish for equities
💵 TVC:DXY (US Dollar Index) - Typically inverse to equities; weakening dollar supports stocks
Key Correlation: When tech leads (QQQ pumping), SPX usually follows. Watch for VIX to stay subdued below 15 for sustained bullish momentum.
📝 Key Technical Points
✅ 38.2% Fibonacci retracement acting as dynamic support
✅ HULL Moving Average confluence strengthens the setup
✅ Multi-layer entry reduces average cost and timing risk
✅ Clear risk/reward structure with defined zones
✅ Resistance zone identified for disciplined exits
⚡ The "Thief Strategy" Philosophy
We're not robbing the market - we're borrowing profits with permission! 😉 The layered entry approach allows us to build positions like a professional, not gamble like a reckless amateur. Scale in, scale out, and live to trade another day!
✨ If you find value in my analysis, a 👍 and 🚀 boost is much appreciated — it helps me share more setups with the community!
⚠️ Final Disclaimer
IMPORTANT: This "Thief Style" trading strategy is for educational and entertainment purposes only! 🎪 This is NOT financial advice. I'm sharing my personal analysis and trade ideas - what you do with your money is 100% YOUR decision. Trade at your own risk, manage your own capital, and never risk more than you can afford to lose. Past performance doesn't guarantee future results. Always do your own research! 🔍
#SPX500 #SP500 #TradingIdeas #SwingTrading #DayTrading #TechnicalAnalysis #FibonacciRetracement #SupportAndResistance #RiskManagement #TradingStrategy #StockMarket #IndexTrading #ThiefStrategy #LayeredEntry #PriceAction #MarketAnalysis #TradingCommunity #ChartAnalysis

Future Trends in Global Index Trading1. Expansion of Thematic and Sector-Based Indices
Traditional indices like the S&P 500 or FTSE 100 are giving way to thematic indices that focus on specific industries or megatrends such as artificial intelligence, green energy, cybersecurity, biotechnology, and space technology.
Investors are increasingly allocating capital toward sectors that align with technological innovation or sustainability goals. This evolution will diversify index offerings and allow traders to gain exposure to cutting-edge sectors without needing to pick individual stocks.
For example, ESG and renewable energy indices are expected to attract major institutional inflows as global decarbonization policies intensify. Similarly, AI-focused indices will become a major attraction as machine learning reshapes corporate productivity.
2. Rise of AI and Algorithmic Trading in Index Management
Artificial Intelligence (AI) and algorithmic models are transforming index trading by enhancing speed, accuracy, and decision-making.
Advanced algorithms analyze massive data sets in real time, predicting market sentiment, volatility, and correlations between global indices. These tools enable traders to rebalance portfolios instantly and exploit arbitrage opportunities.
In the future, AI-driven “smart indices” could automatically adjust their weightings based on macroeconomic conditions, geopolitical risk, or investor sentiment — creating dynamic, self-optimizing benchmarks rather than static ones.
3. Increased Popularity of Passive Investing and ETFs
Over the past decade, passive index funds and exchange-traded funds (ETFs) have outperformed most active managers. This trend will continue as investors seek low-cost, diversified exposure to global markets.
Global ETF assets are projected to surpass $20 trillion by 2030, largely fueled by index-linked strategies. As more retail and institutional investors favor passive investing, liquidity in major indices like the MSCI World, NASDAQ-100, and Nifty 50 will deepen.
Moreover, fractional and automated ETF investing platforms will make index exposure more accessible, further democratizing global market participation.
4. Integration of ESG (Environmental, Social, and Governance) Criteria
Sustainability will be one of the defining features of future global index construction. Regulators and investors alike are demanding transparency, ethical governance, and environmental accountability.
ESG indices will not only track performance but also quantify corporate sustainability using measurable metrics such as carbon footprint, social equity, and board diversity.
In the next decade, “green indices” may become a mainstream benchmark, influencing capital allocation toward responsible corporations. Investors will increasingly use carbon-adjusted indices or climate risk-weighted indices to mitigate environmental exposure.
5. Real-Time Global Connectivity and 24/7 Trading
With technology reducing barriers between global markets, the concept of 24/7 trading across indices is becoming a reality.
Cryptocurrency markets already operate continuously, setting the precedent for traditional markets to follow. Index futures and global ETFs may soon be traded around the clock, allowing traders to react instantly to geopolitical or economic developments in any region.
Enhanced inter-market connectivity among exchanges in Asia, Europe, and North America will ensure smoother liquidity flow and minimize regional trading gaps.
6. Blockchain and Tokenization of Indices
Blockchain technology will revolutionize how indices are built, traded, and settled. Through tokenization, entire indices could be represented as digital tokens, allowing investors to buy fractional shares of global market indices seamlessly.
This innovation will make global index trading more transparent, secure, and accessible, particularly for retail investors.
Smart contracts could automate dividend distribution, rebalancing, and settlement, while decentralized finance (DeFi) platforms may introduce index-backed synthetic assets, enabling trading beyond traditional market hours.
The fusion of blockchain and finance will create a borderless, low-cost trading environment.
7. Customizable and Personalized Index Products
Investors of the future will demand customized indices that align with their personal risk tolerance, ethical values, or investment objectives.
Through AI-based portfolio construction, traders could create personal indices tracking specific sets of companies, sectors, or regions — effectively blending active and passive investing.
Robo-advisors and fintech platforms are already offering custom index portfolios that automatically rebalance based on user preferences, risk profiles, or global market movements.
This personalization trend will redefine how investors interact with global indices, making index trading both dynamic and individual-centric.
8. Data-Driven Trading and Predictive Analytics
The future of global index trading will rely heavily on big data, alternative data, and predictive analytics.
Beyond financial metrics, traders will analyze satellite imagery, shipping data, internet traffic, and sentiment analysis from social media to anticipate index trends.
Predictive models powered by machine learning will improve timing, reduce drawdowns, and identify early signals of macroeconomic shifts.
For example, sentiment data from millions of online sources could forecast the next market correction or bull run before it appears in traditional indicators.
Data-driven decision-making will become the cornerstone of competitive index trading.
9. Geopolitical and Economic Diversification
Global index traders must increasingly account for geopolitical risk, trade tensions, and currency fluctuations.
The rise of regional economic blocs — such as BRICS expansion, Asian market integration, and European green reforms — will lead to new regional index compositions.
Diversification across multiple regions will become essential to hedge against localized shocks like war, inflation, or policy shifts.
Future indices will incorporate multi-currency and multi-region components, helping investors reduce exposure to any single market’s volatility.
This diversification will also open opportunities for cross-border arbitrage and currency-hedged index products.
10. Regulatory Evolution and Market Transparency
As global index trading expands, regulatory oversight will strengthen. Authorities such as SEBI, SEC, and ESMA are developing frameworks to ensure data integrity, transparency, and investor protection in index creation and trading.
Future regulations will likely require disclosure of index methodologies, weighting criteria, and data sources, ensuring fairness and accountability.
Moreover, with the rise of AI and algorithmic trading, governments will impose ethical and operational standards to prevent manipulation and systemic risk.
Enhanced transparency will foster trust, attract more institutional participation, and create a stable global trading ecosystem.
Conclusion
The future of global index trading will be defined by technology-driven transformation, investor empowerment, and sustainable innovation.
AI, blockchain, ESG integration, and data analytics will reshape how indices are constructed, traded, and understood. The line between active and passive investing will blur as markets evolve toward automation, customization, and inclusivity.
As global economies become more interconnected, traders who embrace these trends — combining digital intelligence with strategic diversification — will thrive in the next generation of financial markets.

Index Futures & Options1. Introduction to Index Derivatives
Financial markets thrive on two main goals: wealth creation and risk management. Investors, traders, and institutions constantly look for tools that can help them protect against uncertainties or magnify profits. One such set of tools are derivatives, financial contracts whose value is derived from an underlying asset such as stocks, commodities, currencies, or indices.
Within the derivatives universe, Index Futures and Options are among the most widely traded instruments globally. They are not based on a single stock but on a basket of stocks represented by a market index like the S&P 500 (US), Nifty 50 (India), FTSE 100 (UK), or Nikkei 225 (Japan).
Why indices? Because they reflect the overall performance of a market segment or economy, making them powerful tools for broad-based speculation, hedging, and arbitrage.
2. What are Index Futures?
An Index Future is a standardized derivative contract traded on an exchange where two parties agree to buy or sell the value of an index at a future date for a pre-agreed price.
Unlike stock futures, index futures do not involve delivery of actual shares since an index itself cannot be delivered. Instead, they are cash-settled contracts.
For example:
Suppose the Nifty 50 index is at 20,000 points today.
You buy one Nifty Futures contract expiring next month at 20,100 points.
If, on expiry, Nifty closes at 20,500, you make a profit of 400 points × lot size.
If it closes at 19,800, you incur a loss of 300 points × lot size.
Key Features of Index Futures:
Underlying: A stock market index.
Lot Size: Fixed by the exchange (e.g., 50 units for Nifty in India).
Cash Settlement: No delivery of shares, only the difference in value.
Margin Requirement: Traders must deposit initial and maintenance margins.
Leverage: Small capital controls large exposure.
3. Mechanics of Index Futures Trading
Steps Involved:
Select Index Future (e.g., Nifty, S&P 500).
Choose Expiry (monthly, weekly in some markets).
Place Buy/Sell Order on exchange.
Margin Blocked: Initial margin required (5–12% typically).
Mark-to-Market (MTM) Settlement: Daily profits/losses adjusted in trader’s account.
Expiry Settlement: Final cash settlement at index closing price.
Example:
Trader A buys Nifty Futures at 20,000.
Next day Nifty closes at 20,200.
Profit = 200 × 50 (lot size) = ₹10,000 credited to Trader A.
This daily settlement ensures default risk is minimal.
4. What are Index Options?
An Index Option is a derivative contract that gives the buyer the right (but not obligation) to buy or sell an index at a pre-decided strike price before or on a specified expiry date.
Like futures, index options are cash-settled since indices cannot be delivered physically.
Types of Index Options:
Call Option (CE) – Right to buy index at strike price.
Put Option (PE) – Right to sell index at strike price.
The seller (writer) of the option, however, has the obligation to fulfill the contract if the buyer exercises it.
5. Types of Index Options (Call & Put)
Let’s simplify with an example using Nifty 50:
Call Option Example:
Nifty = 20,000.
You buy a Call Option (CE) with Strike = 20,100 at Premium = 150.
On expiry, if Nifty = 20,400 → Intrinsic value = 300; Profit = 150 (after premium).
If Nifty < 20,100 → Option expires worthless; Loss = Premium (150).
Put Option Example:
Nifty = 20,000.
You buy a Put Option (PE) with Strike = 19,800 at Premium = 120.
On expiry, if Nifty = 19,400 → Intrinsic value = 400; Profit = 280 (after premium).
If Nifty > 19,800 → Option expires worthless; Loss = Premium (120).
6. Pricing & Valuation Concepts
Index futures and options pricing depends on multiple factors:
Futures Pricing (Cost of Carry Model):
Futures Price = Spot Price × (1 + r – d)^t
Where,
r = Risk-free interest rate
d = Expected dividend yield
t = Time to expiry
Option Pricing (Black-Scholes Model):
Key Inputs:
Spot Index Level
Strike Price
Time to Expiry
Volatility
Risk-free Rate
Dividends
Options’ premiums consist of:
Intrinsic Value = Difference between spot and strike.
Time Value = Premium paid for future uncertainty.
7. Key Strategies using Index Futures & Options
Futures Strategies:
Directional Trading:
Buy futures if bullish on market.
Sell futures if bearish.
Hedging:
Long-term investors sell index futures to hedge portfolio risk.
Arbitrage:
Exploit mispricing between futures and spot market.
Options Strategies:
Protective Put: Buy puts to protect long portfolio.
Covered Call: Sell call against index holdings to earn premium.
Straddle: Buy call + put at same strike → profit from high volatility.
Strangle: Buy OTM call + OTM put → cheaper than straddle.
Iron Condor: Combination of spreads → profit in low volatility.
8. Role in Hedging & Speculation
Hedging:
Institutional investors with large portfolios use index derivatives to offset market-wide risks. Example: A mutual fund holding 500 crores worth of stocks may sell Nifty futures to hedge against a market fall.
Speculation:
Traders with directional views use leverage in index futures/options to profit from short-term moves.
Portfolio Insurance:
Buying index puts acts as insurance during market downturns.
9. Advantages & Disadvantages
Advantages:
Efficient hedging tool.
High liquidity in major indices.
Cash settlement – no delivery hassle.
Lower cost compared to trading multiple individual stock options.
Good for expressing macro views.
Disadvantages:
Leverage magnifies losses.
Options can expire worthless.
Requires good understanding of pricing & volatility.
Market risks cannot be eliminated fully.
10. Risks & Challenges
Leverage Risk: Small move in index can wipe out margins.
Volatility Risk: Option buyers may lose premium if volatility drops.
Liquidity Risk: Smaller indices may have low volume.
Systemic Risk: Large index moves can create margin pressures across market.
11. Global Market Practices
US Markets: S&P 500 Futures & Options most traded globally (CME, CBOE).
India: Nifty 50, Bank Nifty dominate F&O segment (NSE).
Europe: FTSE, DAX index derivatives popular.
Asia: Nikkei 225, Hang Seng actively traded.
These instruments are also used by hedge funds, mutual funds, pension funds, and sovereign wealth funds to manage exposure.
12. Case Studies & Examples
2008 Financial Crisis:
Portfolio managers used index puts to hedge against market collapse.
Those without hedges faced catastrophic losses.
Indian Market Example:
During Budget announcements, traders use straddles/strangles on Nifty due to expected high volatility.
Global Funds:
US-based funds often use S&P 500 futures to hedge international equity exposure.
13. Conclusion
Index Futures & Options are powerful instruments that serve dual roles:
Risk Management (Hedging)
Profit Generation (Speculation & Arbitrage)
For institutions, they act as portfolio insurance. For traders, they provide opportunities to capitalize on short-term moves. However, they demand discipline, risk management, and understanding of market mechanics.
In a world where uncertainty is constant, index derivatives are no longer optional – they are essential for anyone engaged in serious investing or trading.
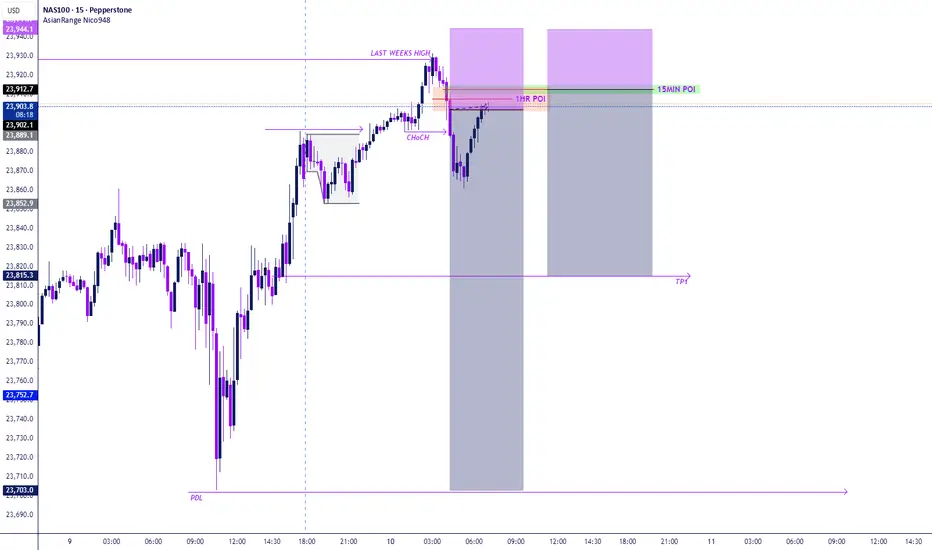
NAS100 – Liquidity Sweep & Short Setup (1H + 15M Scaling)After an aggressive bullish run, NAS100 swept last week’s high and immediately shifted structure (ChoCH).
This confirms external liquidity has been taken and market sentiment is turning bearish.
🔎 Trade Narrative
1. Liquidity Sweep → Last week’s high taken.
2. ChoCH → Order flow shifted bearish after sweep.
3. POIs in Play:
1H Supply Zone → First entry short (early exposure, confirmation).
15M Refined POI → Sell limit placed (precision scaling inside the 1H zone).
4. Target → Previous Day’s Low (PDL) as the next liquidity pool.
📐 Execution Plan
Entry 1: Short from 1H POI ✅
Entry 2: Sell limit at refined 15M POI ✅
Stop Loss: Above 1H supply sweep candle.
Take Profit: Previous Day’s Low (PDL).
Risk Management: Total risk capped at 1% across both entries.
🧠 Institutional Logic
Scaling entries across HTF + LTF zones provides:
Higher TF confirmation ✅
Lower TF precision ✅
Blended entry for better RR ✅
⚖️ Bias: Bearish
Targeting PDL unless price structure shifts bullish again.
Indexes Pull Back – Is This the Entry You Missed? | SPX500 & HK5Most major indexes like SPX500 and HK50 have retraced about 50% of their recent gains, giving a second chance to those who missed the previous leg up. In this episode, I break down key support zones and share simple, high-probability triggers—range breakouts, engulfing candles, and fakeouts—to spot momentum shifts. 🔍
📍Remember: follow the trend, manage your risk, and no shorting here as it goes against HWC/MWC bias.
( Educational content only , not financial advice. Comment your favorite ticker for future analysis.)

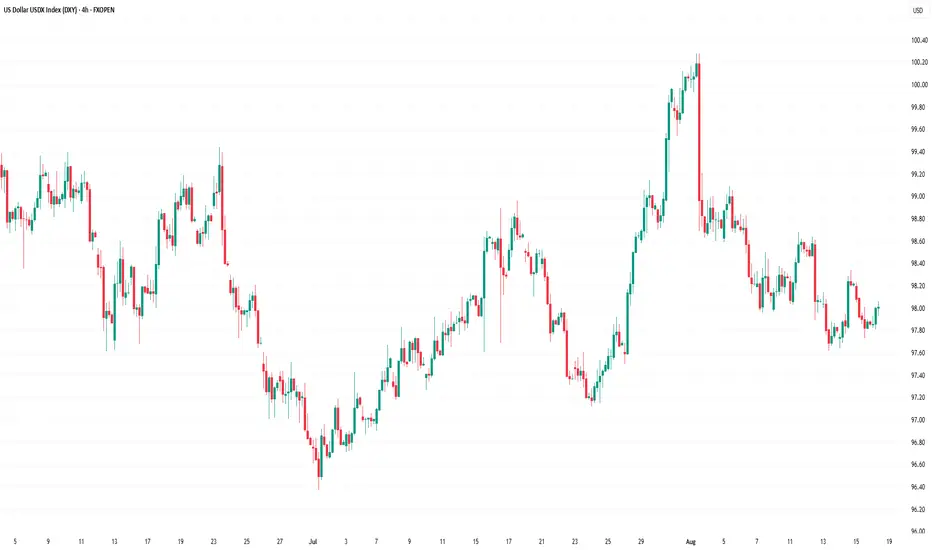
US Dollar Index (DXY) in Balance Ahead of Key EventsUS Dollar Index (DXY) in Balance Ahead of Key Events
In our previous analysis of the US Dollar Index (DXY), we:
→ outlined a descending channel (red) based on a sequence of lower highs and lows;
→ anticipated a move towards the median line of this channel.
As of 18 August, the DXY is trading around the median of the channel and is forming a contracting triangle pattern (blue). The RSI remains close to the neutral 50 level, indicating equilibrium between supply and demand.
This balance may be ruined given upcoming events:
→ Today, discussions at the White House between Donald Trump, Volodymyr Zelenskyy, and European leaders will focus on the conflict in Ukraine. The outcome may provide clarity following the Trump–Putin meeting on 15 August.
→ On Wednesday at 21:00 GMT+3, the FOMC minutes will be released. Markets will look for guidance on the likelihood of a September rate cut after last Thursday’s stronger-than-expected Producer Price Index (PPI) print, which some interpret as a signal of potential inflationary pressures from new trade tariffs.
Market participants should anticipate volatility, with price impulses possible in either direction.
The base scenario for the week is a test of one of the quarter lines (QL/QH) within the channel, consistent with the broader US dollar weakening trend in place since January 2025. A breakout of QL or QH line and sustained move away from the channel median would indicate a shift in sentiment and the potential for a directional move beyond the current structure.
This article represents the opinion of the Companies operating under the FXOpen brand only. It is not to be construed as an offer, solicitation, or recommendation with respect to products and services provided by the Companies operating under the FXOpen brand, nor is it to be considered financial advice.
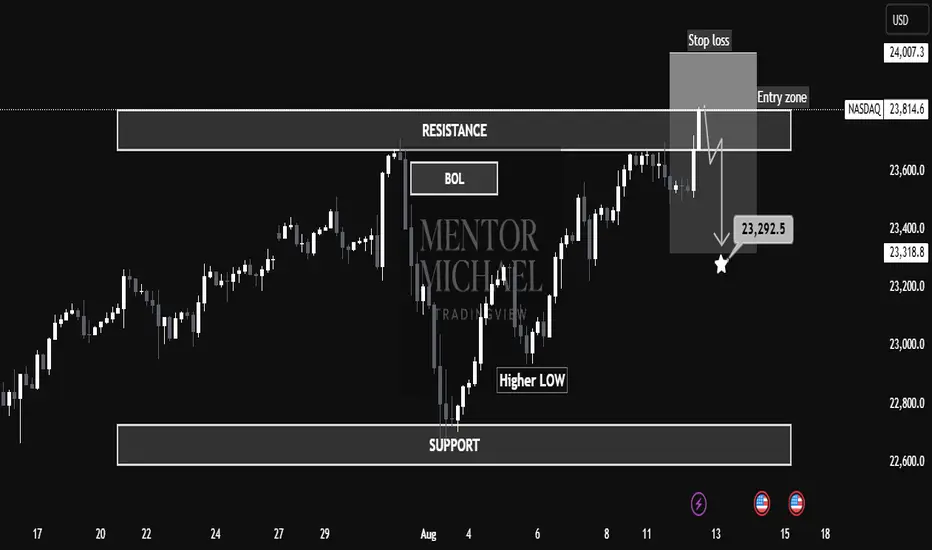
NASDAQ at Make-or-Break Resistance – Is a Sharp Drop to 23,292 "📉 NASDAQ at Make-or-Break Resistance – Is a Sharp Drop to 23,292 Next?"
📊 NASDAQ is currently trading within a well-defined resistance zone (23,812 – 24,007) after a recent rally from the support base near 22,800. The structure suggests a potential sell-side setup if price respects the resistance and fails to break higher.
🧐 Market Structure Analysis
Support Zone: Around 22,800, where buyers previously stepped in, forming a Higher Low and initiating the last bullish leg.
Resistance Zone: 23,812 – 24,007, marked by previous rejections and a Break of Liquidity (BOL).
Price has tapped into the entry zone just below resistance, hinting at possible exhaustion from buyers.
The chart indicates a bearish bias from this zone, aiming for a move toward 23,292.5 (marked target).
🎯 Educational Trade Example
Entry Zone: 23,812 – 24,007
Stop Loss: Above 24,007 to protect against breakout rallies.
Target: 23,292.5 (aligned with previous structural support).
Rationale:
Trading against strong resistance offers asymmetric R:R if momentum shifts bearish.
The Higher Low before resistance can act as liquidity fuel for sellers once demand weakens.
Clear invalidation point keeps risk defined.
⚠ Invalidation Scenarios
A strong breakout and close above 24,007 with follow-through volume would invalidate the short idea and potentially signal continuation toward 24,200+.
💡 Key Takeaways for Students
Zone-to-Zone Trading: Always define both entry and exit zones before execution.
Structure Before Strategy: The market’s reaction to resistance is the clue — confirmation comes before position sizing.
Risk Management is Non-Negotiable: Even high-probability setups require strict stop placement.
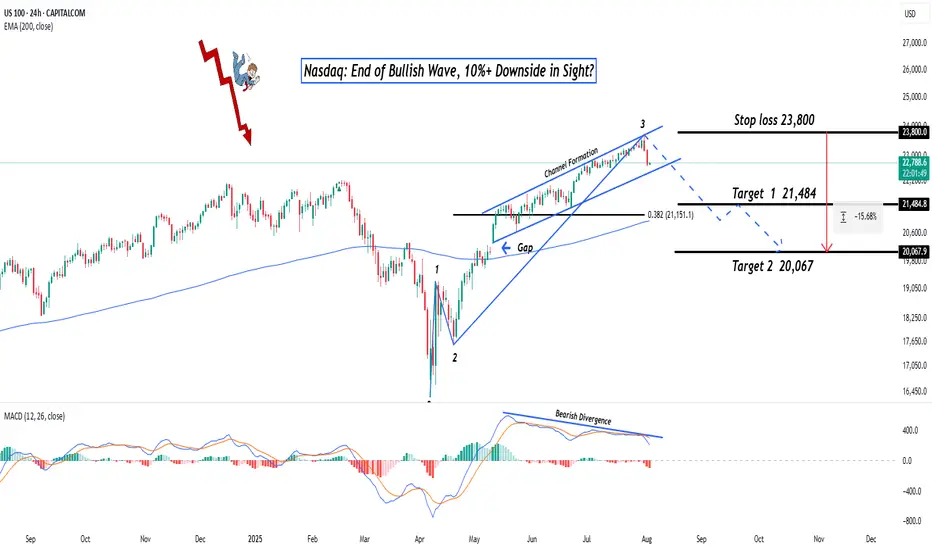
Nasdaq: End of Bullish Wave, 10%+ Downside in Sight?Hey Realistic Traders!
Has CAPITALCOM:US100 (Nasdaq) Finally Peaked? A Reversal Signal Just Flashed. Is This the Turning Point Toward a Deeper Pullback?
Let’s dive into the technicals to see what the chart is really telling us.
Technical Analysis
On the daily chart, the Nasdaq is starting to show signs of weakness. A bearish divergence has formed between the MACD and price movement , which is a classic signal that bullish momentum may be fading. This often indicates the potential for a trend reversal or a deeper correction.
A recent drop, confirmed by a strong bearish full-body candlestick, suggests that selling pressure is increasing. If this continues, we expect a breakdown from the current bullish channel.
In this scenario, the extended Wave 3 may have reached its peak. A correction could follow, with the first target at 21484, which lines up with the 0.382 Fibonacci retracement level. If the decline continues, the next downside target would be around 20067, where a previous gap may be filled.
This bearish outlook remains valid as long as the price stays below 23800 . A move above that level would invalidate the setup and return the outlook to neutral.
Support the channel by engaging with the content, using the rocket button, and sharing your opinions in the comments below.
Disclaimer: "Please note that this analysis is solely for educational purposes and should not be considered a recommendation to take a long or short position on Nasdaq.
US100 Index – Potential Bearish Reversal in Key Resistance Zone🧠 US100 Index – Potential Bearish Reversal in Key Resistance Zone
Timeframe: 30-Minute | Chart Published: July 24, 2025
---
🔍 Overview
The US100 (NASDAQ) has been trading in a well-structured ascending channel, forming higher highs and higher lows. However, recent price action suggests that the index is testing a critical supply zone near 23,400, with signs of weakening bullish momentum. This may signal a potential corrective phase or bearish reversal.
---
📈 Technical Analysis Breakdown
🔵 Trend Structure:
Price is respecting a clear ascending trendline (blue), connecting multiple higher lows.
Multiple bullish flag/channel formations have been completed within the uptrend, showing healthy momentum until the current point.
🟥 Resistance Zone:
Strong supply zone marked between 23,250 – 23,450.
Price action shows stalling candles and rejection wicks within this zone, indicating buyer exhaustion.
⚠ Bearish Patterns:
The red path projection suggests a head and shoulders-like structure forming at the top of the channel.
This, along with divergence in wave strength and shrinking momentum, supports a potential reversal.
🔵 Key Support:
First support lies around 23,000 — aligning with the ascending trendline and previous consolidation.
If broken, next demand zone is around 22,835 – 22,900, where historical consolidation took place.
---
🔁 Projected Scenario (as per visual path)
1. Price may attempt one last push into the 23,400–23,450 zone (possible false breakout).
2. Rejection from this level could trigger a fall toward the ascending trendline support.
3. A confirmed break of the trendline can lead to a larger correction toward the 22,800 zone.
---
🧠 Unique Insight
This chart combines multi-timeframe structure recognition with a real-time reversal formation inside a long-standing bullish trend. The analysis doesn’t just rely on textbook patterns—it recognizes real-time price behavior shifts, which makes it valuable for proactive traders.
---
📌 Conclusion
While the trend remains bullish overall, caution is warranted as the US100 approaches a historically significant resistance zone. The setup offers a compelling risk-reward short opportunity for aggressive traders, especially if the price confirms a break below trendline support.
---
🔧 Next Steps for Viewers
> “Watch for a clean rejection candle or lower high at resistance before entering short. If trendline breaks cleanly, 22,835 could be the next target zone.”

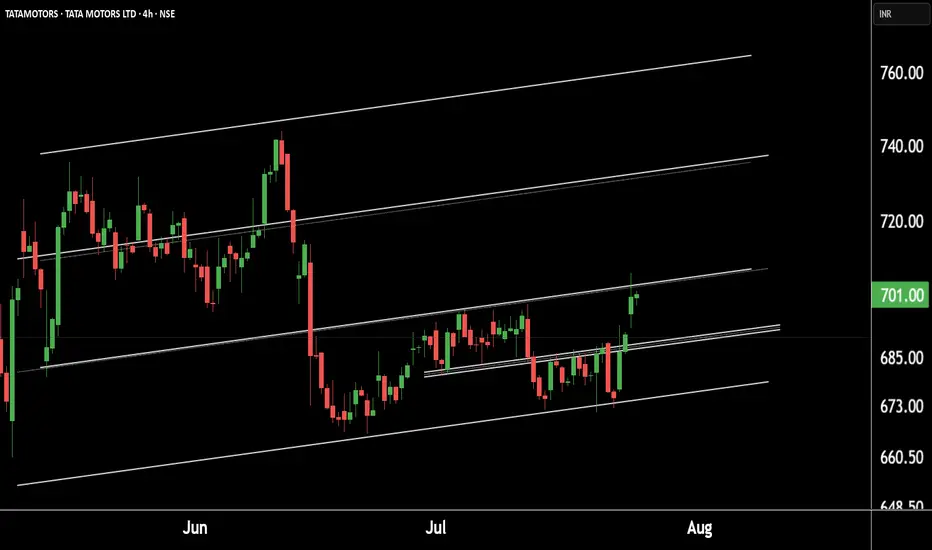
Tata Motors Gearing Up for a Fresh Rally! Technical Breakout !!This is the 4 hour chart of tata motor.
Tatamotor is moving in well defined parallel channel and bounced from it's supportt level near at 680, now ready for the breakout level at 705 .
If this level is sustain after the breakout then , we will see higher price in Tata motor.
Thank you !!
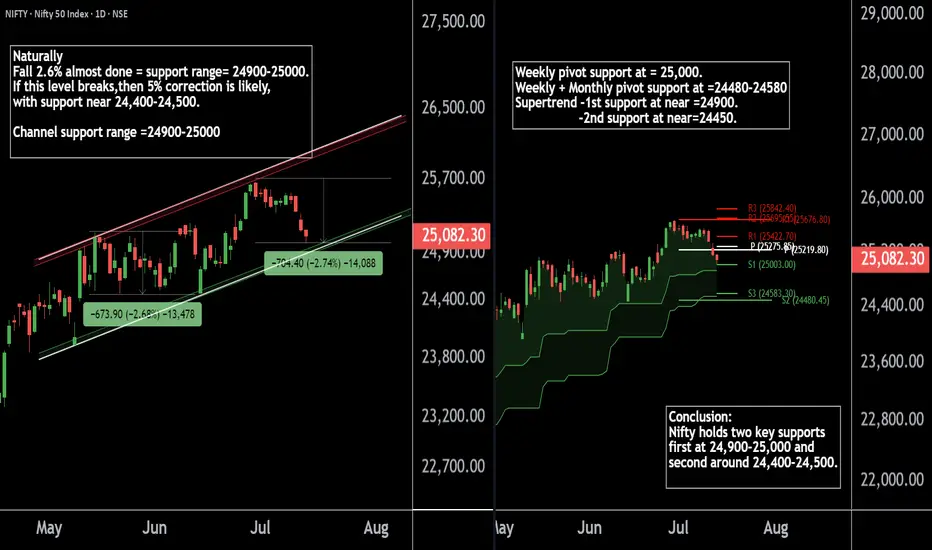
Nifty50's Key Level !! Keep an eye on these levels.Here are two Nifty charts, both on the daily timeframe.
Current Correction:
Nifty has naturally corrected by 2.7%, currently trading in the 24,900-25,000 range.
Weekly Pivot:
The weekly pivot support is positioned at 25,000, providing immediate support.
Support Levels:
First Support: 24,900-25,000 zone.
Second Support: If this level breaks, Nifty may see a 5% correction, with the next support around 24,400-24,500.
If this level sustain we may see higher prices in Nifty 50.
Thank You !!
Nasdaq - This starts the next +50% rally!Nasdaq - TVC:NDQ - might break out soon:
(click chart above to see the in depth analysis👆🏻)
Despite the quite harsh correction of about -25% which we saw in the beginning of 2025, the Nasdaq is clearly heading for new all time highs. It sounds almost incredible but if the Nasdaq breaks above the current confluence of resistance, a breakout rally of +50% will follow thereafter.
Levels to watch: $21.500, $33.000
Keep your long term vision!
Philip (BasicTrading)

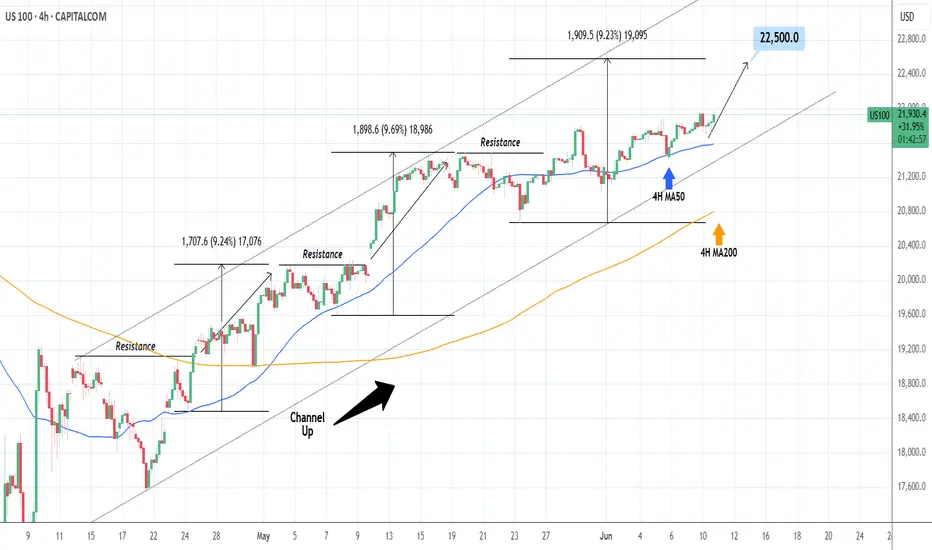
NASDAQ: Close to a strong bounce.Nasdaq is about to turn overbought on its 1D technical outlook (RSI = 68.736, MACD = 505.460, ADX = 18.046) as it is extending an uptrend since the 4H MA50 test/bounce. Such low paced price increase typically precedes strong breakouts. Since the long term pattern is a Channel Up, we are still on its 3rd bullish wave overall. The prior ones were +9.50% on avg, so we remain bullish on the short term, TP = 22,500.
## If you like our free content follow our profile to get more daily ideas. ##
## Comments and likes are greatly appreciated. ##
Nasdaq - The final bullrun breakout!Nasdaq - TVC:NDQ - might break above all structure:
(click chart above to see the in depth analysis👆🏻)
It is quite incredible how volatile stocks have been lately, especially considering that fact that the Nasdaq is about to create new all time highs again. Consequently, we are about to witness a significant structure breakout, which would ultimately lead to another rally of about +30%.
Levels to watch: $21.000
Keep your long term vision!
Philip (BasicTrading)

S&P500: Gearing up for a push to 6,100S&P500 is bullish on its 1D technical outlook (RSI = 64.611, MACD = 85.830, ADX = 19.630) as it has been trading inside a Channel Up for over a month. Right now it is halfway through the new bullish wave. We expect it to rise by at least +4.40%, same as the previous one. Stay bullish as long as the 4H MA50 holds, TP = 6,100.
## If you like our free content follow our profile to get more daily ideas. ##
## Comments and likes are greatly appreciated. ##

DOW JONES: Inverse Head and Shoulders looking for a breakout.Dow Jones is marginally bullish on its 1D technical outlook (RSI = 55.600, MACD = 267.860, ADX = 21.901) as just now it is attempting to be detached from the 4H MA50. Technically this could be the attempt to break towards the 2.0 Fibonacci extension, after having formed the RS of an Inverse head and Shoulders pattern. With the 4H MACD close to a Bullish Cross, we are bullish, TP = 44,250.
## If you like our free content follow our profile to get more daily ideas. ##
## Comments and likes are greatly appreciated. ##

"FR40 TIME-BOMB TRADE: PROFIT BEFORE THE CLOCK RUNS OUT!"🔥 FRANCE 40 HEIST: STEAL THE TREND LIKE A MARKET BANDIT! 🚨💰
Locked & loaded for the FR40 (FRANCE 40) heist? This slick blueprint cracks the code to loot profits—blending killer technicals with macro intel. Ride the bullish wave, but dodge traps near the Overbought Zone. Bears lurk, so secure your bag before the reversal hits! 🐻💨
🎯 ENTRY: STRIKE LIKE A PRO THIEF
Long the breakout near 7900.0 (or) ambush pullbacks at 7620.0 or above.
Set stealth alerts to catch moves in real-time. 🕶️🔔
🛡️ STOP LOSS: ESCAPE ALIVE
Hide stops under the last 4H swing low/wick—no reckless bets!
Adjust for your risk—survivors play smart. ⚡
💸 TAKE PROFIT: VANISH WITH THE LOOT
Main Target: 8150.0 (or bail early if momentum fades).
Scalpers: Trail stops & ghost out with quick wins. 🏃♂️💨
📡 WHY THIS HEIST WORKS
FRANCE 40's on fire: Fundamentals + COT data + macro tides align.
Sentiment’s bullish, but stay sharp—links below for the full intel. 🔍🌐
⚠️ WARNING: NEWS = POLICE SIRENS
Avoid new trades during high-impact news. 📢
Lock profits with trailing stops if you’re already in. 🔐
🤝 JOIN THE TRADING MAFIA
Smash LIKE, drop a comment, & let’s dominate the US100! �
Ready for the next big move? Stay tuned. 👀
Happy hunting, chart pirates! 🏴☠️📉

S&P500: Inverse Head and Shoulders set to extend Apr-May rally.The S&P500 is bullish on its 1D technical outlook (RSI = 58.868, MACD = 85.480, ADX = 31.901) as it maintains a steady Channel Up pattern and just formed the first 1H Golden Cross in a month. Technically this is forming the Right Shoulder of an Inverse Head and Shoulders pattern, typically a bullish reversal formation, which not surprisingly was last seen in April when the Channel Up started and was completed with the previous 1H Golden Cross on April 24th. The result was a bullish extension fo rht 1.618 Fibonacci level. We're bullish on this, TP = 6,150.
## If you like our free content follow our profile to get more daily ideas. ##
## Comments and likes are greatly appreciated. ##

"UK100 Grand Heist: Bullish Loot Plan with Thief Trading Style!🌍 Hello, Global Wealth Warriors! Ciao, Salut, Guten Tag, Ola! 🌟
Fellow Profit Pirates & Market Mavericks, 💸⚡
Unveiling our cunning blueprint to plunder the "UK100/FTSE100" Index Market, crafted with 🔥Thief Trading’s razor-sharp technical and fundamental insights🔥. Stick to the chart’s game plan, zoned in on a long entry. Our mission? Slip out near the high-stakes ATR Zone Level—a perilous spot with overbought vibes, consolidation, trend flips, and traps where bearish bandits lurk. 🏴☠️💰 Celebrate your wins, traders—you’ve earned it! 🎉
📈 **Entry Point**: The vault’s unlocked! Grab the bullish bounty at current prices—the heist is live!
💡 Pro Tip: Set buy limit orders on a 15 or 30-minute timeframe, targeting recent or swing lows/highs. Don’t forget to set chart alerts for precision! 🚨
🛑 **Stop Loss**:
📍 Thief SL parked at the recent/swing low on the 4H timeframe (8500.0) for day/swing trades.
📍 Tailor your SL to your risk appetite, lot size, and number of orders. Stay sharp!
🎯 **Target**: Aim for 8850.0 or make a swift exit just before.
👀 **Scalpers, Listen Up**: Stick to long-side scalping. Got deep pockets? Dive in now! Otherwise, join swing traders for the grand heist. Use trailing SL to shield your loot. 💰
💹 **Market Pulse**: The UK100/FTSE100 is in a neutral zone but leaning bullish, fueled by key drivers. ☝
🌐 Dive into fundamentals—macro economics, COT reports, geopolitical updates, sentiment, intermarket analysis, and index-specific trends. Check the linkss for the full scoop! 🔗🌍
⚠️ **Trading Alert**: News can shake the market! 📰
🔐 Protect your positions:
- Pause new trades during news releases.
- Use trailing stop-loss to lock in gains.
💪 **Join the Heist**: Smash the Boost Button to supercharge our robbery squad! 💥 With Thief Trading Style, we rake in profits daily with ease. 🚀 Your support fuels our market conquests. 🤝❤️
Stay tuned for the next daring heist, money makers! 🤑🐱👤🎯

US30 Locked & Loaded – Get In, Get Profit, Get Out!**💰 Market Heist Alert: US30 Setup 🔥**
Yo Money Raiders & Chart Bandits! 🏴☠️📈
US30 is ripe for the taking, and we’re rollin’ in with the *Thief Trading Style*—a slick mix of sniper-level technicals and street-smart fundamentals. Whether it’s bull or bear, we strike fast, grab profit, and vanish! 💨💸
---
**🧠 The Blueprint – US30 Hit Plan**
**📍 Entry Zones:**
🔹 **Bullish Strike 1**: Look for a pullback and **buy at 42400** – clean signal to enter the action!
🔹 **Bullish Strike 2**: Set your sights on **40900 - 40800**, inside the Institutional Buy Zone. Wait for an MA pullback, then hit it hard. Fortune favors the bold! ⚔️
🔹 **Bearish Ambush**: If price breaks down below **41600**, it’s time to ride that bear wave 🐻💨
💡 **Pro Bandit Tip**: Set alerts on key levels so you never miss the moment! 🔔
---
**🛑 Stop Loss Defense:**
Protect the stash! Use the **nearest 4H low** as your SL for day/swing trades.
Tweak based on your risk level, lot size, and open positions. 🛡️
---
**🎯 Profit Targets – Take the Loot:**
💥 **Bullish Goal**: Lock in at **44200** – or escape early if momentum cools 😎
💥 **Bearish Goal**: Target **40600** – but don’t overstay if signs reverse 🚪
🚨 Watch out for overbought/oversold traps – this is where many fall.
---
**⚠️ Risk Alert – News Incoming!**
News events = wild moves. Handle with care:
📰 Avoid new entries during major news drops
📉 Use **trailing SL** to secure profits and manage risk like a pro
Stay smart. Stay ready. This is a heist, not a gamble! 💼💣
---
**🚀 Boost the Thief Trading Movement!**
If this setup hits your style, smash that **boost** and show love to the Thief Crew! 💪
We raid charts daily with precision, profit, and a bit of outlaw swagger. Let’s own the US30 together! 🤝💵
Stay sharp, alerts on, and eyes wide—more setups coming soon.
Catch you in the green, bandits! 🤑🎉📊

S&P500: First Trade War indicates that ATH comes soon.S&P500 is a very healthy bullish levels on its 1D technical outlook (RSI = 65.213, MACD = 111.000, ADX = 49.249), being considerably over its 1D MA200, with the 1D RSI very close to the overbought zone. This resembles the first Trade War in 2018, when once the 1D MA200 was crossed, it became a Support level and extended the rally to the index Highs and the R1. We remain bullish on SPX with TP = 6,150.
See how our prior idea has worked out:
## If you like our free content follow our profile to get more daily ideas. ##
## Comments and likes are greatly appreciated. ##
