Nasdaq - This starts the next +50% rally!Nasdaq - TVC:NDQ - might break out soon:
(click chart above to see the in depth analysis👆🏻)
Despite the quite harsh correction of about -25% which we saw in the beginning of 2025, the Nasdaq is clearly heading for new all time highs. It sounds almost incredible but if the Nasdaq breaks above the current confluence of resistance, a breakout rally of +50% will follow thereafter.
Levels to watch: $21.500, $33.000
Keep your long term vision!
Philip (BasicTrading)
Indextrading

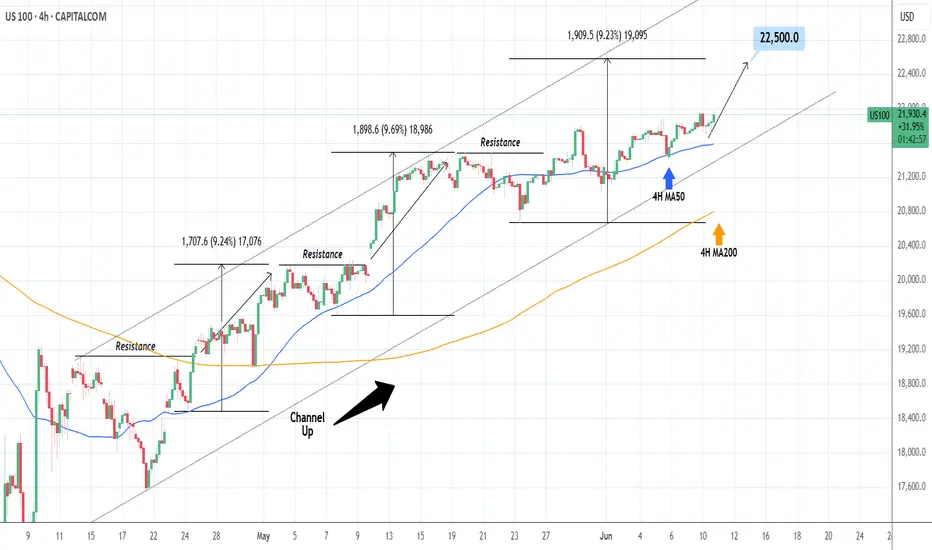
NASDAQ: Close to a strong bounce.Nasdaq is about to turn overbought on its 1D technical outlook (RSI = 68.736, MACD = 505.460, ADX = 18.046) as it is extending an uptrend since the 4H MA50 test/bounce. Such low paced price increase typically precedes strong breakouts. Since the long term pattern is a Channel Up, we are still on its 3rd bullish wave overall. The prior ones were +9.50% on avg, so we remain bullish on the short term, TP = 22,500.
## If you like our free content follow our profile to get more daily ideas. ##
## Comments and likes are greatly appreciated. ##
Nasdaq - The final bullrun breakout!Nasdaq - TVC:NDQ - might break above all structure:
(click chart above to see the in depth analysis👆🏻)
It is quite incredible how volatile stocks have been lately, especially considering that fact that the Nasdaq is about to create new all time highs again. Consequently, we are about to witness a significant structure breakout, which would ultimately lead to another rally of about +30%.
Levels to watch: $21.000
Keep your long term vision!
Philip (BasicTrading)

S&P500: Gearing up for a push to 6,100S&P500 is bullish on its 1D technical outlook (RSI = 64.611, MACD = 85.830, ADX = 19.630) as it has been trading inside a Channel Up for over a month. Right now it is halfway through the new bullish wave. We expect it to rise by at least +4.40%, same as the previous one. Stay bullish as long as the 4H MA50 holds, TP = 6,100.
## If you like our free content follow our profile to get more daily ideas. ##
## Comments and likes are greatly appreciated. ##

DOW JONES: Inverse Head and Shoulders looking for a breakout.Dow Jones is marginally bullish on its 1D technical outlook (RSI = 55.600, MACD = 267.860, ADX = 21.901) as just now it is attempting to be detached from the 4H MA50. Technically this could be the attempt to break towards the 2.0 Fibonacci extension, after having formed the RS of an Inverse head and Shoulders pattern. With the 4H MACD close to a Bullish Cross, we are bullish, TP = 44,250.
## If you like our free content follow our profile to get more daily ideas. ##
## Comments and likes are greatly appreciated. ##

"FR40 TIME-BOMB TRADE: PROFIT BEFORE THE CLOCK RUNS OUT!"🔥 FRANCE 40 HEIST: STEAL THE TREND LIKE A MARKET BANDIT! 🚨💰
Locked & loaded for the FR40 (FRANCE 40) heist? This slick blueprint cracks the code to loot profits—blending killer technicals with macro intel. Ride the bullish wave, but dodge traps near the Overbought Zone. Bears lurk, so secure your bag before the reversal hits! 🐻💨
🎯 ENTRY: STRIKE LIKE A PRO THIEF
Long the breakout near 7900.0 (or) ambush pullbacks at 7620.0 or above.
Set stealth alerts to catch moves in real-time. 🕶️🔔
🛡️ STOP LOSS: ESCAPE ALIVE
Hide stops under the last 4H swing low/wick—no reckless bets!
Adjust for your risk—survivors play smart. ⚡
💸 TAKE PROFIT: VANISH WITH THE LOOT
Main Target: 8150.0 (or bail early if momentum fades).
Scalpers: Trail stops & ghost out with quick wins. 🏃♂️💨
📡 WHY THIS HEIST WORKS
FRANCE 40's on fire: Fundamentals + COT data + macro tides align.
Sentiment’s bullish, but stay sharp—links below for the full intel. 🔍🌐
⚠️ WARNING: NEWS = POLICE SIRENS
Avoid new trades during high-impact news. 📢
Lock profits with trailing stops if you’re already in. 🔐
🤝 JOIN THE TRADING MAFIA
Smash LIKE, drop a comment, & let’s dominate the US100! �
Ready for the next big move? Stay tuned. 👀
Happy hunting, chart pirates! 🏴☠️📉

S&P500: Inverse Head and Shoulders set to extend Apr-May rally.The S&P500 is bullish on its 1D technical outlook (RSI = 58.868, MACD = 85.480, ADX = 31.901) as it maintains a steady Channel Up pattern and just formed the first 1H Golden Cross in a month. Technically this is forming the Right Shoulder of an Inverse Head and Shoulders pattern, typically a bullish reversal formation, which not surprisingly was last seen in April when the Channel Up started and was completed with the previous 1H Golden Cross on April 24th. The result was a bullish extension fo rht 1.618 Fibonacci level. We're bullish on this, TP = 6,150.
## If you like our free content follow our profile to get more daily ideas. ##
## Comments and likes are greatly appreciated. ##

"UK100 Grand Heist: Bullish Loot Plan with Thief Trading Style!🌍 Hello, Global Wealth Warriors! Ciao, Salut, Guten Tag, Ola! 🌟
Fellow Profit Pirates & Market Mavericks, 💸⚡
Unveiling our cunning blueprint to plunder the "UK100/FTSE100" Index Market, crafted with 🔥Thief Trading’s razor-sharp technical and fundamental insights🔥. Stick to the chart’s game plan, zoned in on a long entry. Our mission? Slip out near the high-stakes ATR Zone Level—a perilous spot with overbought vibes, consolidation, trend flips, and traps where bearish bandits lurk. 🏴☠️💰 Celebrate your wins, traders—you’ve earned it! 🎉
📈 **Entry Point**: The vault’s unlocked! Grab the bullish bounty at current prices—the heist is live!
💡 Pro Tip: Set buy limit orders on a 15 or 30-minute timeframe, targeting recent or swing lows/highs. Don’t forget to set chart alerts for precision! 🚨
🛑 **Stop Loss**:
📍 Thief SL parked at the recent/swing low on the 4H timeframe (8500.0) for day/swing trades.
📍 Tailor your SL to your risk appetite, lot size, and number of orders. Stay sharp!
🎯 **Target**: Aim for 8850.0 or make a swift exit just before.
👀 **Scalpers, Listen Up**: Stick to long-side scalping. Got deep pockets? Dive in now! Otherwise, join swing traders for the grand heist. Use trailing SL to shield your loot. 💰
💹 **Market Pulse**: The UK100/FTSE100 is in a neutral zone but leaning bullish, fueled by key drivers. ☝
🌐 Dive into fundamentals—macro economics, COT reports, geopolitical updates, sentiment, intermarket analysis, and index-specific trends. Check the linkss for the full scoop! 🔗🌍
⚠️ **Trading Alert**: News can shake the market! 📰
🔐 Protect your positions:
- Pause new trades during news releases.
- Use trailing stop-loss to lock in gains.
💪 **Join the Heist**: Smash the Boost Button to supercharge our robbery squad! 💥 With Thief Trading Style, we rake in profits daily with ease. 🚀 Your support fuels our market conquests. 🤝❤️
Stay tuned for the next daring heist, money makers! 🤑🐱👤🎯

US30 Locked & Loaded – Get In, Get Profit, Get Out!**💰 Market Heist Alert: US30 Setup 🔥**
Yo Money Raiders & Chart Bandits! 🏴☠️📈
US30 is ripe for the taking, and we’re rollin’ in with the *Thief Trading Style*—a slick mix of sniper-level technicals and street-smart fundamentals. Whether it’s bull or bear, we strike fast, grab profit, and vanish! 💨💸
---
**🧠 The Blueprint – US30 Hit Plan**
**📍 Entry Zones:**
🔹 **Bullish Strike 1**: Look for a pullback and **buy at 42400** – clean signal to enter the action!
🔹 **Bullish Strike 2**: Set your sights on **40900 - 40800**, inside the Institutional Buy Zone. Wait for an MA pullback, then hit it hard. Fortune favors the bold! ⚔️
🔹 **Bearish Ambush**: If price breaks down below **41600**, it’s time to ride that bear wave 🐻💨
💡 **Pro Bandit Tip**: Set alerts on key levels so you never miss the moment! 🔔
---
**🛑 Stop Loss Defense:**
Protect the stash! Use the **nearest 4H low** as your SL for day/swing trades.
Tweak based on your risk level, lot size, and open positions. 🛡️
---
**🎯 Profit Targets – Take the Loot:**
💥 **Bullish Goal**: Lock in at **44200** – or escape early if momentum cools 😎
💥 **Bearish Goal**: Target **40600** – but don’t overstay if signs reverse 🚪
🚨 Watch out for overbought/oversold traps – this is where many fall.
---
**⚠️ Risk Alert – News Incoming!**
News events = wild moves. Handle with care:
📰 Avoid new entries during major news drops
📉 Use **trailing SL** to secure profits and manage risk like a pro
Stay smart. Stay ready. This is a heist, not a gamble! 💼💣
---
**🚀 Boost the Thief Trading Movement!**
If this setup hits your style, smash that **boost** and show love to the Thief Crew! 💪
We raid charts daily with precision, profit, and a bit of outlaw swagger. Let’s own the US30 together! 🤝💵
Stay sharp, alerts on, and eyes wide—more setups coming soon.
Catch you in the green, bandits! 🤑🎉📊

S&P500: First Trade War indicates that ATH comes soon.S&P500 is a very healthy bullish levels on its 1D technical outlook (RSI = 65.213, MACD = 111.000, ADX = 49.249), being considerably over its 1D MA200, with the 1D RSI very close to the overbought zone. This resembles the first Trade War in 2018, when once the 1D MA200 was crossed, it became a Support level and extended the rally to the index Highs and the R1. We remain bullish on SPX with TP = 6,150.
See how our prior idea has worked out:
## If you like our free content follow our profile to get more daily ideas. ##
## Comments and likes are greatly appreciated. ##

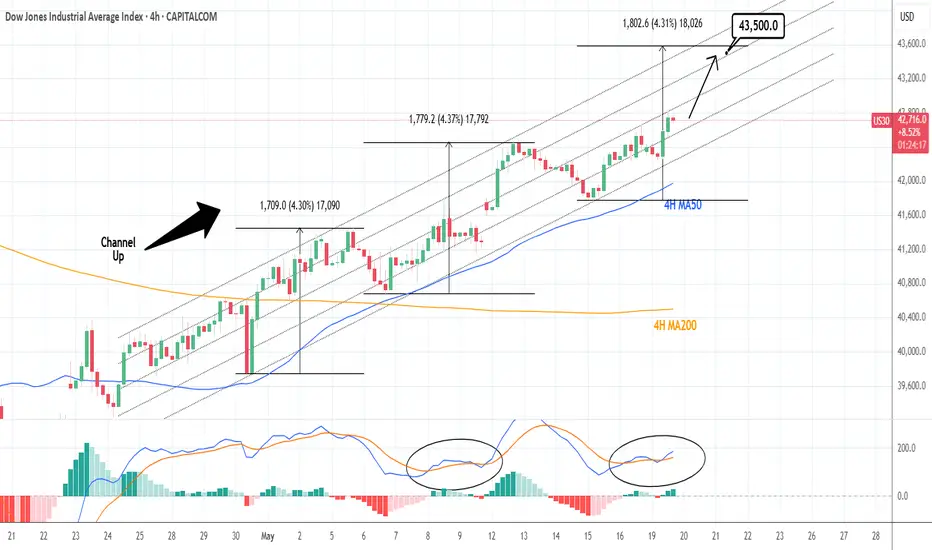
DOW JONES: Looks to extend gains to 43,500Dow Jone remains bullish on its 1D technical outlook (RSI = 62.492, MACD = 410.840, ADX = 32.007) as it maintains the medium term bullish trend inside its 1 month Channel Up. Since the index kept the 4H MA50 intact, it established it as its Support and is now halfway on the new bullish wave. The 2 prior rose by +4.30%, which gives a clear technical target (TP = 43,500)for the next HH.
## If you like our free content follow our profile to get more daily ideas. ##
## Comments and likes are greatly appreciated. ##
S&P500: VIX confirmed new Bull Cycle, eyes 9,800.S&P500 is on excellent bullish levels on its 1D technical outlook (RSI = 66.480, MACD = 76.110, ADX = 38.627) and has technically fulfilled all conditions to extend this recovery and transition into a new Bull Cycle. VIX shows with its massive spike and then aggressive retreat that the correction's bottom is in and is in fact similar to March 2020 (COVID) and March 2009 (subprime crisis). The Bull Cycles after those were similar, the smallest was +105.62%. In accordance to that, we have a long term TP = 9,800.
## If you like our free content follow our profile to get more daily ideas. ##
## Comments and likes are greatly appreciated. ##

HK50 Heist Alert: Snatch the Bullish Loot & Escape the Red Zone!🌎 Greetings, global fortune hunters! Bonjour, Shalom, Salut, Hola! 🌟
Dear Cash Commanders & Market Marauders, 💰⚡️
Forged in the 🔥 Rogue Trader’s crucible of technical and fundamental sorcery 🔥, here’s our sly scheme to plunder the HK50 “HongKong50” Index Market. Stick to the chart’s blueprint, homing in on long entries. Our endgame? Sneak out near the perilous ATR Red Zone, where overbought signals, consolidation, trend reversals, and traps await, with bearish outlaws ready to pounce. 🏴☠️💸 “Lock in profits and spoil yourself, traders—you’re unstoppable!” 🎉💥
**Entry 📈**: The safe’s wide open! Grab the bullish treasure at any price—the raid’s in motion!
For sharper moves, place buy limit orders on a 15 or 30-minute chart at the most recent swing low or high. Hot tip: set chart alerts to stay one step ahead!
**Stop Loss 🛑**:
📍 Rogue SL anchored at the recent swing low on the 4H timeframe (22700.00) for day or swing trades.
📍 Adjust SL based on your risk tolerance, lot size, and number of open orders.
**Target 🎯**: Aim for 24700.00—or slip away early if the market turns dicey!
🧲 **Scalpers, stay sharp!** 👀: Focus on long-side scalps only. Big bankroll? Jump in now! Smaller stack? Team up with swing traders for the heist. Use trailing SL to guard your gold 💰.
💵 **HK50 Market Heist (Swing Trade Breakdown)**: Sitting in a neutral zone with a bullish spark, driven by key market currents. ☝
🗞️ **Dig into the details**: Explore Fundamental Insights, Macroeconomic Trends, COT Reports, Geopolitical Shifts, Sentiment Signals, Intermarket Connections, Index-Specific Factors, Positioning, and Future Targets for the full picture! 👉🔗🌍
⚠️ **Trading Alert: News & Position Tactics** 📰🚨
News events can rattle markets like a tempest. To protect your profits:
- Steer clear of new trades during news releases.
- Deploy trailing stop-losses to secure gains and shield open positions.
💖 **Power up our raid!** 💥 Tap the Boost Button 💥 to amplify our profit-snatching prowess. Join the Rogue Trading Style posse and rake in riches daily with finesse. 🏆🤝🚀
See you at the next market ambush—stay vigilant! 🤑🐱👤🎯

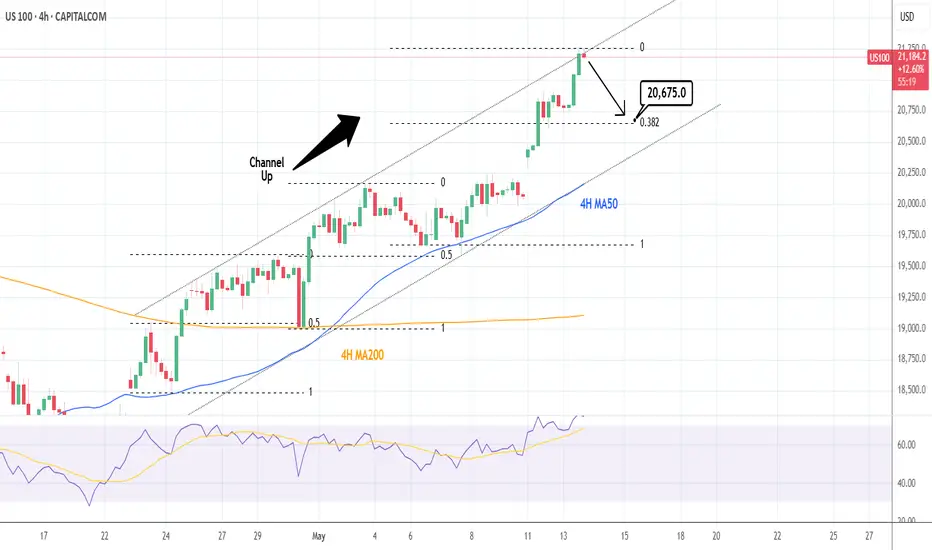
NASDAQ: Time for a 4H technical correction.Nasdaq is almost overbought on its 1D technical outlook (RSI = 69.775, MACD = 371.830, ADX = 37.524) and has reached the top of its 4H Channel Up. The two HH that the pattern has both pulled back to the 0.5 Fibonacci retracement level before the 4H MA50 provided the necessary support for the next bullish wave. Consequently we expect a small correction to at least the 0.382 Fib next (TP = 20,675).
See how our prior idea has worked out:
## If you like our free content follow our profile to get more daily ideas. ##
## Comments and likes are greatly appreciated. ##
Tag ‘n Turn → Bear Mode EngagedV-Shape Reversal Confirms Short Bias
You ever see a setup pull a fakeout, tease a breakout, then pivot perfectly back into your system?
That was yesterday.
The Tag ‘n Turn gave us another clean swing exit off the upper Bollinger Band, and while I was ready to defer the next entry, a tidy little V-shaped reversal handed us the confirmation we needed. We’re back bearish. Levels are set. Now we let the market do its thing.
---
SPX Market View
Let’s unpack the sequence.
Price ran up into the upper Bollinger Band and triggered the final legs of our overnight swings. That was the cash-out point – system clean, profits booked.
But I wasn’t diving into the next setup just yet.
Why?
Because it looked like the start of a Bollinger breakout – the kind that breaks the pinch and rips higher. So I paused. Waited.
Then came the V-shaped reversal – clear as day within 2 hours.
Entry happened late in the day, around the same level the mechanical Tag ‘n Turn would have fired. No edge lost. Just added confirmation.
Now? The system is officially bearish again, with a firm rejection at highs and a sharp drive lower that flipped the tone of the day and the bias on the chart.
Today’s key levels:
5620 = GEX flip zone
Also where we bounced up post-FOMC
5680 = resistance zone – could mark today’s top
We’re back in the pre-FOMC chop zone.
The plan:
Bearish until price tells us otherwise
Hedge levels marked
No chase
Wait for price to hit our zone
Let the system print
Expert Insights:
Jumping the gun on reversals – wait for structure, not assumptions.
Chasing breakouts too early – pinch points often fake before they break.
Skipping levels – 5620 and 5680 matter. Mark them or risk regret.
Overmanaging overnight trades – exits were planned. Trust the system.
Forcing direction changes – confirmation > prediction. The system knows.
Satirical cartoon showing confirmation over prediction.
Rumour Has It…
Word is the SPX reversal was caused by a rogue intern at the Fed who mistook the breakout chart for a bowl of ramen and tried to stir it with a mouse. After rebooting TradingView, they accidentally submitted a bearish policy note to Bloomberg. The market reversed out of pure confusion.
This is entirely made-up satire. Probably!
Breaking scoops courtesy of the Financial Nuts Newswire-because who needs sanity?
---
Fun Fact
The term “V-shaped reversal” originated in early floor trading days when chalkboard analysts would literally sketch a V on the board as a real-time note to floor brokers. That visual shorthand became one of the most recognized intraday patterns in trading – a pattern that still works in a world of tickers, bots, and zero-DTE.

S&P500: Buying accelerating as the bottom is confirmed.S&P500 is neutral on its 1D technical outlook (RSI = 52.628, MACD = -41.490, ADX = 32.588) as it has been volatile during the day but on the long-term, it has resumed the bullish trend, making a strong recovery last week. The bottom is now confirmed (above the 1W MA200) and as the oversold 1W RSI was bought, the index eyes a +28.50% rise on the medium term, same as in early 2024. This falls practically on the previous ATH level (TP = 6,150).
## If you like our free content follow our profile to get more daily ideas. ##
## Comments and likes are greatly appreciated. ##

S&P500 - The Correction Is Over Now!S&P500 ( TVC:SPX ) is retesting massive support:
Click chart above to see the detailed analysis👆🏻
Over the past couple of days, we have been seeing a quite harsh stock market "crash" with an overall correction of about -20%. However, as we are speaking the S&P500 is already retesting a major confluence of support and if we see bullish confirmation, this drop might be over soon.
Levels to watch: $4.900
Keep your long term vision,
Philip (BasicTrading)

S&P500: Bottomed on an Inverse Head and Shoulders.The S&P500 index is bearish on its 1D technical outlook (RSI = 36.973, MACD = -126.240, ADX = 31.007) but long term appears to have bottomed on an Inverse Head and Shoulders pattern. In fact, the Head made a low on the Double Bottom and the bearish outlook is currently due to the Right Shoulder formation. A crossing over the dashed LH trendline and even better the 4H MA200, would aim for the 2.0 Fibonacci extension (TP = 6,280).
## If you like our free content follow our profile to get more daily ideas. ##
## Comments and likes are greatly appreciated. ##

Price Action: Dow Jones Index DJI Monday 4/14/2025In this video, we will be looking at the Daily Chart for the Dow Jones Index (DJI) and its potential price action forecast for Monday 4/14/2025.

DOW JONES: Just triggered the most historic buy signal (1M MA50)Despite the bearishness on the lower timeframes, Dow is neutral on the ultimate long term chart, the 1M (RSI = 51.044, MACD = 1991.530, ADX = 44.038) and that is due to the fact it almost touched its 1M MA50. This neutral technical setting is a great reset for the Channel Up and stands as the most ideal long term buy entry and was tested before on all 4 major market bottoms (September 2022, March 2020, January 2016, October 2011). In all incidents it set in motion the new Bull Cycle, technically the bullish wave of the Channel Up. The most common price increase is +70% and along those lines, we anticipate Dow to hit 60,000 by the end of 2027.
## If you like our free content follow our profile to get more daily ideas. ##
## Comments and likes are greatly appreciated. ##

DOW JONES: High volatility but clear picture long term.Dow Jones turned bearish on its 1D technical outlook (RSI = 40.021, MACD = -1063.380, ADX = 32.380) as it is correcting brutally yesterday's gains on uncertainty regarding the 90-day pause of tariffs. We can't overlook however the fact that yesterday's rebound happened on the 1W MA200 and at the bottom (HL) of the Bullish Megaphone. The very same sequence of events unfolded during the last big U.S.-China trade war that bottomed in December 2018. First a Channel Down bottomed on the 1W MA200 and started the Bullish Megaphone that bottomed on the 2018 trade war.
Both trade war corrections were -19% and if what follows replicates the 2019 rise, then we are up for a +35% rally. Potential TP = 49,000.
## If you like our free content follow our profile to get more daily ideas. ##
## Comments and likes are greatly appreciated. ##

S&P500: Trump's 90-day tariff pause just saved the day??S&P500 is having so far a +9.50% rise from today's low as even though Trump announced a 125% raise to China tariffs, he lowered and paused tariffs for 90 days to all countries that contacted the U.S. for negotiation. The 1D technical outlook is about to get neutral (RSI = 42.537, MACD = -181.510, ADX = 39.036) as the rebound is taking place at the HL bottom of the Bullish Megaphone, while the 1W MA200 stayed intact.
A similar Megaphone was last seen during the previous 2018 Trade War and was completed with the COVID crash that started an abnormal rally to new ATH to correct the equally abnormal crash. Needless to say, it was based on quick rate cuts but the situation isn't all that different today. Trump's stance towards negotiating, coupled with highly anticipated rate cuts, can deliver an equally abnormal rally now.
The previous HH of the Bullish Megaphone hit the 2.0 Fibonacci extension. This time if the rally extends to the end of the year, targeting the 1.5 - 1.618 Fibonacci Zone would be considered fair (TP = 6,900).
## If you like our free content follow our profile to get more daily ideas. ##
## Comments and likes are greatly appreciated. ##

NASDAQ: Cyclical correction most likely completed. ATH by June?Nasdaq remains oversold both on its 1D (RSI = 25.630) and 1W (RSI = 28.851, MACD = -442.980, ADX = 36.399) technical outlook as yesterday's rally is being corrected today on strong technical selling. Long term it looks like this was a cyclical correction, reached -25%, hit the 3W MA50/1W MA200 zone (which has been the best buy entry in the past 10 years) that has most likely been completed. In addition, the 1W RSI is on the same oversold levels as May 16th 2022, the lowest it has been since 2008. According to the Fibonacci Channel Up, the market can hit 22,300 as early as June.
## If you like our free content follow our profile to get more daily ideas. ##
## Comments and likes are greatly appreciated. ##
