Why Oil’s Drop Fuels a Global Risk-Off SentimentWTI Crude Oil Monthly Technical Outlook: Below $60 and the Broader Market Implications
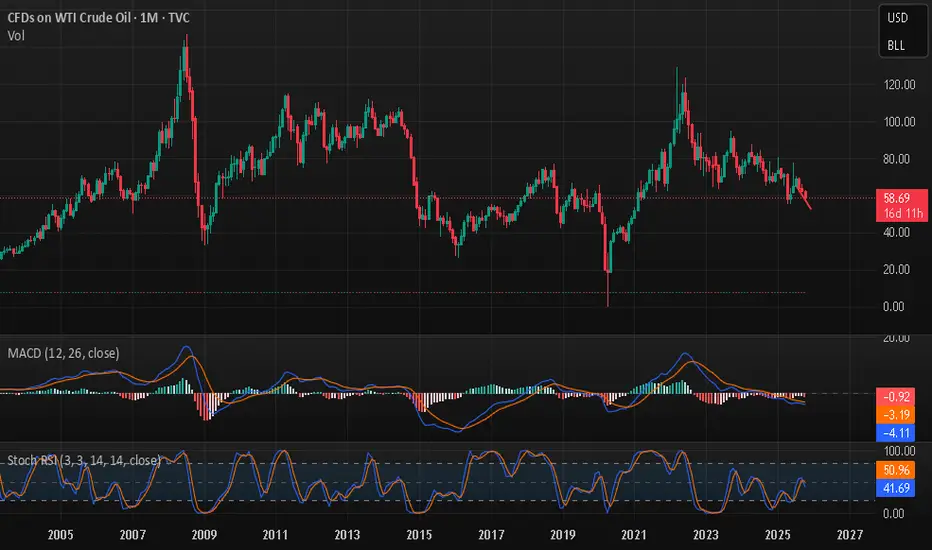
As the fourth quarter of 2025 unfolds, the WTI Crude Oil (USOIL) chart offers a critical perspective on the state of global supply-demand balance and its broader impact on market sentiment. Trading near $58.5 per barrel, oil prices have fallen below a key psychological threshold, and while the move may seem technical at first, its implications reach far beyond the energy market.
The combination of weakening momentum indicators, rising supply projections, and softening global demand paints a nuanced but important story: oil’s slide below $60 is no longer just a chart event, it’s a macro signal about global growth, supply dynamics, and investor positioning.
Technical Overview: Momentum Loss Deepens
The monthly chart for WTI shows a clear picture of fatigue after multiple failed rebound attempts over the past 18 months. Since peaking near $130 in early 2022, prices have formed a persistent pattern of lower highs and lower lows, reflecting an extended process of distribution.
In recent months, WTI has failed to sustain moves above $70, with sellers consistently stepping in on rallies. The October bar extended losses toward the $58 level, marking the weakest monthly close since mid-2023.
Structurally, this decline puts WTI in a critical support zone between $55 and $57, which coincides with the base that previously stabilized prices in late 2023. Should this zone fail, the next major support rests around $50 per barrel, aligning with a key Fibonacci retracement of the 2020–2022 rally.
On the upside, the resistance band remains in the $65–$68 range, a descending trendline that has capped every rebound since early 2024. A decisive monthly close above that zone would be the first confirmation of renewed strength, but momentum indicators are still leaning toward continued weakness or sideways consolidation.
MACD and Stochastic RSI: Weakening Momentum Signals
The MACD (12,26,9) indicator remains subdued below the zero line, underscoring a prolonged loss of upside momentum. The histogram has recently turned red again, indicating that the MACD line may cross below the signal line, a potential confirmation that sellers still control the trend.
Meanwhile, the Stochastic RSI, which measures RSI velocity, has rolled over from midrange levels and is pointing lower again. Its failure to sustain a rebound above 50 shows that bullish energy has faded.
If this oscillator drops below 30, it would confirm a continuation of weak-to-neutral price action through the rest of Q4. Historically, such conditions precede prolonged consolidation phases, where volatility contracts before a new trend forms.
Together, these indicators portray a market not in full capitulation, but clearly lacking conviction for an upside breakout.
Fundamental Picture: Oversupply Meets Slowing Demand
While technical signals reveal a loss of momentum, the fundamental backdrop provides stronger clues about why oil has struggled to maintain value above $60. Recent data from major energy agencies, including the International Energy Agency (IEA), the U.S. Energy Information Administration (EIA), and multiple Reuters reports, converge on one central theme:
the global oil market is entering a surplus phase, with supply growth outpacing demand.
Large Oversupply Projections
Read full analysis on my website
darrismanresearch com
Macroeconomics
Macro Alert: The Stealth Flight 2 Alts (Tariffs, Gold & Privacy)🚨 MACRO ALERT: The Silent Surge — Altcoins Accumulating Undetected Since April
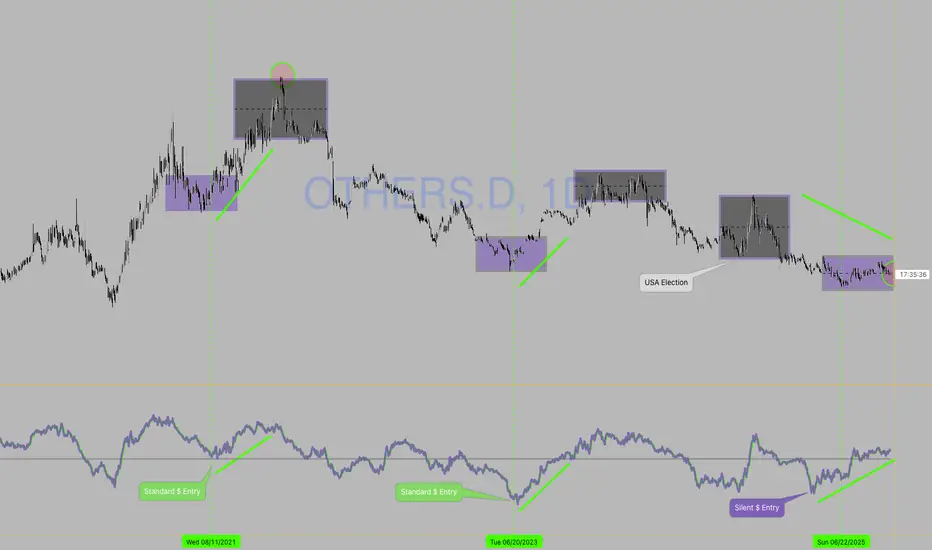
Chart: CRYPTOCAP:OTHERS.D
━━━━━━━━━━━━━━━━━━━━━━━━━━━━━━━━━━━━━━━━
📊 The Setup
While the mainstream remains fixated on Bitcoin's swings, a quiet but significant capital rotation into altcoins is underway. This move, largely undetected by the broader market, is being fueled by shifting global macroeconomic tides and a growing institutional hunt for wealth preservation and financial privacy .
━━━━━━━━━━━━━━━━━━━━━━━━━━━━━━━━━━━━━━━━
🔴 THE CRISIS: Multiple System Failures Converging
🏦 BIS Warning: Global Liquidity Crisis
↓
🇯🇵 Japan: Unsustainable debt from fiscal stimulus
🇫🇷 France: 0.6% growth in 2025, economic stagnation
↓
💸 Coordinated failure of fiat monetary policy
⛓️ Government Attacks on Safe Havens
↓
🇺🇸 U.S. Gold Tariffs: 39% on major imports
Physical metals face capital controls & taxation attacks
Traditional assets no longer safe from state control
🔒 Even Crypto Has Centralization Issues
↓
📜 GENIUS Act: Stablecoins expand M2 money supply (monetizing debt via blockchain)
🏢 XRP: Concentrated token control raises manipulation concerns
━━━━━━━━━━━━━━━━━━━━━━━━━━━━━━━━━━━━━━━━
🟢 THE SOLUTION: Where Capital Is Flowing
Smart money is seeking assets with:
• TRUE decentralization
• Privacy features
• Fixed supply
• Institutional-grade infrastructure
The Data Confirms It:
🔐 Privacy Coins (XMR, ZEC): +71.6% in 2025
📊 CRYPTOCAP:BTC: +27.1%
📊 CRYPTOCAP:ETH: +33.4%
📈 OTHERS.D: Rising quietly
This is sophisticated money moving in, not retail FOMO.
━━━━━━━━━━━━━━━━━━━━━━━━━━━━━━━━━━━━━━━━
💥 The Macro Catalyst: Why This Is Happening Now
⚡ Gold Under Attack: The recent 39% U.S. tariff on major gold imports has rattled the traditional safe-haven market, creating artificial scarcity and signaling a broader trend of government control over monetary assets . When even physical metals face intervention, capital seeks alternatives outside increasingly controlled systems.
🚨 The BIS Warning Nobody Is Discussing:
The Bank for International Settlements is quietly sounding alarms on global liquidity risks:
• 🇯🇵 Japan's fiscal stimulus → unsustainable debt levels
• 🇫🇷 France → 0.6% growth (stagnation)
• 💸 Result: Coordinated fiat monetary policy failure
🪤 The Stablecoin Trap:
The U.S. GENIUS Act is expanding M2 money supply through the back door via stablecoins:
→ Legitimizing stablecoin issuance backed by Treasury bonds
→ Monetizing debt while calling it "innovation"
→ This isn't decentralization—it's the Fed with a blockchain wrapper
━━━━━━━━━━━━━━━━━━━━━━━━━━━━━━━━━━━━━━━━
🎯 Macro Pressure → Altcoin Opportunities
😰 Worried About: Wealth Confiscation/Control
💡 Consider: Financial Sovereignty & Privacy
🔍 Examples: CRYPTOCAP:XMR , CRYPTOCAP:ZEC
📈 Catalyst: Zcash surged 150%+ on institutional demand (Grayscale Trust)
😰 Worried About: Currency Devaluation & Inflation
💡 Consider: Scarce, Decentralized Stores of Value
🔍 Examples: Altcoins with fixed supplies + robust decentralized governance
🔑 Key: Assets that can't be inflated or controlled by single entities
😰 Worried About: Traditional Finance Instability
💡 Consider: Institutional-Grade Blockchain Infrastructure
🔍 Examples: HBAR (corporate governance) & XRP (cross-border payments)
⚠️ Note: Focus on real-world utility beyond speculation
━━━━━━━━━━━━━━━━━━━━━━━━━━━━━━━━━━━━━━━━
What to Watch For
✅ Confirmation: Strong, high-volume breakout above recent range high on CRYPTOCAP:OTHERS.D
🔍 The Privacy Pulse: Continued strength in privacy coins ( CRYPTOCAP:XMR , CRYPTOCAP:ZEC , XVG.D) is a key leading indicator. Note: Privacy coins face regulatory challenges and have been delisted from some major exchanges.
❌ Invalidation: Break and close below key support zone (April low structure) would suggest macro fears haven't overcome broader market uncertainty.
━━━━━━━━━━━━━━━━━━━━━━━━━━━━━━━━━━━━━━━━
🎯 The Bottom Line
The gold tariff is a symptom of a larger disease: eroding trust in neutral, non-government monetary assets . This is forcing a "regime change" in capital allocation.
As this realization dawns on more investors, the quiet accumulation in altcoins—particularly those offering privacy, sovereignty, and real-world utility —could explode into the next major market narrative.
💭 Smart money is moving early. The question is: will you recognize this shift before it becomes obvious?
━━━━━━━━━━━━━━━━━━━━━━━━━━━━━━━━━━━━━━━━
⚠️ Disclaimer: This is macroeconomic observational analysis and is not financial advice. Always conduct your own research (DYOR) and manage risk appropriately.
Cheers!
BTC vs USD: Macro Liquidity vs TechnicalsBitcoin is at a hinge point.
Technical View: Weekly volume profile looks bearish, but if BTC closes above 119,465.52 the setup flips into an explosive breakout.
Macro View: The dollar is boxed (96.7–98.3) and fiscal stress + Fed cut bets are weighing on USD. Gold is at record highs on safe-haven demand. In this environment, macro liquidity can override technical ceilings.
That’s why I’ve stepped back to scalping until the macro picture stabilizes. The market is running on liquidity hunts, not clean structure.
🔑 Levels to Watch
BTC: Weekly close >119,465.52 → ignition higher
DXY: Breakout from 96.7–98.3 range decides cross-asset direction
When macros dominate, technicals bend. Patience and risk control matter more than chart perfection here.

BTC USD PLAN
Bitcoin’s chart is one thing, but the bigger story is what’s driving the money behind it.
The Fed & Yields
The Federal Reserve is still the invisible hand. Every surprise in rates—whether a hotter inflation print or a sudden hint of deeper cuts—moves global risk appetite.
Lower real yields = cheaper capital = stronger bid for assets like BTC.
A hawkish turn does the opposite.
Institutional Flow
Big money isn’t just buying dips—it’s writing new rules.
Case in point: asset manager Strive is set to acquire about 5,800 BTC (≈ $675 million) through a corporate deal.
Moves like this tighten available supply and add a slow, steady demand base.
Bitcoin Technical View
This week’s candle is shaping up bearish, and Monday will tell us if today’s Sunday session finishes the job.
If the market doesn’t fill that daily gap, we’ll be watching Monday’s open closely.
Right now the daily range runs from 113,999 down to 108,644.
If the dollar pushes into higher liquidity zones, Bitcoin could feel the pressure and drift lower.
The plan is simple: wait for a clear shift on the smaller time frames before making any move and calculate risk from there.
Patience matters more than bravado—let the market come to you.
For now, the setup still looks constructive, but it only pays to act when the levels confirm.
Trade small, stay calm, and protect your capital first.

US Dollar Flexes, Look For on 99.05Sunday War Map –
A weekly candle this strong leaves a mark. The dollar printed a 96.77 low to 98.18 high—a full-bodied bullish bar that demands respect.
Macro
This week is stacked with U.S. data that can shake the pullback narrative:
Tue 30 Sep – JOLTS & Consumer Confidence: first look at hiring demand and household mood.
Wed 1 Oct – ISM Manufacturing PMI: factory pulse and price pressures.
Thu 2 Oct – Durable Goods & Trade Data: capital-expenditure clues.
Fri 3 Oct – Non-Farm Payrolls & Hourly Earnings: the heavyweight. A hot jobs print could delay the December Fed-cut story (futures still price ~70% odds).
Technical Targets
Expect an early-week pullback as traders digest that massive weekly bar.
Two liquidity pools we’ve tracked for months were cleared last week; two upside targets still in play 98.2 and 98.3 remain before the chart reaches a true “bearish-range discount.”
Keep eyes on the 99.05 volume node—a well-defined supply zone where cross-market reactions (EUR, gold, crypto) could spike.
The dollar controls the tempo. Wait for the market to come to your levels; don’t chase the last candle.

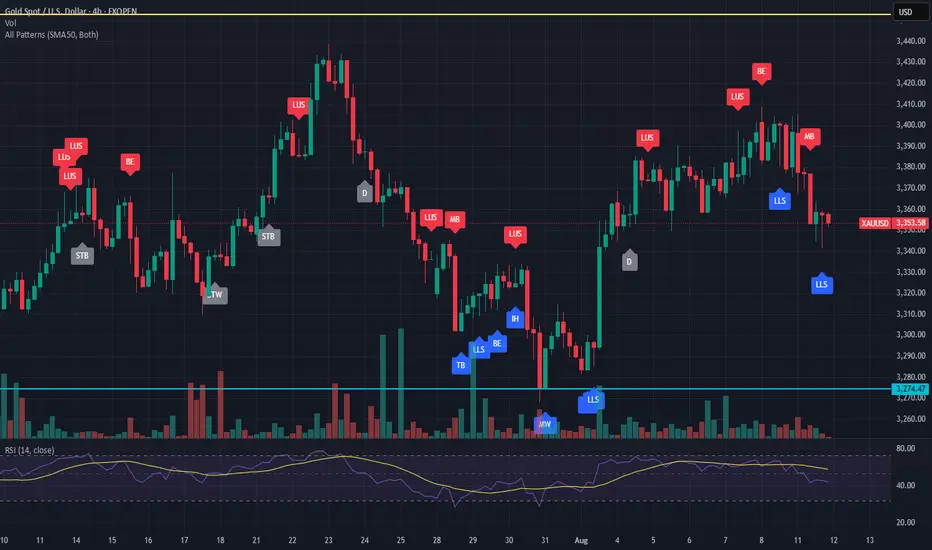
I'm still long biased @ $XAUUSD (but deleveraging)Technical View
A potential bullish cup & handle pattern is forming, often seen as a continuation signal.
Price has already broken out of a bearish channel, which suggests that buyers have taken control.
Triangle and wedge formations point to pressure building upward.
The broader macro channel remains intact, so the larger trend has not been broken.
Clear invalidation levels are visible near 3,730 and 3,612, which provides trade structure from a technical perspective.
Overall, the technical picture continues to lean bullish.
Macro View
US CPI remains sticky while jobless claims are softening, hinting at stagflation dynamics.
The Federal Reserve is under pressure to cut rates, with real interest rates already negative.
Historically, when real rates are negative, gold tends to outperform bonds as a store of value.
Global central banks remain net buyers of gold as they diversify away from Treasuries.
This combination is similar to the 1970s stagflation backdrop: falling rates with inflation uncertainty often encouraged capital flows into gold.
Opinion
Technicals suggest upward momentum. Macro factors also support a bullish bias. The main caveat is that positioning in gold is already heavy, which can lead to sharp short-term volatility. Directionally, however, the long bias aligns with both the charts and the macro backdrop.
Disclaimer
This post reflects only my personal market observations and opinions, shared for educational and informational purposes. It should not be considered financial advice, investment recommendation, or a call to action. Trading financial markets involves risk, and you should carefully assess your own situation and risk tolerance before making any trading decisions. Past performance or historical patterns do not guarantee future results. Always do your own research and consult a licensed financial professional if needed.

U.S. Dollar Index (DXY) Weekly 2025Summary:
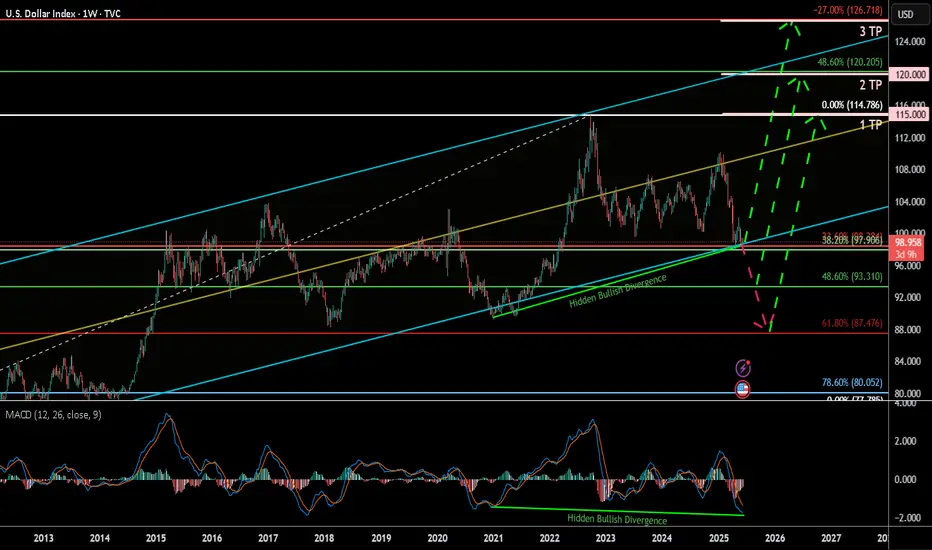
The U.S. Dollar Index (DXY) has corrected down to the key 38.60% Fibonacci retracement zone and is currently showing signs of a potential bullish reversal, bolstered by a clear hidden bullish divergence on the MACD. This may signal a renewed rally toward key upside targets, especially if the 93.3–99.9 support Zone holds.
Chart Context:
Current Price: 98.864
Key Fib Support: 38.60% @ 99.906, 48.60% @ 93.310, 61.80% @ 87.476
Support Zone: 93.3–99.9 USD
Hidden Bullish Divergence: Observed both in 2021 and now again in 2025 on the MACD
Trendline Support: Long-term ascending trendline holding since 2011
Fib Extension Targets (Trend-Based):
TP1: 115.000
TP2: 120.000
TP3: 126.666
Key Technical Observations:
Fibonacci Confluence: DXY is bouncing from a strong Fib cluster between 93.310 and 99.906, historically acting as a reversal zone.
Hidden Bullish Divergence: Suggests potential upside despite price weakness.
Downtrend Retest: Price may revisit 93.3–87.4 before confirming full reversal.
Breakout Pathway: Green dashed arrows outline the likely recovery trajectory toward 114–126 range.
Indicators:
MACD: Showing hidden bullish divergence and potential signal crossover.
Trendline Support: Holding intact from 2021 low.
Fib Levels: Used for retracement and trend-based extension.
Fundamental Context:
Interest Rate Outlook: If U.S. inflation remains controlled and Fed signals future hikes or sustained high rates, DXY strength may persist.
Global Liquidity & Recession Risk: If risk aversion returns, the dollar may rise as a safe haven.
Geopolitical Risks: Conflicts, trade tensions, or BRICS dedollarization efforts may create volatility.
Our Recent research suggests the Fed may maintain higher-for-longer rates due to resilient labor markets and sticky core inflation. This supports bullish USD bias unless macro shifts rapidly.
Why DXY Could Continue Strengthening:
Robust U.S. economic performance & monetary policy divergence
U.S. GDP growth (~2.7% in 2024) outpaces developed peers (~1.7%), supporting stronger USD
The Fed maintains restrictive rates (4.25–4.50%), while the ECB pivots to easing, widening the policy and yield gap .
Inflation resilience and Fed hawkishness
Labor markets remain tight, keeping inflation “sticky” and delaying expected rate cuts; market-implied cuts for 2025 have been pushed into 2026
Fed officials (e.g. Kugler) emphasize ongoing tariff-driven inflation, suggesting rates will stay elevated.
Safe-haven and yield-seeking capital flows
With global risks, capital favors USD-denominated assets for yield and stability
Why the Dollar Might Face Headwinds
Fiscal expansion & trade uncertainty
Ballooning U.S. deficits (~$3.3 trn new debt) and erratic tariff policy undermine confidence in USD
Wall Street’s consensus bearish position.
Major banks largely expect a weaker dollar through 2025–26. However, this crowded bearish sentiment poses a risk of a sharp rebound if data surprises occur
barons
Tariff policy risks
Trump's new tariffs could dampen dollar demand—yet if perceived as fiscal stimulus, they could unexpectedly buoy the USD .
Synthesis for Our Biases
A bullish DXY thesis is well-supported by:
Economic and policy divergence (U.S. growth + Fed vs. peers).
Hawkish Fed commentary and sticky inflation.
Safe-haven capital inflows.
Conversely, risks include:
Deteriorating fiscal/trade dynamics.
Potential Fed pivot once inflation shows clear decline.
A consensus that could trigger a short squeeze or reversal if overstretched.
Philosophical / Narrative View:
The dollar remains the world’s dominant reserve currency. Periodic dips often act as strategic re-accumulation phases for institutional capital—especially during global macro uncertainty. A return toward 120+ reflects this persistent demand for USD liquidity and safety.
Bias & Strategy Implication:
1. Primary Bias: Bullish, contingent on support at 93.3–99.9 holding.
2. Risk Scenario: Breakdown below 93.3 invalidates bullish thesis and targets 87.4–80 zones.
Impact on Crypto & Gold and its Correlation and Scenarios:
Historically, DXY has had an inverse correlation to both gold and crypto markets. When DXY strengthens, liquidity tends to rotate into dollar-denominated assets and away from risk-on trades like crypto and gold. When DXY weakens, it typically acts as a tailwind for both Bitcoin and gold.
Correlation Coefficients:
DXY vs. Gold: ≈ -0.85 (strong inverse correlation)
DXY vs. TOTAL (crypto market cap): ≈ -0.72 (moderate to strong inverse correlation)
Scenario 1: DXY Rallies toward 115–126 then, Expect gold to correct or stagnate, especially if yields rise. Crypto likely to pull back or remain suppressed unless specific bullish catalysts emerge (e.g., ETF flows or tech adoption).
Scenario 2: DXY ranges between 93–105 then Gold may consolidate or form bullish continuation patterns. Then Crypto may see selective strength, particularly altcoins, if BTC.D declines.
Scenario 3: DXY falls below 93 and toward 87 Then Gold likely to rally, possibly challenging all-time highs. Crypto could enter a major bull run, led by Bitcoin and followed by altcoins, fueled by increased liquidity and lower opportunity cost of holding non-USD assets.
Understanding DXY’s direction provides valuable insight for portfolio positioning in macro-sensitive assets.
Notes & Disclaimers:
This analysis reflects a technical interpretation of the DXY index and is not financial advice. Market conditions may change based on unexpected macroeconomic events, Fed policy, or geopolitical developments.
Gold (XAUUSD) Weekly TF 2025Overview
This analysis outlines the structural Fibonacci confluences, scenario planning, and macro-aligned projections for Gold (XAUUSD) on the weekly timeframe. It integrates multi-layered Fibonacci extensions and retracements, mapping out key support and resistance levels, and proposes a nuanced primary scenario that includes both intermediate rallies and corrective movements.
Primary Scenario – Multi-Stage Movement Hypothesis
We anticipate that gold may initially extend higher from the current level (~$3,325) to test the 127.2% Fibonacci extension at $3,435, with the possibility of a further intermediate peak near $3,500. This level marks a psychological and technical resistance zone and could act as a temporary top.
Following this local peak, a corrective phase may unfold. This pullback could evolve into one of the two outlined correction scenarios:
1 TP Correction Scenario
Support Target: ~$2,950
Basis: 100% Fib extension confluence and prior resistance turned support
Expected Outcome: Price stabilizes at this level and resumes upward momentum
2 TP Correction Scenario
Support Target: ~$2,650
Basis: Strong historical structure + 100% Fib confluence from a broader cycle
Expected Outcome: This zone acts as a long-term demand accumulation area
Upon completion of the corrective structure, we expect gold to reinitiate its primary bullish trend.
Bullish Continuation Targets
TP1: ~$4,050 (161.8% Fibonacci extension)
TP2: ~$4,319 (261.8% Fibonacci extension)
These targets align with macroeconomic conditions, central bank accumulation trends, and long-term structural cycles.
Supporting Technicals
RSI: Holding above 50, indicating preserved bullish momentum
MACD: Positive crossover with widening histogram on weekly timeframe
Price Action: Strong support zone between $3,280–$3,300 aligning with 161.8% Fib retracement of the recent minor wave
Macro Fundamentals & Correlations
Central Bank Gold Demand: Sustained net buying by BRICS nations, particularly China and Russia, supports the structural bid on gold
Fed Policy: Market anticipates a prolonged pause or gradual rate cuts, favoring non-yielding assets like gold
DXY & US10Y Yields: Any further decline in DXY or softening yields would add tailwinds to gold
Crypto Correlation: During inflationary hedging or systemic risk periods, gold and crypto may correlate positively, especially with weakening USD
Intermarket Relationships: Gold, DXY, and TOTAL (Crypto Market Cap)
Gold vs. DXY (US Dollar Index)
Gold historically maintains an inverse correlation with DXY. A rising DXY tends to apply downward pressure on gold prices, while a falling DXY enhances gold's upside momentum.
Scenario Interactions:
If DXY breaks below 98, this could validate the bullish scenario for gold toward $3,435–$4,050.
If DXY rallies back above 100, it could trigger the correction scenarios ($2,950 or $2,650) in gold.
Gold vs. TOTAL (Crypto Market Cap)
Gold and TOTAL may show positive correlation during periods of USD weakening and global liquidity expansion.
Scenario Interactions:
If gold rallies toward $3,500 and TOTAL also breaks key resistance (e.g., $1.8T–$2T), this signals synchronized bullish risk appetite.
If gold corrects while TOTAL continues to rise, it could indicate rotation of liquidity from defensive to risk-on assets.
A simultaneous correction in both may occur if DXY strengthens aggressively or if macro shocks reduce global liquidity.
These intermarket relationships should be monitored continuously to assess the evolving macro context and validate the chosen scenario.
In the case of a gold correction toward $2,950 or $2,650, the impact on altcoins will hinge on the prevailing macroeconomic backdrop. If the correction stems from a healthy, technical rebalancing within a risk-on environment—without a concurrent surge in the U.S. dollar—it could signal a shift in capital from defensive assets like gold into more speculative plays, including altcoins. This type of capital rotation often benefits the crypto market, particularly if TOTAL (crypto market cap) holds or advances structurally. However, if the correction is caused by rising dollar strength, tightening financial conditions, or broader risk-off sentiment, altcoins may instead suffer alongside gold, as liquidity is withdrawn across the board. Therefore, the context and drivers behind gold’s correction are crucial in assessing its downstream effects on altcoin performance.
From a philosophical lens, gold's cyclical ascent and retreat mirrors the rhythm of nature and human experience—expansion, contraction, and renewal. Just as rivers carve valleys before surging toward the ocean, the market too must surrender gains to gather force. A correction in gold is not merely a financial event, but a moment of recalibration—an inhale before the next exhale of momentum. It invites reflection: whether wealth seeks refuge or ventures into risk, whether fear contracts or ambition expands. In this interplay, altcoins may inherit the restless spirit of capital in search of yield, as gold, the ancient anchor of value, briefly pauses in its timeless journey.
Conclusion
We present a multi-phased path for gold where:
An initial bullish breakout toward $3,435–$3,500 forms a short- to mid-term peak
A subsequent correction brings gold to either $2,950 or $2,650, depending on macro triggers
A renewed bull rally drives gold toward $4,050 and potentially $4,319 and beyond
This scenario reflects both the cyclical nature of market structure and the macro-fundamental backing that continues to support long-term gold strength.

Economic Tipping Point...GFC 2.0? In this video we discuss;
Bond Market Signal using the 2 year yield.
Is the 2 year yield giving us a 2007 / 2008 signal?
We look at the correlation of the 2 year yield vs SPX
We analyze the forward expectation of interest rate projections.
Observe and dissect last weeks economic employment data.
There will be plenty of opportunities in this next phase of the market cycle.
I will be looking very forward to the plethora of trade alerts I will be issuing.

U.S. Macroeconomic DashboardThis is more of a cheatsheet/how-to for my own reference on my macro indicators charting layout. If the chart layout is helpful to the community, all the better! I find it useful for studying events and crises.
Indicators used: SPX, VIX, FEDFUNDS + US10Y + T10Y2Y, USIRYY + USCIR, UNRATE, USBCOI, BAMLH0A0HYM2, DXY
Row 1: Equity and volatility benchmarks
Row 2: Policy stance and inflation
Row 3: Unemployment and growth metrics
Row 4: Credit spreads and USD strength
SPX
Measuring : Equity benchmark
Relevance : Broadest market barometer
Observe : Trend direction, key levels, divergence vs other indicators
VIX
Measuring : Volatility index
Relevance : Market's implied volatility (read: "fear/greed gauge")
Observe : Spike --> risk-off, hedging demand; sustained lows --> complacency
FEDFUNDS + US10Y + T10Y2Y
Measuring : U.S. policy stance and yield curve
Relevance : Monetary tightening and loosening; yield curve recession slope
Observe : T10Y2Y curve inversion --> recession risk; bear steepening --> watch for inflation/deficit concerns; bull steepening --> Fed easing, recovery signal
USIRYY + USCIR
Measuring : Inflation
Relevance : Headline: all prices; Core: Excluding food + energy
Observe : Headline stat drives short-term moves. Core stat drives Fed policy
UNRATE
Measuring : Unemployment rate
Relevance : Labor market health (this is a lagging indicator)
Observe : Rising trend --> recession risk; very low --> possible overheating
USBCOI
Measuring : Manufacturing PMI; Business activity
Relevance : Leading growth indicator for manufacturing, services
Observe : >50 means expansion, <50 means contraction
BAMLH0A0HYM2
Measuring : U.S. High Yield Option-Adjusted Spread (the extra yield/spread investors demand to hold junk bonds vs risk-free Treasuries)
Relevance : Stress in corporate bond markets; risk sentiment
Observe : Widening --> investors demand more compensation for credit risk; narrowing --> investors are confident, low fear of defaults. 2-4 is normal, 4-6 is stressed, 6+ is distress, 10+ is crisis level
DXY
Measuring : USD strength
Relevance : Global liquidity, capital flows, financial conditions
Observe : Strong USD = tighter conditions and pressure on risk assets; inverse for weak USD

$200 soon - SOL weekly update August 12 - 18thFrom an Elliott Wave perspective, the scenario for Solana has been slightly adjusted from previous counts. Current price action suggests that SOL is already in an impulsive upward move, which aligns well with the broader correlation observed across the altcoin market. As with many other altcoins, the structure shows a completed 1–2 sequence at the Primary degree and another 1–2 sequence at the Intermediate degree. At the Minor degree, price is in the final stages of Wave 1, specifically in Minute Wave 5.
An alternative scenario — less likely but still possible — is that the move is actually a corrective structure, with the Minor degree currently forming Wave C. This would become more probable if price extends significantly beyond the 1.618 Fibonacci extension, as such behaviour would be atypical for a standard fifth wave.
From a liquidity standpoint, short- to medium-term bias points upward. The liquidity heatmap shows a large concentration of liquidity at the local high of Wave 3, as well as significant order clusters near the 1.0 extension target for the current Wave 5. However, substantial liquidity is also accumulating below current price, which will likely be targeted during the subsequent Wave 2 retracement.
Funding rates have shifted from slightly negative toward positive territory, and open interest is climbing — both signs of a stable and sustained upward move.
Macro conditions also support the current market tone. The latest CPI data came in at 2.7%, better than expected, boosting sentiment. As the FOMC meeting approaches, retail traders are increasingly positioning for a potential “altseason” — a dynamic that raises the probability of a sell-the-news event if expectations are overextended.
Given the current wave structure, liquidity positioning, and macro backdrop, the 1.0 Fibonacci extension level has been set as the primary target for the completion of this Minor Wave 5. This area aligns with heavy order clustering and fits the typical profile for a fifth wave termination before a corrective phase.
Do your own research — and trade safe.

BTC vs DXY: BTC is going for another topAs we can seen from the chart, BITGET:BTCUSDT and TVC:DXY has a reverse correlation. A bottom for DXY means a top for BTC. From 3 Months timeframe perspective, we can see that we are close to the top of Bitcoin, which is potentially happen in the middle of Q4 2025.

U.S. Slaps 39% Tariff on Swiss Gold BarsU.S. Slaps 39% Tariff on Swiss Gold Bars, Shaking the Global Bullion Market
By Hirad Aryanejad – Macroeconomic & Gold Markets Analyst
---
The United States has moved to impose a 39% tariff on imports of one-kilogram and 100-ounce gold bars from Switzerland — a shock decision that could ripple across the global bullion market.
In a letter dated July 31, 2025, the U.S. Customs and Border Protection (CBP) reclassified these widely traded bullion products — critical to the Comex futures market — as “semi-manufactured”, making them subject to duties.
Previously, they were classified as “unwrought, nonmonetary gold” , exempting them from earlier tariff rounds.
---
A Blow to the World’s Largest Refining Hub
The decision follows former President Donald Trump’s broader tariff package on all Swiss goods, announced after rejecting Switzerland’s proposal for a 10% tariff in exchange for \$150 billion in U.S.-bound investment.
Switzerland — the world’s largest gold refining hub — exported roughly $61.5 billion in gold to the U.S. over the 12 months ending June 2025. The new tariff could add nearly $24 billion in duties.
Christoph Wild, President of the Swiss Association of Manufacturers and Traders of Precious Metals, called the ruling “another blow” to Swiss-U.S. gold trade, warning that exports may become “economically unviable”.
---
Market Reaction: Record Gold Prices
The ruling triggered an immediate market shock. Gold futures in New York surged past $3,500 per troy ounce, hitting a record $3,534 on August 8, before pulling back slightly.
Analysts say the rally was driven by both the tariff announcement and gold’s safe-haven appeal amid escalating trade tensions and geopolitical uncertainty.
Some traders described the CBP’s decision as “shocking” and possibly mistaken, predicting legal challenges ahead. The lack of clarity has already caused certain shipments to freeze in transit.
---
The Critical Role of Switzerland in Bullion Logistics
Global bullion trade depends on a triangular supply chain:
Raw gold refined in Switzerland Cast into kilo bars for the U.S. market or 400-ounce bars for London Delivered to satisfy Comex contracts and central bank reserves
This logistical network is now under threat. UBS strategist Joni Teves has questioned whether U.S. gold futures trading can remain viable if tariffs on deliverable products persist.
The Swiss Precious Metals Association noted that the CBP’s clarification applies to all 1kg and 100oz gold bars imported into the U.S. not only those from Switzerland — raising the stakes for global trade flows.
---
Negotiations and Uncertainty Ahead
Switzerland continues to negotiate with Washington to reduce the tariff burden, but uncertainty remains.
The White House is reportedly preparing a clarification on the bullion tariffs that could determine whether the market stabilizes or faces prolonged disruption.
Until then, gold industry players — from major banks to refining houses — are bracing for further volatility, both in pricing and physical supply chains.
---
Keywords: gold market news, Swiss gold bars, U.S. gold tariffs, Comex gold futures, bullion trade, Switzerland gold exports, precious metals refining, gold price surge, macroeconomic analysis.
Mirroring alts - FET weekly update August 10 - 16thFetch.ai (FET) is advancing within a multi-degree Elliott Wave alignment that mirrors the structures seen across many other altcoins. At the Cycle degree, price is in Wave 1; at the Primary degree, a completed 1–2 structure suggests that Wave 3 is now underway; at the Intermediate degree, the same 1–2 formation implies another Wave 3; at the Minor degree, price is currently in Wave 1; and at the Minute degree, price is in the late stages of Wave 3, which is likely to end inside the highlighted Fair Value Gap (FVG).
Once this smaller Wave 3 completes, a short-lived Wave 4 pullback is expected, followed by Wave 5 to finish Minor Wave 1. A deeper retracement into the 0.5–0.764 Fibonacci zone would then be possible as part of Minor Wave 2 before the next sustained advance. The structure remains bullish as long as key support levels hold.
From a sentiment and liquidity standpoint, funding rates are positive, indicating a bias toward long positions. The liquidity heatmap shows only limited liquidity above current price, while there is more liquidity resting below — a configuration that could allow for a quick liquidity sweep before continuation.
This chart pattern is notably similar to many other altcoin structures right now, reflecting the high degree of correlation within the crypto market. If Bitcoin confirms its own bullish wave count, these aligned setups could trigger synchronized breakouts. Conversely, a BTC rejection could weigh on all correlated altcoins, including FET.
In the broader macroeconomic context, the CME FedWatch Tool indicates a 88,9% probability of a Federal Reserve rate cut at the September FOMC meeting. Markets often front-run such decisions, and this could act as a catalyst for impulsive Wave 3 rallies across crypto. However, heavily skewed bullish sentiment increases the risk of a “sell-the-news” event if traders over-leverage ahead of the announcement. Institutional accumulation likely occurred earlier in the cycle, leaving retail traders to drive the next legs higher.
As long as structural support remains intact and the anticipated Wave 4–5 sequence plays out, FET appears well-positioned for continuation — in alignment with the bullish setups currently visible across much of the altcoin market.

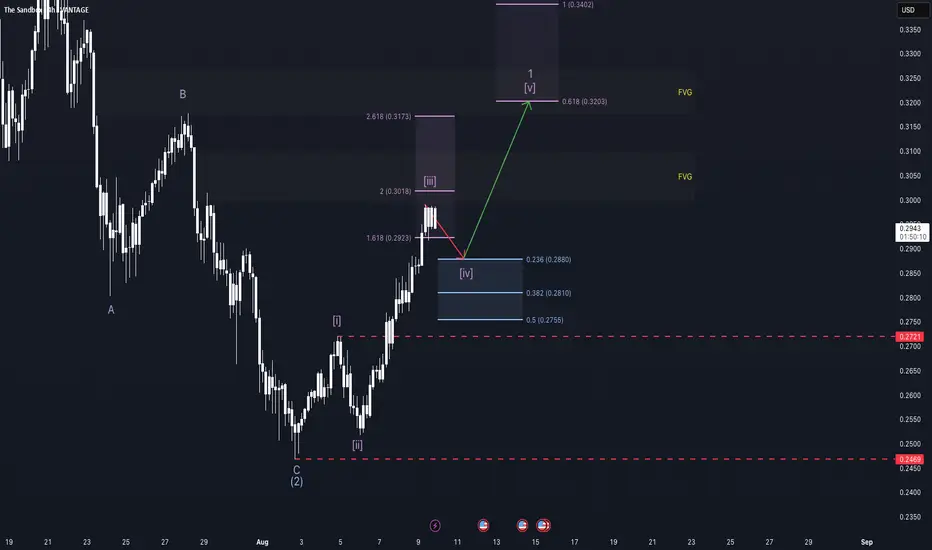
Undecided. - SAND/SAN weekly update August 9 - 15thThe Sandbox (SAND) is currently advancing within a strongly aligned Elliott Wave structure. At the Cycle degree, price is in Wave 3; at both the Primary and Intermediate degrees, it is also in Wave 3; and at the Minute degree, the market is completing a smaller Wave 3. From a Smart Money Concepts perspective, it would make sense for price to dip into the lower highlighted Fair Value Gap (FVG) before continuing higher, as this aligns with key Fibonacci retracement levels. Even a quick wick into this zone would be sufficient to rebalance price before continuation.
Following this potential retracement, the structure anticipates a short Wave 4 followed by Wave 5, which is projected to terminate in the upper FVG marked on the chart. This interpretation fits well with the overall bullish macro structure. However, if Wave 4 were to drop below the top of Wave 1, the current count would be invalidated. A move below the start of Wave 1 would raise the probability that the current advance is part of a more complex corrective structure rather than a sustained impulse.
From a derivatives perspective, funding rates remain positive while open interest is stagnating, indicating steady but not accelerating long participation. The liquidity heatmap shows significant liquidity resting below the Wave 2 low, which could act as a magnet for a short-term sweep before continuation.
On a broader level, this setup aligns with the macroeconomic backdrop. The CME FedWatch Tool currently shows a 88.9% probability of a Federal Reserve rate cut at the September FOMC meeting. Such expectations often lead to markets front-running the event, potentially fuelling impulsive Wave 3 rallies across the crypto sector. However, if bullish positioning becomes excessive, the risk of a “sell-the-news” reaction or a liquidation event increases — particularly in assets like SAND, which are already in extended third waves. Institutional positioning likely occurred earlier in the cycle, leaving retail traders to provide the momentum for the next legs up.
As long as key support levels hold and the lower FVG provides the anticipated reaction, SAND remains well-positioned for a continued advance toward the 0.320–0.340 range, with multiple wave degrees supporting the bullish case.
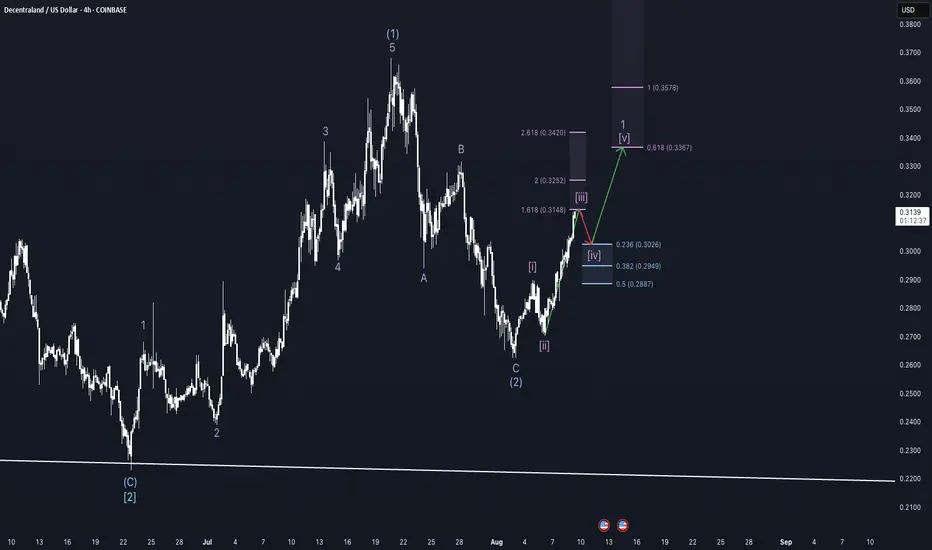
Third-Tier action - MANA weekly update August 9 - 15thDecentraland (MANA) is currently advancing within a strongly aligned Elliott Wave structure. At the Cycle degree, the market is in Wave 1; at the Primary degree, it is in Wave 3; at the Intermediate degree, also in Wave 3; and at the Minor degree, in Wave 1. At the Minute degree, price is in the late stages of Wave 3. This smaller Wave 3 is approaching a bearish Fair Value Gap (FVG), which could act as resistance and mark the short-term top of this wave. Interestingly, the projected target for Wave 5 also aligns with a higher-level bearish FVG, adding structural confluence to the broader setup.
While the overarching wave alignment remains bullish, there are a few elements to monitor closely. Funding rates are positive but leaning slightly toward the negative, suggesting a mild sentiment shift, while open interest continues to rise, indicating stronger market participation. However, the liquidity heatmap reveals a significant concentration of liquidity below the current price, which weighs against the immediate bullish continuation, as such liquidity often attracts short-term sweeps before the trend resumes.
Market psychology could also play a major role in the next move. With Ethereum currently rallying strongly, there is a plausible rotation scenario: once ETH reaches a key resistance level and slows down, capital may rotate into second- and third-tier altcoins like MANA, accelerating their upside moves. Such rotations often coincide with euphoric retail behaviour, which can amplify both gains and volatility.
From a macroeconomic perspective, this setup is further supported by expectations surrounding the upcoming September FOMC meeting. The CME FedWatch Tool currently shows a 88.9% probability of a Federal Reserve rate cut. Markets tend to front-run such events, and this expectation could fuel bullish momentum into Wave 3 moves across the crypto sector. However, with sentiment leaning heavily bullish, there is also the risk of a “sell-the-news” reaction, especially if leveraged longs pile in too aggressively ahead of the announcement.
Institutional positioning appears to have taken place earlier in the cycle, as evidenced by order block formations near the end of prior corrective waves, leaving retail traders to drive the next leg higher. This dynamic often defines the acceleration phase of a third wave.
As long as key support levels hold and the structure remains intact, MANA’s multi-timeframe alignment suggests that the next impulsive rally could be substantial — though traders should remain mindful of the liquidity resting below, which could trigger a temporary shakeout before continuation.
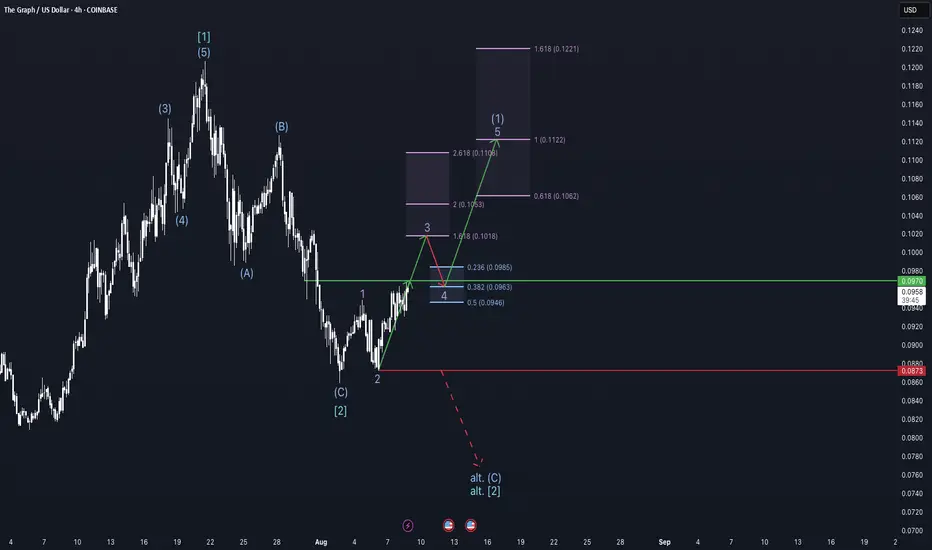
Chasing new highs - GRT weekly update August 8 - 14thThe Graph (GRT) has formed two higher-degree 1–2 setups — one at the Cycle degree and one at the Primary degree — creating a structurally bullish foundation. At the Intermediate degree, price is currently advancing in Wave 1, while at the Minor degree, it is in Wave 3, the most dynamic phase of an impulse. This alignment of early waves across degrees suggests a potentially strong continuation if key resistance levels are broken.
The immediate bullish confirmation comes from a break above the $0.097 resistance, which would open the door for a sustained rally toward the $0.106–$0.122 zone, based on Fibonacci extensions. However, there is an alternative scenario: if the market fails to clear $0.097 and sells off, breaking the $0.0873 support, it would indicate that Intermediate Wave C and therefore Primary Wave 2 are not yet complete. In that case, a final low to complete the larger correction would be expected before the uptrend resumes.
From a sentiment perspective, funding rates are positive, and open interest is rising, showing increasing long exposure. The liquidity heatmap reveals significant liquidity resting below current price, with only minor clusters above — a configuration that could invite a short-term liquidity sweep before continuation.
This setup also needs to be viewed in the context of broader macroeconomic conditions. For much of this year, capital inflows into crypto were limited by the Federal Reserve’s restrictive monetary policy. However, the CME FedWatch Tool now shows a 89.1% probability of a rate cut at the September FOMC meeting. Markets tend to front-run such events, and this expectation could fuel Wave 3 advances across the crypto sector. But with anticipation running high, there is also the risk of a sell-the-news reaction, particularly if retail traders over-leverage into the move.
It’s worth noting that this structure in GRT closely mirrors many other altcoin charts at the moment — a sign of high correlation within the crypto market.
As long as the $0.097 resistance is broken and the $0.0873 level remains intact, the probability favours the bullish scenario — with a multi-degree Wave 3 advance potentially underway, fueled by both technical structure and macro catalysts.
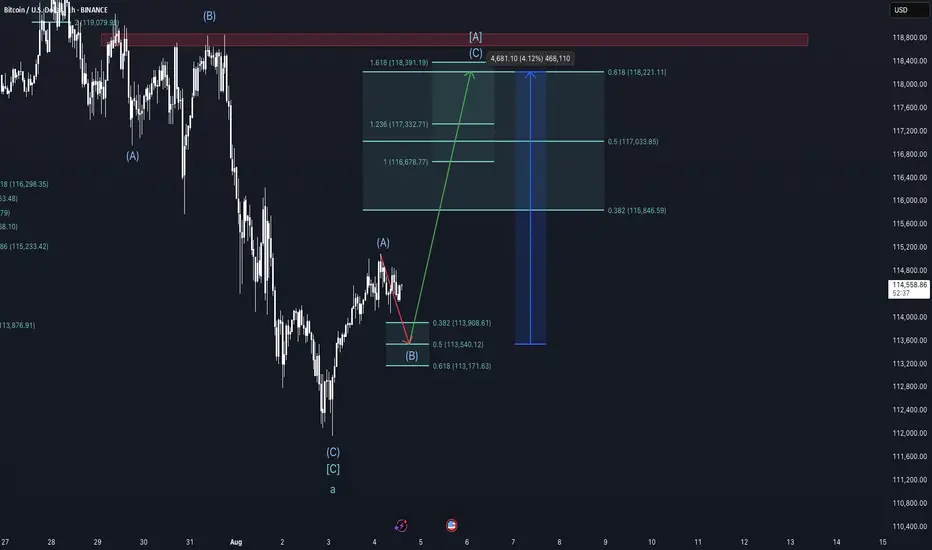
Bear trap on its way - Bitcoin Weekly Update August 4-10thThis week brings a series of macroeconomic and geopolitical developments that may influence global risk sentiment and, consequently, Bitcoin’s price trajectory.
On Monday, the U.S. releases Factory Orders, a key indicator of industrial demand. Surprises in this data can affect risk assets broadly, as they reflect business investment activity. Weak numbers would likely increase expectations of monetary easing, which tends to support Bitcoin.
On Tuesday, the spotlight turns to the ISM Non-Manufacturing PMI, a leading indicator for the U.S. services sector, which accounts for roughly 70% of GDP. A significant deviation from expectations—especially a decline—could reinforce rate-cut expectations and provide tailwinds for speculative assets like Bitcoin.
Thursday is a critical day, with the Bank of England's interest rate decision in focus. While direct effects on crypto are limited, a hawkish stance could weigh on global risk appetite if inflation concerns resurface. Also on Thursday, the U.S. releases its weekly Initial Jobless Claims—a timely barometer of labor market strength. A rising trend here would suggest economic cooling, strengthening the case for looser policy and potentially benefiting crypto.
However, the most geopolitically sensitive event this week is the reintroduction of country-specific reciprocal tariffs by the United States, taking effect on August 7. Affected countries include Canada (35%), Mexico (30%), and Brazil (50%). These measures could re-escalate trade tensions and trigger short-term market volatility. Retaliatory responses from these countries would likely fuel risk-off sentiment, pressuring assets across the board.
From a technical standpoint, Bitcoin remains within a multi-degree corrective structure according to the Elliott Wave framework. On the cycle degree, we are in a B-wave; on the primary degree, in an A-wave; on the intermediate degree, in a B-wave; and on the minor degree, in a C-wave. This implies that a short-term move lower is still expected, but once complete, a relief rally of approximately 4% could follow before the onset of a larger correction, likely Primary Wave B.
Chart structure suggests that Minor Wave C is in its late stages. Early signs of exhaustion, such as waning downside momentum or bullish reaction at key support zones, could offer clues of an approaching bottom. However, such a rebound should be viewed as temporary and not a trend reversal.
Taking a view between the lines on the on-chain data, the liquidity heatmap shows major liquidity around the red rectangle drawn into the chart, suggesting higher prices. Also, the rather low funding rate on futures suggest an exhausted downward trend and a trend reversal in the near future is likely.
Conclusion:
This week’s calendar offers several macroeconomic catalysts with the potential to move markets. U.S. economic data and tariff policy developments will likely shape near-term sentiment. Technically, Bitcoin remains in a corrective phase with limited downside left before a short-term recovery becomes more probable. Traders should stay alert for signs of a local bottom to position for a tactical bounce—but be cautious, as a larger correction likely looms beyond that.
This is no financial advice and for educational purposes only.
Tariffs, Trade Deals, & Central Bank Watch: Key Week in MarketsCME_MINI:NQ1! CME_MINI:ES1! CME_MINI:MNQ1! COMEX:GC1! CME_MINI:MES1! NYMEX:CL1!
This is a significant week in terms of macroeconomic headlines, key data releases, central bank decisions, and major trade policy developments. We get numbers for growth, inflation and decision and insights into monetary policy. Combining this with ongoing trade policy developments, we have a key week which may shape how the rest of the year unfolds.
Below is a consolidated summary of the latest trade negotiations, scheduled economic releases, and policy outlooks.
US - EU Trade Deal:
• US–EU Tariffs: The US will impose a 15% tariff on most EU goods, including cars, semiconductors, and pharmaceuticals, but retain a 50% tariff on steel and aluminium with a new quota system.
• Exemptions: Zero-for-zero tariffs agreed for agriculture, aircraft parts, and chemicals; aircraft exports are temporarily exempt.
• EU Commitments: The EU will invest $600 billion in the US and purchase $750 billion in US energy, mainly LNG.
• Agriculture: The EU will lower tariffs on many US agricultural goods, though not comprehensively.
• Political Reactions: EU leaders are mixed, Germany and the Netherlands praised the deal, France called it unbalanced, and Hungary viewed it unfavorably.
• The deal is not final until it is ratified by all EU national parliaments and the EU Parliament.
China Talks: US and China expected to extend their trade truce by 90 days. US-China meeting expected in Stockholm on Monday and Tuesday. Trump to freeze export controls to secure a deal. A group of US executives will visit China for trade discussions, organized by the US-China Business Council.
South Korea Trade Talks: Korea proposes a shipbuilding partnership with the US and is preparing a trade package.
UK–US Relations: PM Starmer and Trump to meet in Scotland to discuss the UK–US trade deal implementation, Middle East ceasefire, and pressure on Russia.
Thus far, the US has announced trade deals with the UK, Vietnam, Philippines, Indonesia, Japan and The EU. Trade delegations are working to finalize deals with China, Mexico, Canada
Key Economic Data Releases:
Monday: Treasury refunding financing estimates.
Supply: 2-Year and 5-Year Note Auction, 3 & 6-Month Bill Auction
Tuesday: US Advance Goods Trade Balance, Wholesale Inventories Advance, CB Consumer Confidence, JOLTS Job Opening (Jun), Atlanta Fed GDPNow, Australian CPI Q2
Supply: 7-Year Note Auction
Wednesday: German GDP Q2, EUR GDP Q2, US ADP Non-farm Employment, US GDP Q2, Crude Oil Inventories, Chinese Manufacturing PMI
Canada: BoC Interest Rate Decision, Rate Statement, Monterey Policy Report, BoC Press Conference
US: Fed Interest Rate Decision,FOMC Statement, Fed Press Conference.
Japan: BoJ Interest Rate Decision, Monetary Policy Statement
Thursday: EU Unemployment (Jun), US PCE & Core PCE Price Index (Jun)
Japan: BoJ Press Conference
Friday: EU CPI, US NFP, Unemployment Rate, Average Hourly Earnings, ISM Manufacturing PMI, Michigan 1-Year & 5-Year Inflation Expectations.
It is also a busy earnings week. See here for a complete earnings schedule .
Markets are interpreting trade deals as positive news thus far. The dollar is strengthening.
As we previously mentioned, we anticipate no rate cuts this year as economic data proves to be resilient and inflation largely under control. WSJ also posted an article stating that most tariffs costs are being absorbed by companies due to weaker pricing power. We previously wrote about this on our blog: “ In our analysis, the inflation impact of tariffs may not show up until Q4 2025 or early 2026, as tariff threats are mostly used as a lever to negotiate deals. While effective tariff rates have increased, as Trump reshapes how tariffs are viewed, cost pass-through to consumers will be limited in Q3 2025, as companies’ front-loaded inventory helps mitigate the risks of increased tariff exposure.
So, what we have is an interesting development shaping up where, while inflation may rise and remain sticky, it is yet to be seen whether slowing consumer spending will weaken enough to the point where companies must start offering discounts, which would nullify the tariff risk to the end consumer and result in companies absorbing all tariffs. This scenario will see reduced earnings margins leading into the last quarter and early 2026. However, it will materially reduce risks of higher inflation.”
In our view, the US dollar has a higher probability to rally in the short-term i.e., Q3 as markets re-align FX rate differentials. Bond yields stabilize, Equities continue pushing higher, while Gold retraces as previously mentioned. This in our view, is what investors and participants refer to as the Goldilocks scenario. If this plays out as expected we anticipate continued strength with AI, tech, energy and defense sectors outperforming into mid- 2026.
Institutional View: Morgan Stanley
Morgan Stanley also sees no rate cuts in 2025, despite market pricing for two 25 bps cuts. They forecast more aggressive cuts in 2026 due to:
• Tariff-related inflation emerging before labor market deterioration
• Slowing US growth, as fiscal support fades
• Impact of tighter immigration policy and global trade realignment
That said, MS continues to cite longer-term risks to the dollar, including:
• Twin deficits (fiscal + current account)
• Ongoing debate around USD’s safe haven status
• USD hedging activity picking up by international investors
• Strained credibility of the Fed due to tension between Fed Chair and the US Administration
How Fed policy evolves in Q4 2025 and Q1 2026 will depend heavily on the incoming Fed Chair nominee, who is expected to replace Jerome Powell in May 2026. This nomination could significantly influence future policy direction around growth and inflation targets.

Semiconductors & SOXL: A Bull ThesisWhy Semiconductors?
Virtually every single electronic device contains some form of a semiconductor unit within its components. The entire Bull theory on semiconductors as an industry could be reduced to this one sentence. The following, however, will introduce concepts contingent to the understanding of what is shaping the market for semiconductors. The weight of intra-industry, political, macroeconomic, and physical factors discerning an inconceivable upside potential for certain investments carrying maximum exposure to the sector, such as AMEX:SOXL . The last section contains my technical approach to trading SOXL.
We begin with the fundamental, and by fundamental, I refer to the simplest reasons for what is happening in the market up until now; [ Early morning Monday, 7/28 ].
Macroeconomic Context
Like essentially the rest of the market, SOXL hit its 1 year low of 7.23 USD on Monday, 4/7, following the announcement (and soon postponement) of global tariffs at levels not observed since the early 30's. This of course sparked a panic spiral in the entire market, leading to outflows from the S&P 500 of approximately 70 billion USD during the month of April. During this time we also saw a new, but familiar narrative emerge. Asset Managers, Such as J.P. Morgan set historically low price targets on the S&P 500, going as low as 5,200 USD. They reinforced their PTs with publications warning investors across the world that the risk of recession in the United States was raised to 80%, and this message was relayed across all media in parabolic fashion. While it does not seem too outward to assume an increased risk of recession due to tariffs by looking back on what we learned of the consequences from the Smoot-Hawley Tariff Act of 1930. There exists a widely overlooked, fundamental , reason as to why I can claim that the REAL risk of recession at the time that J.P. Morgan assigned an 80% risk of recession, was in actuality, 0% (I assume J.P. Morgan knew this but pushed the narrative anyways in order to acquire massive equity at a discount). If anyone has taken introductory macroeconomics in their lifetime, they may be familiar with the function for calculating GDP via the expenditure approach: GDP = C + I + G - NX. Now, why am I referencing high school/college economics basics, the answer to that lies in how we determine our rate of economic growth in the context of tariffs. The part of this formula that we must focus on is NX or Net Exports, the negative factor to GDP. Tariffs, if implemented would effectively decrease import volume, resulting in a smaller Net Exports, and ultimately a higher GDP calculation. Now, what makes this scenario unique, the tariffs having been postponed shortly after their inception, allowed US retailers to engage in front running, or the accelerated purchasing of foreign goods in advance of tariffs. During the month of April, we saw a 5.4% increase in import volume in US west coast ports. This increase in imports effectively caused the inverse impact on GDP growth that import tariffs themselves would have caused: front-running lead to import uptick, leading to a greater Net Exports, which results in lower (negative) GDP growth. Essentially, tariffs in the short-term increases GDP growth (in the long term deadweight loss, and cost structure distortion comes in to play, but that doesn't matter yet), however , tariffs that are announced but not immediately implemented will result in a lower GDP growth, coupled with uncertainty surrounding the whole situation that translated into a cut in CapEx as companies scrambled to determine if tariffs would f*ck them over or not. This argument is further supported by the trends observed in the foreign exchange market. You may have heard in the news that we are experiencing a period of "Dollar Weakness", and while, yes, you can clearly see that the USD has fared rather poorly against other currencies in most major dollar pairs over the past few months. The agent behind this isn't just that the dollar happens to be weak, it is a combination of factors that generate noise and volatility in the forex market. The two main factors highlighted by the media are 1. The obvious political policy instability, pushing bond yields higher, plus a significant debt ceiling raise as per the BBB and 2. the expectations of interest rate cuts over the next year. The other, less recognized major factor to dollar weakness is exactly what we described above: Increased imports means more dollars flowing out of the economy. When these dollars land abroad, they are converted into the native currency, driving down the demand for the dollar. Notice how none of the reasons described above, actually have anything to do with what truly drives foreign exchange markets. Over time, the strength/weakness of a currency is directly correlated to the strength/weakness of the underlying economy. To say that we can expect dollar weakness due to the aforementioned reasons outright ignores the economic growth potential that exists in our economy at this current time, subsiding the out-of-proportion tariff fears as a proponent to an economic crisis. In an all-encompassing view, what I would describe to be occurring on the macro level is a sort of "slingshot" effect: Trade imbalances and private sector response to policy unclarity results in a pullback in economic growth, one that we are now experiencing as a short-term effect. From a medium-long term perspective, assuming that tariffs aren't persistent in the long term, we would see full fledge economic boom, driven by non other than the growth of our technology sector, which at it's core, lies the almighty semiconductor.
Growth of AI as a driver of Semiconductor demand: Stable trajectory or Bubble Territory?
Having laid the economic framework for picking the general direction our market is heading in, we can now begin to talk about the internal combustion occurring within the world of technology, and the two letter term associated with just about every cool thing in the business world, that is of course AI. Now just to clarify, AI is not new, its been around for at least 20 years and has a well established role in the world prior to the existence of ChatGPT. What changed so drastically in recent years is the breakthrough into a new form of artificial intelligence, known as "Artificial General Intelligence" or AGI. Long story short: AGI's primary difference in the business context is the colossal amount of electrical infrastructure and computing power that is demanded by the development of these mega language models. As a result of the high barrier for entry to this new industry, only 5 AGI companies have arisen to the global stage: OpenAI, Google DeepMind, Anthropic, Microsoft, and DeepSeek. Increasing competition in this space through more players entering the market is unlikely at this time as the cost to create a standalone AGI model is so astronomical. This is a particularly good thing because it tells us that AGI as an industry can result in natural monopolies. The ultra-intensive RnD costs and Data Center infrastructure demands make it more sensical to have a greater number of resources dedicated to producing 1 AGI model, instead of dividing resources to develop multiple less optimized models (similar to how a water company holds a natural monopoly as competition in that industry would result in no foreseeable benefit to it's customers). A further effect from this dynamic lies in how businesses in this industry scale to expand, and its pretty straightforward: the more megawatt computing power a model can access, the more parameters a model can account for, and the more vast the dataset that model can train on, with enhancing speed and efficiency (GPT 4o takes into account >500B parameters in a given query). We see the concept of natural monopoly playing out as the concentration of market capitalization is becoming more extreme where firms like Google, Microsoft, and NVIDIA are absorbing larger share of the market, while trading at ever increasing Price/Earnings multiples. To many, this reflects a trend we saw during the dot com bubble, however what makes the AGI industry different is the nature of the good or service provided. During the dot com boom, companies saw speculative value based on only the fact that their business existed on the .com domain. We know that each of these businesses are unique, providing a good or service across whatever industry they were part of, the only thing having in common was that dot com. The major oversight that took place during the turn of the dot com era was that the success of these businesses wasn't in truth due to them ending in .com, but whether the idea, and execution behind the underlying business is strong or not. Like how Amazon and Facebook saw unparalleled success not just because they were .coms, but because they were pioneering business models that would attract global demand to the services they were providing. The business of AGI has a sort of homogenous property. All AGI companies produce a service that is extremely similar in nature, the only ways they can compete with one another is through Capital Expenditure towards harnessing more computing power. This is the main reason capital is concentrating in a handful of companies trading at high multiples. To me, this is not an indication of a tech bubble but rather a product of how the AGI industry is poised to grow within our economy.
AGI as a Factor of Production
To get even more philosophical, we can think about how AGI itself enhances economic growth. We already see AGI tools applied in various ways, but the most widespread application pertains to the enhancement of human capital. While it is possible to make AGI models complete ongoing tasks completely on their own with zero human input, its far more common to see AGI tools be used, well, as tools. What I mean is that firms are not looking to replace human workers with AI ones (certain exceptions may include the manufacturing industry), instead they want to integrate AGI tools into their workforce as a means of optimizing regular processes, allowing them to access and process information with tremendous efficiency. The most observable economic outcome of this is firms being able to cut costs in human capital requirements, allowing them to achieve the same level of workflow with a smaller number of employees, or outsourcing solutions to business processes by way of automation utilizing AGI. The possibilities are endless and the economic impact of AGI appears to write itself new economic theory to explain how business growth is accelerating in unprecedented ways.
Semiconductor Physical Limitations: Blessing or Burden?
In 1965, Gordon Moore articulated his observation which would come to be known as Moore's Law. He observed that the number of transistors in an integrated circuit doubles approximately every 2 years. Based not so much on law of physics, Moore's law describes an empirical relationship between time and the number of transistors per chip, suggesting that the rate of production advancements would allow for such doubling to occur on a biannual basis. And to Gordon's own surprise, he was right. Transistor count for a given chip roughly doubled every 2 years for the following 50 years. However, Gordon also predicted that Moore's Law would come to an end in 2025, where transistor sizes would reach the physical limit of 2 nanometers (10-15 silicon atoms in width). While it may appear as a bottleneck to the semiconductor and AI industry, not being able to fit anymore transistors on one chip, but in reality, this limitation pressures companies to pursue innovations such as semiconductor packaging, which is NVIDIA's bread and butter. This technique allows for the stacking and integrating of many different chips to perform together as one. This technology has already proven wildly successful and is the backbone to virtually all of NVIDIA's GPU products. Google has invented their own method to getting around the physical limitation of silicon chips, producing AI-specialized integrated circuits known as Tensor Processing Units (TPUs). Catering these innovative solutions to expanding the frontier of AGI is almost a given.
How to play this market: A Technical Approach
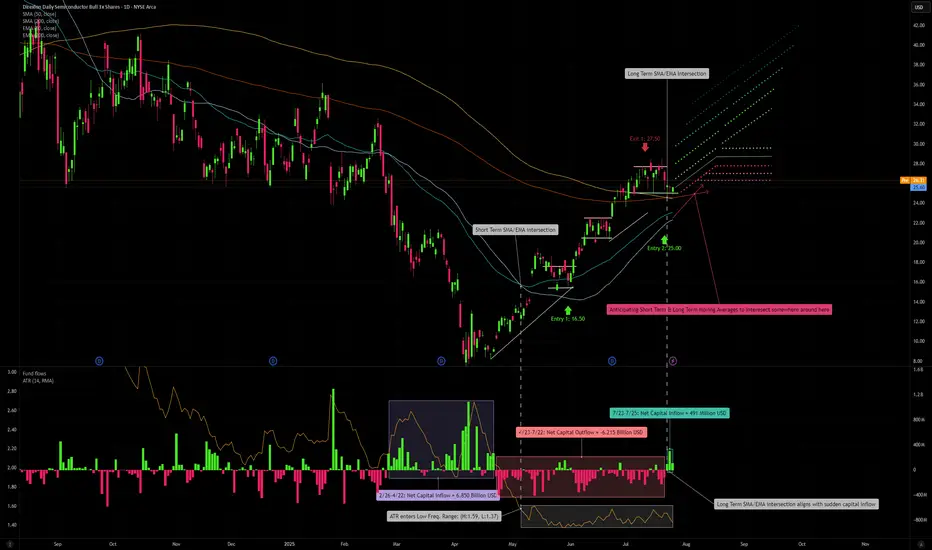
If you have made it this far, I commend you. The following describes my approach to analyzing price activity in SOXL:
My First entry into SOXL took place on 5/30 with a unit cost of 16.50 USD. Two things can be noted prior to this entry. 1: Fund flows during late February, into March, and through April were extremely high, net inflow of 6.85 Billion USD, however price movement did not reflect the huge inflow until late April/early May where we began to see upward price direction. The beginning of June marked the start of the market bull rally which consolidated into our current price range of 25-28 USD, following contingent earnings releases of NASDAQ:ASML , NYSE:TSM , NASDAQ:NXPI and NASDAQ:INTC . The most recent pullback was a combination of a slightly concerning outlook from ASML, stating that tariffs on the EU would negatively affect projected sales growth for the 2026 fiscal year. As for TSM, there is not one concerning thing that could be said regarding the state of its business growth other than the New Taiwan Dollar gaining considerable strength over the USD amid trade relations between the US and Taiwan, affecting TSM's gross margin by an estimated 6%. NXPI released a sub par earnings and revenue growth outlook, but in my opinion this is not to be too heavily objectified as NXPI produces chips primarily for the Automotive sector, thus making it's sales heavily contingent on supply chain issues being faced by automotive manufacturers in leu of tariffs. NXPI carries a 3.5% market share in semiconductors whereas TSM carries a 68% market share. Lastly, INTC, earnings release I am almost embarrassed to talk about. If it were up to me I'd say they sell their plants in Ohio to TSM and look into opening a fruit stand instead. The most important earnings releases have yet to come though. NASDAQ:MSFT is just around the corner on 7/30, and NASDAQ:NVDA announces on 8/27. These two earnings reports will carry major weight in hinting the overall direction, momentum the market sees in AI demand growth, and the technology sector as a whole. Speculating, I have high expectations that both MSFT and NVDA will top all estimates, pushing the bar higher for 2025 into 2026.
If we look at our short-term 50-day SMA/EMA, you will notice a crossover occur on 5/6, a minor indication of a short term positive trend. Alone this is insignificant, but if we look at our 14-day Average True Range, we can see that this crossover aligns with a fall in ATR that would persist between the values of 1.37 and 1.59. This low ATR value signals that trailing volatility is actually quite low for semiconductors, considering the currently mixed market sentiment. Further along we see that price has crossed above both our long-term, 200-day SMA/EMA and a crossover occurred between the two on 7/23, serving as a small indication of a positive long term trend. Once again, not super significant on its own, but you will notice that the convergence aligns perfectly with a sharp increase in fund inflows, netting 491 Million USD in a matter of 3 trading days. If we see a continuation of net inflows over the several days, we can expect a near future extension of our bull rally, a semi-cyclical wave of inflows that concentrate during consolidation periods (which we have seen take place in the current price range between 25-28 USD following my first exit at 27.50 USD). If we extrapolate both our short-term and long-term SMA/EMA, we can anticipate a crossover to occur in the coming days to weeks. If this occurred, that would further reinforce our expectation for a positive long term trend. I have already locked in my entry 2 with a limit order executed at 25 USD. If all of the above conditions are met, I would confidently predict that we may see SOXL trade at around 42 USD in the coming months.
One more thing I would like to note, if we zoom out to our 5 year historical price progression, we can identify the previous high of 70.08 USD occurring on 7/11/2024. We know that the bull rally which took place in July of last year can be attributed to the first realization of AI as a driver for semiconductor demand, combined with renewed interest in GPU technology for applications in crypto. If we compare AI-related Capital Expenditure in fiscal year 2024 to AI-related Capital Expenditure of the first half of 2025 fiscal year: 246 Billion USD made up AI-related CapEx for all of 2024, vs first 6 months of 2025, adding up to 320 Billion USD. That is a 30% increase in capex, and we still have another 5-6 months to go. Just some food for thought.
Do you believe all of the above has been priced into SOXL, leave your thoughts in the comments!
Disclaimer
You must obviously keep in mind, SOXL is a 3x leveraged ETF, you can expect volatility with such type of investment. However, in capturing a bullish market, a 3x leveraged investment may produce greater than 3x the returns as the underlying (non leveraged) assets, due to the effect of compounding growth of returns over time. However, the same is true for sideways, or bearish markets, losses may be amplified to greater than 3x. If this is an uncertainty you do not wish to be exposed to, I would opt for the non-leveraged Semiconductor ETF ( NASDAQ:SOXX ), or divide your allocation across the top 5-10 equity holdings of SOXL. Please remember to employ your OWN due diligence before making any investment decision, as none of what I am saying shall serve as financial advise to you, the reader.
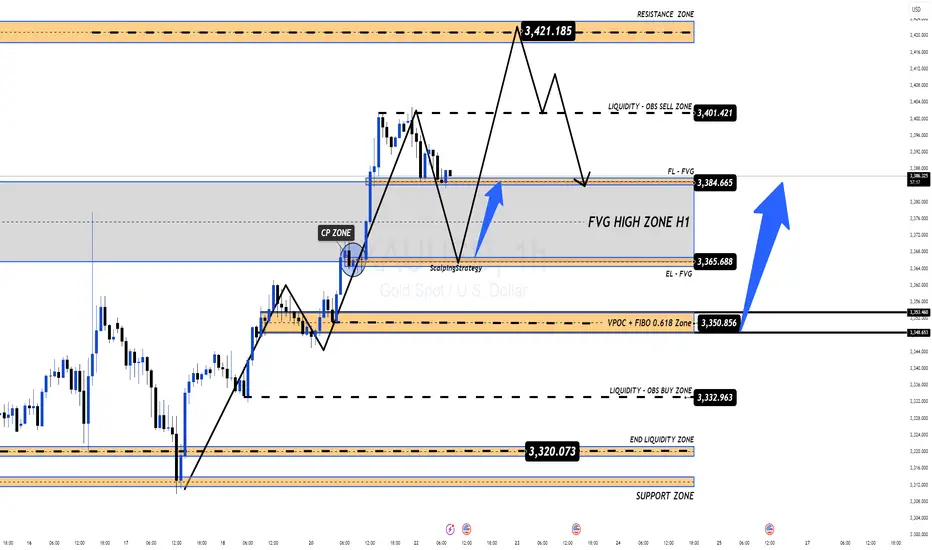
Gold 22/07 – Reversal in Sight After $3400? Watch These Key Zone XAUUSD – Intraday Market Outlook (22/07)
Gold posted a strong rally in the previous session, completing its short-term impulsive wave structure. However, as price approached the psychological resistance at $3400, it began to lose momentum, and a clear reversal candle appeared — a signal that today’s session may favour a pullback or correction.
🔍 Technical Overview
After printing a short-term top, gold is now retracing and has reached a critical support area: the FVG High Zone on the H1 chart. If bearish pressure continues and this level fails to hold, price is likely to drop further in search of deeper liquidity zones.
🔽 Key BUY Zones to Monitor Today
✅ Zone 1 – EL (End Liquidity within FVG): 3367 – 3350
→ A zone with strong potential for short-term rebounds due to previous liquidity sweeps.
✅ Zone 2 – Confluence of FIBO 0.5–0.618 + VPOC (3350 – 3335)
→ A technically significant area where multiple factors align — ideal for medium-to-long term entries.
📌 Trade Setup Ideas
🔸 BUY ZONE: 3351 – 3349
Stop Loss: 3344
Take Profit Targets:
3355 – 3360 – 3365 – 3370 – 3375 – 3380 – 3390 – 3400 – ???
🔸 BUY SCALP ZONE: 3366 – 3364
Stop Loss: 3360
Targets: 3370 – 3375 – 3380 – 3385 – 3390
🔻 SELL ZONE: 3420 – 3422
Stop Loss: 3427
Targets: 3415 – 3410 – 3405 – 3400 – 3390 – 3385
⚠️ Market Risk Reminder
While no major economic data is expected today, that doesn’t mean the market will stay calm. Unexpected volatility can still arise from geopolitical tensions or unscheduled central bank comments. Gold tends to compress and break out aggressively in low-news environments.
📌 Protect your capital with disciplined Stop Loss and Take Profit levels — no forecast is ever 100% certain.
📈 Strategic Outlook
Short-term bias: Market is likely to continue correcting
Medium to long-term plan: A deeper pullback could offer an excellent opportunity to build long positions from key demand zones, especially as markets begin to price in potential Fed rate cuts and gold continues its long-term bullish trend.
💬 Be patient, wait for confirmations, and trade with a clear plan — that’s what separates consistency from chaos.
XAU/USD Start July 20251. i start after XAU/USD break previous High and correction (fibbo 32.0) respected. based on elliot wave strategy we can targeting end of wave 3 at 3353 area and than correction wave 4 (target at fibbo 32.0 - 50.0). after target correction, continue wave 5 at target 3403 area.
2. fundamentally speaking, new months new quarter. there ins't new catalist and sentiment. Macro Economic this week focus on labour market at US and FED projection to cut rate.
3. War at Iran and Israel, Russia and Ukraine, India and Pakistan, Trade War case, etc,.
4. Will be update

GBP/JPY: A Key Short Setup Forms as Momentum FadesHello traders,
Taking a look at GBP/JPY on the 4-hour timeframe. After a significant run, the price action has stalled, and we're seeing clear signs of fading momentum. This is creating a well-defined consolidation zone, which may present a key opportunity for a short position.
The Technical Picture 📊
1️⃣ Price Consolidation: GBP/JPY is currently trading sideways within a tight range, highlighted on the chart. This period of indecision and balance between buyers and sellers often precedes a significant directional move. The structure suggests a phase of distribution may be underway.
2️⃣ Fading Momentum: The Relative Strength Index (RSI) confirms this loss of momentum. A sustained reading below the 50 midline would signal that sellers are beginning to gain control and that the path of least resistance is shifting to the downside.
The Strategy 🧠
The core idea is to anticipate a bearish breakdown from the identified consolidation zone. A clean break and hold below this range would serve as confirmation that sellers have taken over, providing an opportunity to enter a short position targeting a continuation of the larger bearish move.
Trade Parameters 📉
👉 Entry: 198.895
⛔️ Stop Loss: 201.405
🎯 Take Profit: 192.872
Risk/Reward Ratio: approx. 2.4
This is my personal analysis and perspective, not financial advice. Always conduct your own research and manage your risk accordingly.
Good luck, and trade safe.
