S&P500 crashes! Due relief rally or further pain?Nvidia delivered impressive earnings, but the stock reversed and closed nearly 3% lower, triggering heavy selling across tech and risk assets as odds for a December rate cut have collapsed to just 34%, with policy uncertainty amplified by the cancelled October NFP report. Despite a strong market and rising unemployment in September's NFP report, traders remained defensive and fuelled the declines.
Key drivers:
Nvidia beat earnings, but post-report selling intensified sector losses.
The Fed’s odds for a December rate cut have dropped to 34%, amplifying caution.
The abrupt cancellation of the October NFP means the market lacks fresh labour data, fuelling defensive positioning.
S&P 500, Nasdaq, and Bitcoin broke major supports, confirming risk-off conditions.
Right now, the S&P 500 has broken below channel support near 6,600 and failed to climb back in. If prices stay below this threshold, expect another sharp move lower targeting 6,500 and possibly 6,350. There’s potential for upside, given momentum divergence on the RSI 4-hour chart. If we see a short-term bounce and a return to the channel, a move toward 6,682 is possible, which sets up a tactical short opportunity.
Trade idea:
Entry: Midpoint of 23.6/38.2 Fibonacci (6,655–6,682 area)
Stop-loss: Above 61.8% Fib (6,775)
Take Profits: TP1 6,500 (recent low/support), TP2 6,440 (major support), TP3 trail stop to 6,170 (long-term support)
Risk-off drivers are in control. Earnings reversals, Fed uncertainty, and cancelled NFP data are fuelling this price action. Technically, it comes down to whether we see a return inside the channel for a relief bounce or a sharp continuation downward.
Watch your levels, remain nimble, and let fundamentals and technicals, not emotions, guide your trade.
Let me know your setups in the comments, and follow for more high-action technical and macro trade ideas.
This content is not directed to residents of the EU or UK. Any opinions, news, research, analyses, prices or other information contained on this website is provided as general market commentary and does not constitute investment advice. ThinkMarkets will not accept liability for any loss or damage including, without limitation, to any loss of profit which may arise directly or indirectly from use of or reliance on such information.
Marketcrash

Is a Market Correction Coming? 10 Warning Signs You Can’t Ignore🚨 Markets look euphoric… but data says otherwise.
Hello @TradingView users, hope you are doing well
Here are 10 reasons why we think a sharp pullback could be near
(Not financial advice — just signals stacking up.)
1) Record yield-curve inversion: The 10y–2y spread was negative for a record ~783 days before ending in Sept 2024; such inversions have preceded every U.S. recession in recent decades.
2) Q1 2025 GDP dipped, Q2 rebounded: BEA shows real GDP fell in Q1 2025 (revised −0.6%), then rose +3.8% in Q2 2025. One more weak quarter would meet the “technical” definition, but Q2 strength complicates that path.
3) Cuts usually come with stress: Markets are pressuring the Fed to cut; historically, rate-cut cycles often start when growth/inflation risks tilt weaker (not typically in “booming” conditions).
4) LEI turned down again: After a tiny July uptick, the Conference Board’s LEI fell −0.5% in Aug 2025 and is −2.8% over the last 6 months, pointing to softer momentum (the “15+ straight months” stat is no longer current).
5) Valuations are stretched: The Shiller CAPE > 40, the highest since the dot-com era—historically linked to weaker forward returns.
6) Labor market showing cracks at the margin: Unemployment ~4.3% (Aug 2025) and job openings ~7.2M (Aug)—down from the 2022 peak—suggest some cooling, even if not severe. (I removed the unsourced “+35% layoffs” figure.)
7) Buffett’s record cash: Berkshire now holds roughly $381–$382B in cash & T-bills, an all-time high—interpreted by many as “waiting for better prices.” (Replaces the older $347.7B figure.)
8) Government shutdown risk/drag: The U.S. is in a prolonged federal shutdown (30+ days), with credible estimates of a material GDP hit if it persists—an added macro headwind.
9) Parabolic leaders, dot-com déjà vu vibes: Today’s rally is narrow and AI-led, and valuation gauges echo late-1990s extremes—a setup that can amplify drawdown risk on disappointments.
markets.businessinsider.com
10) Clustering of risks: Yield-curve history + LEI weakness + stretched valuations + policy uncertainty = elevated correction risk, even if timing is uncertain.
Please be cautious, more signals are starting to align, suggesting a potential market drop. From Warren Buffett holding significantly more cash, to the ongoing government shutdown, and even the recent sharp rally that mirrors patterns seen right before the dot-com bubble, the puzzle pieces are starting to fit together.
This message isn’t to cause panic, but rather to remind you to trade carefully and stay prepared either by keeping some cash ready to invest if the market drops, or by simply sticking to your existing long-term investment plan if you have any.
Comment below what YOU think, is this a healthy dip incoming or the start of something bigger?
@TradingView Appreciate it if you guys can feature this post so more traders and investors get the warning and stay safe if the drop happens.
Thank you
Alain M(Coach)
WTW Team
NYSE:DOW NASDAQ:NDX SP:SPX

Markets are flashing MAJOR warning signs…Markets are flashing MAJOR warning signs… NASDAQ:QQQ AMEX:SPY
In this video, we will look at the 21 ema on the Daily charts to review the move since April and where we could go from here.
If you have money in this market, you need to see this ASAP 👇

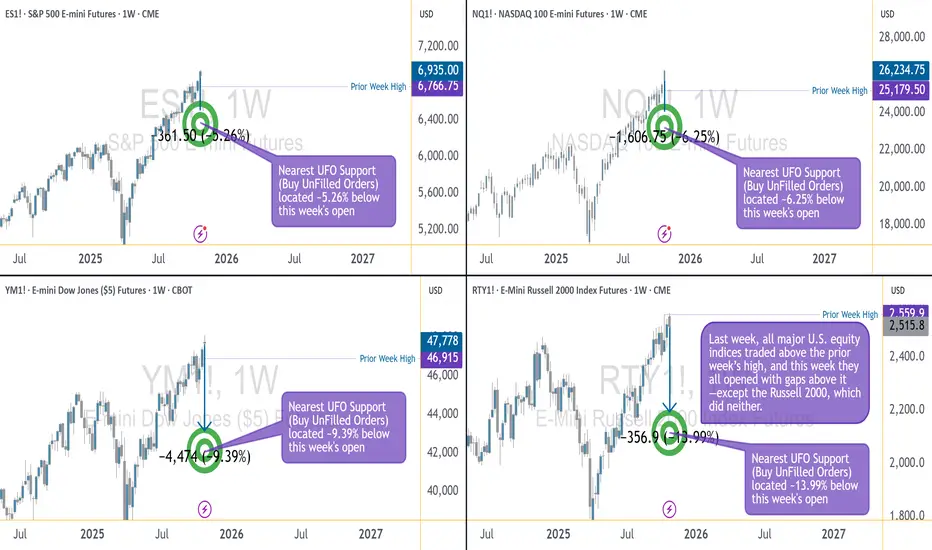
When Generals Run and Soldiers Nap — The Market’s Odd ParadeEver seen an army march where the generals sprint ahead, but the soldiers just yawn and stay behind?
That’s exactly what’s happening in the U.S. futures battlefield right now.
The ES, NQ, and YM — our large-cap “generals” — opened the week above their prior highs, looking ready for victory speeches. But the RTY, representing small caps, is still lagging like it hit the snooze button.
The Breadth Problem
Healthy rallies need everyone on board. When small caps don’t join the charge, it’s like running a marathon with only one leg — you might move forward, but not for long.
That’s why this gap between the big guys and the small ones is called bearish divergence — momentum without muscle.
How Deep Could It Go?
Under the surface, liquidity pockets (UFO supports) show the “landing zones” below price:
ES: ~5% lower
NQ: ~6% lower
YM: ~9% lower
RTY: ~14% lower (!)
Translation: if the market trips, the generals may bruise a knee — but the soldiers could roll down the hill.
Tick, Margin, and Scale
CME index futures come in two flavors — E-minis for the pros, Micro E-minis for precision control:
S&P 500 (ES/MES): tick 0.25 → $12.50 / $1.25; margin ≈ $21K / $2.1K
Nasdaq 100 (NQ/MNQ): tick 0.25 → $5 / $0.50; margin ≈ $30K / $3K
Dow Jones (YM/MYM): tick 1 → $5 / $0.50; margin ≈ $13K / $1.3K
Russell 2000 (RTY/M2K): tick 0.10 → $5 / $0.50; margin ≈ $9K / $0.9K
(Approximate numbers, educational only.)
The Lesson
Breadth divergences don’t “predict” the end of the rally — they just whisper: “Careful, this parade’s out of sync.”
So before chasing the next breakout, remember:
even the best generals can’t win a war if their soldiers stay in camp.
Want More Depth?
If you’d like to go deeper into the building blocks of trading, check out our From Mystery to Mastery trilogy, three cornerstone articles that complement this one:
🔗 From Mystery to Mastery: Trading Essentials
🔗 From Mystery to Mastery: Futures Explained
🔗 From Mystery to Mastery: Options Explained
When charting futures, the data provided could be delayed. Traders working with the ticker symbols discussed in this idea may prefer to use CME Group real-time data plan on TradingView: www.tradingview.com - This consideration is particularly important for shorter-term traders, whereas it may be less critical for those focused on longer-term trading strategies.
General Disclaimer:
The trade ideas presented herein are solely for illustrative purposes forming a part of a case study intended to demonstrate key principles in risk management within the context of the specific market scenarios discussed. These ideas are not to be interpreted as investment recommendations or financial advice. They do not endorse or promote any specific trading strategies, financial products, or services. The information provided is based on data believed to be reliable; however, its accuracy or completeness cannot be guaranteed. Trading in financial markets involves risks, including the potential loss of principal. Each individual should conduct their own research and consult with professional financial advisors before making any investment decisions. The author or publisher of this content bears no responsibility for any actions taken based on the information provided or for any resultant financial or other losses.
ADA/USDT | ADA’s Epic Comeback: 130% Pump After Brutal Selloff!By analyzing the Cardano (ADA) chart on the 3-day timeframe, we can see that, like the rest of the market — or even more severely — ADA faced a massive dump of over 65%, dropping below $0.275.
After a liquidity grab under that level, strong buying pressure emerged, driving the price up by 130%, reaching around $0.63. However, ADA still needs to rise about 30% more just to return to the level where this drop originally began.
This cryptocurrency remains highly promising, and if Bitcoin stabilizes above $110,000, we could expect the next bullish wave to begin for Cardano.
Please support me with your likes and comments to motivate me to share more analysis with you and share your opinion about the possible trend of this chart with me !
Best Regards , Arman Shaban

When Liquidity Dried Up — The True Story Behind the Oct 10 Crash█ We Actually Saw It Coming
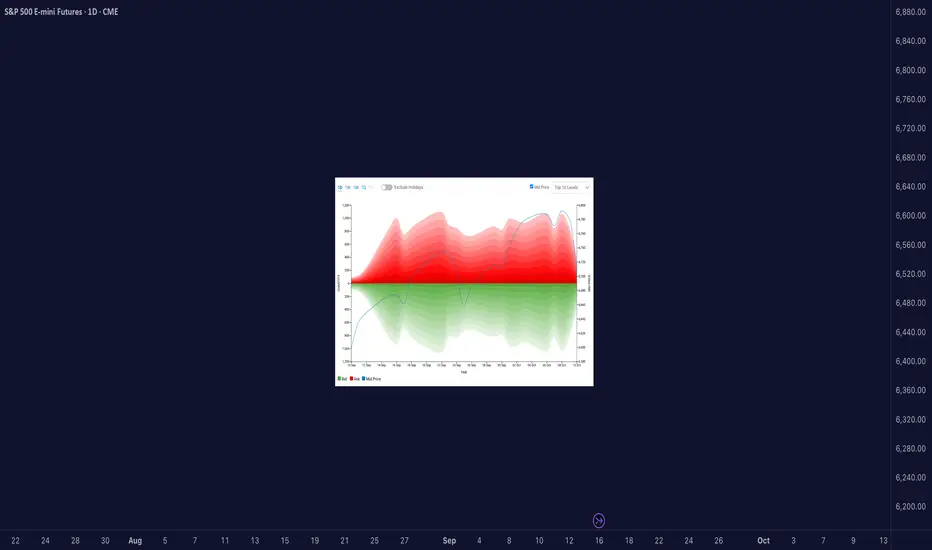
There were clear signs of potential reversals across major markets before the Friday, October 10, 2025 crash. You can see it in the liquidity heatmaps: Gold, Bitcoin, S&P, and other futures all trading above their top 10 liquidity levels.
When that happens, it’s usually a warning flag. Price is moving into areas with less visible liquidity, meaning fewer resting orders available to absorb aggressive buyers. That’s when the market becomes fragile and doesn’t take much to trigger a sharp reversal.
█ When Price Trades Beyond Visible Liquidity
It’s easy to think big moves happen just because of news, but beneath the surface, microstructure signals often show when markets are already vulnerable.
One of the clearest is when the mid-price extends beyond the visible liquidity, above the top few ask levels or below the top few bid levels in the order book.
Suppose price pushes beyond the visible top levels. In that case, it often means that liquidity was consumed faster than it could replenish, either because aggressive orders cleared it out, or market makers pulled their quotes. That’s when we get what’s called a liquidity vacuum.
Research from the Federal Reserve, Bank for International Settlements, and academic studies (Lo & Hall, 2014; Meldrum & Sokolinskiy, 2025) all point to the same thing:
When order book depth is shallow, markets become more fragile. Prices overreact, spreads widen, and shocks travel faster.
█ What the Heatmap Really Shows
Those heatmaps are a visual snapshot of this structure.
The green and red bands show the depth of buy and sell orders — the liquidity zones.
The blue line is the mid-price — the true current market price.
When the blue line (mid-price) moves above the red zone, it means price has traded beyond the top available asks. That can happen because:
Buyers lifted all nearby sell orders (aggressive buying), or
Sellers pulled liquidity (passive withdrawal).
In both cases, the effect is the same, the book thins out, and volatility risk increases.
Heatmaps don’t show everything though. They don’t reveal:
Hidden or iceberg orders deeper in the book,
Off-exchange liquidity or block trades,
Or how quickly the book replenishes in real time.
But as a visual proxy, they’re incredibly useful for spotting moments when price runs ahead of available liquidity, often right before sharp reversals.
█ Why the Crash Hit So Hard
So while the crash came from unexpected news, the speed of that drop wasn’t random. Markets were already fragile. Liquidity across assets was thin. When the shock hit, there weren’t enough resting orders to slow it down.
Gold, Bitcoin, and S&P futures all had their mid-prices trading above visible liquidity, making them more sensitive to aggressive selling; that’s why the market fell almost simultaneously and so fast.
█ How I Handle These Setups
Whenever I see price trading above visible liquidity, I start managing risk differently. I might keep existing longs, but I won’t add new ones. Instead, I scale out gradually and watch for potential short setups if other signals confirm it.
It’s not about predicting crashes, it’s about recognizing when the market’s structure is fragile.
█ Quick Takeaway
When the mid-price trades above visible liquidity, the order book is telling you something simple but powerful:
“There’s not much support up here.”
That’s often when it pays to get defensive, not aggressive.
Access the CME Liquidity tool at this link
-----------------
Disclaimer
The content provided in my scripts, indicators, ideas, algorithms, and systems is for educational and informational purposes only. It does not constitute financial advice, investment recommendations, or a solicitation to buy or sell any financial instruments. I will not accept liability for any loss or damage, including without limitation any loss of profit, which may arise directly or indirectly from the use of or reliance on such information.
All investments involve risk, and the past performance of a security, industry, sector, market, financial product, trading strategy, backtest, or individual's trading does not guarantee future results or returns. Investors are fully responsible for any investment decisions they make. Such decisions should be based solely on an evaluation of their financial circumstances, investment objectives, risk tolerance, and liquidity needs.
DKNG Update | Crash AheadOne of the best fractal overlays I've seen with some Elliott Waves to go with it.
Price is still in a uptrend but with growing sellers It'll come to an end similar to the last fractal.
During the 3rd wave in the last pattern price experienced its first pullback at (B), and its second at correction wave 4 and the third after the last wave before we witnessed the last push in buyers.
This current cycle price is in a similar stage with a swing low at (b) meaning that we could see another run-up towards major resistance ($63).
This would be the final blow-off-top in general markets. TVC:RUT is already showing signs of weakness which works well with this TA example.
When the time is right I'll do another TA for the downfall. For now I'm bullish but for the horizon I'm very bearish.

Nasdaq records near critical resistance! More to go or crash?Strong economic data suggest the soft landing scenario remains intact. Manufacturing strength, combined with improving employment data, appears to provide support. The Fed's dovish pivot also offers liquidity tailwinds, while the Nvidia-Intel partnership signals continued investment in US stocks.
But is the market reading the signals?
Strong employment data could actually be bearish for equities since it reduces the urgency for the Fed to cut. The Fed's dot plot already shows fewer 2026 cuts (only one instead of three) with higher growth and (slightly higher) inflation projections. The Nvidia-Intel deal also excludes Intel's struggling foundry business, a core problem for the company.
Technicals are not too promising either. Multiple resistance factors converge just a tad higher if not at current levels:
Long-term trendline from November 2021
138% Fibonacci level
Triangle pattern measured move completion
100% Fibonacci expansion target
Indicators flash warnings too:
RSI second divergence since May (price up, momentum flat)
Volume oscillator 13% below zero - lack of institutional buying
Missing third-wave volume surge - typical bull pattern absent
Fifth-wave characteristics suggesting impulse completion
As we trade in the historically worst month for equities, where the NASDAQ typically underperforms the S&P 500 during September selloffs, a high-probability short setup could be underway:
Entry : 24,700-24,750 area (resistance test)
Stop : Above 25,000 (avoid false breakout)
Targets : 23,700 → 22,730 → 22,200
Risk-Reward : Approximately 2.6:1 to first major support
Prefer a 5-wave decline if bear case confirms, followed by a 3-wave up, then continuation lower.
Watch 24,500 as it appears to be a decision point where multiple technical and fundamental factors converge.
This content is not directed to residents of the EU or UK. Any opinions, news, research, analyses, prices or other information contained on this website is provided as general market commentary and does not constitute investment advice. ThinkMarkets will not accept liability for any loss or damage including, without limitation, to any loss of profit which may arise directly or indirectly from use of or reliance on such information.

SPX shortSame like 2000 the concentration in AI related companies is 5 times as of russell 2000 combined companies.
Technical - Divergence in breadth and momentum
Fundamental - Expecting 3 rate cuts this year, when not delivered will start panic selling.
Chart pattern - Weekly doji

IWM Appears Due for a Minimum 40-60% Downside CorrectionOn the lower timeframes IWM has been treating $223 as short term support with much sold put leverage building at $220 and recently IWM has begun to retrace back down into those levels putting those sold puts at risk of expanding the volatility and of squeezing through these short puts as a result.
The short term the loss of this zone could likely squeeze down to $200.
However in the longer term we have been trading within this much larger parallel channel since the peak and bottom of 2008-2009 GFC and have started to form a potential peak paired with a Bearish Shark. I think that if we were to start to see some serious downside the IWM could trade back down to not just the bottom of the channel but down to one of the 3 major horizontal supports I have plotted on the cart down at $121, $85.74, or even $41.11 if things get real bad.
Personally I will be targeting one of the 2 upper horizontal supports in the longer dated positioning while targeting the $210-$200 levels in the short term.
I'd suspect this decline to come especially as Fed Rate cut expectations are completely priced out of the market, it is worth mentioning that fed funds futures around the start of the month dropped their expectations of rate cuts for the September meeting down to 0 and we may now be on the path to pricing in rate hikes as seen in the chart below.
Alternatively the expectations for rates going into the end of December has been on a fast trajectory of pricing out rate cuts as well, starting at 90BPS of rate cuts at the start of the year, now pricing in only 37.5BPS in rate cuts:
This ongoing shift in these fed futures spreads from positive to negative signifies the amount that Fed Funds Futures are expecting the Fed to hike rates with both the instance of rate hikes and rate cuts likely to cause a collapse in credit spreads as the bond market yield shift higher leaving the interest rate sensitive IWM to be one of the most negatively affected.

BITCOIN DUMP TO $87,000?!According to my ‘Elliott Wave Theory’ strategy, BTC has now competed its 5 Wave Impulse run OR is very close to completion!
Is it time for price to start correcting and dump down towards $87,000?
Let me know in the comments what you think.

MAGS SUPER STRUCTURE FORMING CAUTION!We have MEGA superstructures forming everywhere. H&S Eiffel Towers, etc.. None will be more devastating to 401ks and people's portfolios than the MAGS breaking down from this mammoth structure.
Last chance to GTFO forming.
CAUTION is in order!
Click Boost, Follow, Subscribe. Let's get to 5,000 followers ))

Mastering Volatile Markets: Why the Trend is Your Best Friend█ Mastering Volatile Markets Part 4: Why the Trend is Your Best Friend
In Part 1 , we covered reducing position size.
In Part 2 , we explored liquidity and execution strategies.
In Part 3 , we discussed the power of patience over FOMO.
Now,we're diving into one of the most important principles of all — especially in volatile, fast-moving markets: Follow the Trend. Trust the Trend. Trade With the Trend.
In wild markets like these, everything changes quickly. Indicators print overbought or oversold conditions well before the market even thinks about reversing.
Divergences can keep stacking up while the price continues trending for another 300, 500, or even 1000 points. Why? Volatility + Liquidity conditions = Extended trending behavior.
When liquidity is thin, and volatility is high, strong trends tend to last longer than usual:
Breakouts run further.
Breakdowns fall deeper.
And counter-trend trades? They're often a fast ticket to losses.
█ What Pro Traders Know Better Than Anyone:
In volatile markets, trend-following isn't optional — it's survival.
But wait, it is obvious that trends aren't perfect straight lines. So how can one even realistically “follow” a trend, especially in volatile markets.
Well, the key is to expect the unexpected. Experienced traders trade logically, we expect pullbacks, fakeouts, stop hunts, snapbacks and/or channel breaks. In fact, we prepare for them.
It is detrimental to assume the trend is over just because of these moves. Most of these are liquidity traps, not real reversals.
█ Here's What Pro Traders Do Differently:
⚪ They Identify the Core Trend Direction
Pro traders use price structure, trendlines, moving averages, VWAP , or higher timeframe levels to identify the trend direction. Once identified, every trade respects the trend.
Let me explain with an example.
→ Uptrend Identification:
Say you notice that the price of Gold (XAUUSD) has been consistently making higher highs and higher lows. What should you do?
You use the 100-period moving average (MA) and see that price is staying above it, indicating an uptrend. You wait for price to pull back to the MA, giving you a low-risk entry to join the uptrend rather than chasing the trend.
→ Downtrend Identification:
In a downtrend, USD/JPY keeps making lower highs and lower lows. You observe the 100-period moving average pointing down. This is your cue to look for short entries , avoiding countertrend buys that could trap you.
⚪ They ONLY Look for Entries at Key Trend Channel Levels
Professional traders don’t chase the price or try to catch every move. Instead, they patiently wait for price to return to key areas within a well-defined trend channel , either the upper boundary (in a downtrend) or the lower boundary (in an uptrend).
→ In an uptrend:
Pro traders draw a trend channel based on the price move. When price pulls back to the lower boundary of the channel (often aligning with demand zones), they start looking for long entries, aiming to trade with the trend and target a new high.
→ In a downtrend:
The same logic applies, but in reverse. Price pulls back to the upper boundary of the channel (supply area), offering a clean short opportunity to continue with the trend and target a new low.
But here’s what separates pros from amateurs:
→ They expect fakeouts, spikes , and temporary breaks beyond the trend channel — especially in volatile conditions.
→ They don’t panic when the price briefly moves outside the channel. Instead, they wait for confirmation signals (like a rejection candle, break of structure, or momentum shift) before entering.
→ This gives them both a logical entry point and a favorable risk-reward setup — aligning with the larger trend direction while staying protected if the trend fails.
⚪ They Treat Countertrend Moves as Opportunities to Enter WITH the Trend
When a countertrend move happens, pro traders see it as an opportunity to enter with the prevailing trend, rather than trying to catch a reversal.
→ Counter-Trend Move in an Uptrend:
Let's say S&P 500 is in a strong uptrend, and it experiences a sharp pullback of 5%.
While many retail traders panic and try to short the market, pro traders see this as a buying opportunity at a lower price, anticipating the trend will continue after the correction.
→ Counter-Trend Move in a Downtrend:
For Gold (XAU/USD) , if the price falls sharply from $1,900 to $1,850 and then retraces back to $1,875 (a previous support-turned-resistance level), pros see this as an opportunity to sell into the trend rather than buying into what could be a false recovery.
⚪ They Accept That Trends Can Look "Overbought" or "Oversold" for a Long Time
In volatile, trending conditions, RSI can stay above 70 for hours or even days, and divergences can build for a long time without price reacting.
→ RSI Above 70 in an Uptrend:
Bitcoin (BTC/USD) rallies from $40,000 to $60,000. Despite RSI being above 70 for a few days, pro traders don't fight the trend because momentum is strong. Instead, they look for a pullback to the 100-period MA for a safer entry.
→ Divergence in Downtrend:
The EUR/USD shows a bearish trend , but the RSI starts to build a divergence as the price keeps making lower lows. Pro traders ignore the divergence because the trend is still strong. They wait for a clear break of the trendline or confirmation that price has reversed before considering a long trade.
█ Summary of Part 4 — Trend is Your Best Friend
You can't control how far a trend will run…but you can control whether you're with or fighting against it.
And trust me, fighting a strong trend in a volatile market is a battle retail traders rarely win.
Here’s what you should take away from this article:
Volatile markets = Extended trends
Indicators can lie — trend structure tells the truth
Fakeouts & pullbacks are normal
Don't fight the trend — trade with it
Use counter-moves to enter the trend
Patience & trend-following = Survival + Profit
█ What We Covered:
Part 1: Reduce Position Size
Part 2: Liquidity Makes or Breaks Your Trades
Part 3: Patience Over FOMO
Part 4: Trend is Your Best Friend
That's it! You've now completed the Mastering Volatile Markets series.
Stay calm, adapt quickly, and trade smarter — that's how you survive (and thrive) in volatile markets.
-----------------
Disclaimer
The content provided in my scripts, indicators, ideas, algorithms, and systems is for educational and informational purposes only. It does not constitute financial advice, investment recommendations, or a solicitation to buy or sell any financial instruments. I will not accept liability for any loss or damage, including without limitation any loss of profit, which may arise directly or indirectly from the use of or reliance on such information.
All investments involve risk, and the past performance of a security, industry, sector, market, financial product, trading strategy, backtest, or individual's trading does not guarantee future results or returns. Investors are fully responsible for any investment decisions they make. Such decisions should be based solely on an evaluation of their financial circumstances, investment objectives, risk tolerance, and liquidity needs.

What on Earth Is a Circuit Breaker?!Every couple of days since April 2nd, everybody's been talking about a stock market halt all day. You're left there trying to Google it so you're not the only person in the group chat who doesn't know what's going on. But actually, nobody else in your group chat knows what's going on either. They're low-key Googling it under the desk. You don't have to know everything in the market to be a "seasoned" trader. What does get disappointing is when people guess instead of providing facts or a direct link to an article about market halts.
So, this is your quick-but-detailed-read article/ guide to market halts and circuit breakers. Send it to your friends in that group chat. Why today's dump happened in the first place? More on that later. It's a long story. 🥹
What is a circuit breaker?
It's simple: a circuit breaker is a 15 minute OR whole-day market-wide HALT when the market reaches 1 of 3 decline levels. It all depends on the level, how fast the decline is, and potentially other factors that we are not aware of. Keep in mind this is not something we have to deal with often.
When does it happen? And what stock does it track?
Good question. The halt is triggered following declines in the S&P 500 only . That is: AMEX:SPY SP:SPX $CME_MINI:ES1!.
If these level 1 & 2 are reached before 3:25 PM EDT , there is a 15 minute market-wide trading halt. Meaning you cannot enter or exit positions. If level 3 is reached at any time in the day, the entire day's trading will come to an end.
Level 1: -7.00% | 15 minute halt
Level 2: -13.00% | 15 minute halt
Level 3: -20.00% | Entire day halt
So when the S&P 500 index reaches -6.98%, be sure a halt is coming very soon at -7.00%. Sure, like today, "they" might pump it and use that as support and prevent a halt (we got very close to -6.35% on CME_MINI:ES1! if I'm not mistaken). But it's good to be vigilant and make sure you're not in any daytrades.
Does CME_MINI:NQ1! NASDAQ:QQQ CBOT_MINI:YM1! trigger the halt also?
No. The halt is only triggered by the S&P 500. The Nasdaq Composite famously moves much more than S&P 500, so a 7% drop in S&P is way more dramatic than a 7% drop in Nasdaq and it's highly likely at -7% in S&P that Nasdaq would be at -8% or -9%. Although, both are undoubtedly decimating for any long positions.
Why does this rule exist?
This was introduced after Black Monday of 1987 where the market was free falling ( DJ:DJI dropped 22.6%) with no safety stops in place to prevent a market-wide disaster. This prevents further panic selling and massive stop loss raids, and also gives institutional traders time to zoom out and see the bigger picture.
How close did we get recently?
Today we got within 0.7% of getting a 15 minute halt.
See for yourself:
And the intraday 15 minute chart:
FUN FACT: What if I shorted the top on CME_MINI:ES1! ?
Assuming your time machine goes back 24 hours (some time machines only go back 10 years minimum), you'd have booked 1500 ticks at $12.50 per tick. So around $19k per contract. You know that's not too bad. It's almost a Toyota Camry per contract. Do better! 😆
How do I trade this?
Do you really have to? Please do not FOMO & catch a falling knife. Trade light. The market is open for the rest of the year. Trade with a stop loss, and remember, if you FOMO'd and bought at -3% just because it's down 3%, you'd have gotten decimated. Use the charts not the % on your screen. 🔥
Hit the follow button for free educational content because knowledge is free. KD out.

BTC UPDATE: Flash Crash? Or Bullish Retest?🚀 Hey Traders! 👋
If you’re enjoying this analysis, smash that 👍 and hit Follow for high-accuracy trade setups that actually deliver! 💹🔥
📉 BTC just dropped nearly $10K in a single day, sliding from $84K to $74K amidst growing tariff tensions and broader market turmoil.
But here’s the bullish twist—this dump might just be a healthy retest.
BTC recently broke out of a strong inverse head & shoulders pattern, and what we’re seeing now looks like a classic neckline retest.
📌 Key Support: $72K
As long as BTC holds above this level, there’s no reason to panic. Once the dust settles from this bloody Monday, momentum could shift back to the upside.
🟢 This could be a golden accumulation zone—low risk, high potential reward.
❌ Invalidation Level: Weekly close below $72K
💬 What’s Your Take?
Will BTC bounce from this level, or is there more downside ahead? Drop your analysis and predictions below—let’s navigate this together and secure those gains! 💰🔥🚀

So here’s what I’m doing: Not Panicking.This analysis is provided by Eden Bradfeld at BlackBull Research.
Listen, the US has survived the depression of WWI, the Great Depression, the depression of WWII, oil shocks, the dot com bubble, the GFC, the COVID-sell off. It’ll likely survive this.
In the scope of history, that $1 survived very well indeed. Panicking and running for the hills does not do so well. Winston Churchill was a great and flawed man but a terrible investor; he bought and sold shares prior to the 1929 crash in such speculative investments as mining companies, railways, and so on — most of them lost money (hence why Churchill continued to write at such a pace — to fund his Champagne-and-spec stock lifestyle). Hetty Green, on the other hand, (known as the “Queen of Wall Street”, managed to do very well her time — her quote?
I buy when things are low and no one wants them. I keep them until they go up, and people are crazy to get them.
Now, that’s something I can get behind.
Nobody wanted Meta a few years ago. I wrote an internal memo, close to its plummet in ‘22 (it got to $99 or so a share!). I wrote this:
ii) Yet what if we were to tell about about a company with this set of heuristics? Let’s call it “Company A”
Company A has a 31% return on equity and a 20% return on capital.
It has a net income margin of 37% and a FCF margin of 21%
Its income has a compounded annual growth rate over the last 5 years of 41%
If we add in numbers, now, let’s say the net income for 2020 was $29 billion, and $10 billion of that was used to repurchase stock from shareholders?
Let’s say the unlevered FCF is around $6 billion per quarter, and let’s say the debt to equity ratio is about 9x.
In other words, Company A is grows at a quick clip, and has done sustainably for the majority of its life. Its return on capital and return on equity would make any investor happy. Its FCF is an absolute machine.
Would you buy Company A?
Company A was Meta . You would’ve roughly made 4x or 5x’d your money if you’d bought around then. The point is, the fundamentals of a business matter, and right now there a quite a few exceptional businesses with good fundamentals trading at a good price. Alphabet (Google) trades at ~16x earnings. LVMH trades at ~18x earnings. And so on. Brown-Forman trades at ~15x earnings. These are all “inevitables” — Google will continue to be a dominant advertising platform, LVMH will continue to sell luxury, and Brown-Forman will continue to sell Jack Daniel’s and so on.
I talked to my ma in the weekend. She is not really a share person. Her portfolio is a bunch of “inevitables”. It’s done very well. She said “aren’t you worried about this stock market?”, and I said “You love supermarket shopping, Mum. If you see something at a 25% discount you buy it. You come home, and you’re delighted that you found some mince on special²”
She was like, “oh, that makes sense”.
The problem is you have a lot of people looking at charts and catching worry that the world will end. The world, I am delighted to say, has a magnificent disposition to carry on.

QQQ Selling Just StartingIf you have any illusions this will be a buy-the-dip market, you are taking on a major risk!
1. Last time QQQ sold off it lost 84%
2. It took 17 years to break even
3. It took much longer to break even inflation-adjusted
You can't buy low if you don't sell first. You don't have infinite money.
WARNING!

Market Update: NASDAQ 100 Analysis📈 The NASDAQ 100 is currently trading at 18,075.00, which represents a -22.6% decline from the all-time high of 22,425.75 . This marks a significant drop from its peak, entering into what could be classified as a bear market by traditional standards.
📊The previous decline from the high of 16,800.00 in November 2021 saw a decline of 37.47% , eventually bottoming out at the 61.8% Fibonacci retracement level (10,514.25), from which it staged a significant recovery to reach the all-time high of 22,425.75.
📊Current Demand Zones & Fibonacci Levels:
These zones represent potential reversal areas where buyers could regain control. The Fibonacci retracement levels align well with historical price action, reinforcing their significance as support zones.
DZ-1 (17,539.00-16,334.85): Approximately the 50% Fibonacci retracement of the recent bull rally
DZ-2 (16,334.85-15,384.25): Approximately the 61.8% Fibonacci retracement - Historically a strong support level
DZ-3 (15,384.25-14,557.00): Critical structural level with prior buyer interest
DZ-4 (14,557.00-14,140.25): Deep support level - key psychological zone
📈 Recovery Potential
To regain the all-time high of 22,425.7 5, the market would need to achieve the following percentage gains from each demand zone:
From DZ-1 (Top: 17,539.00, Base: 16,334.85): 📈 +37.3% to all-time high
From DZ-2 (Top: 16,334.85, Base: 15,384.25): 📈 +45.8% to all-time high
From DZ-3 (Top: 15,384.25, Base: 14,557.00): 📈 +54.0% to all-time high
From DZ-4 (Top: 14,557.00, Base: 14,140.25): 📈 +58.6% to all-time high
The DZ-2 to DZ-3 range provides the most likely region for a significant reversal based on confluence between historical support levels and Fibonacci retracements. While DZ-4 aligns with the 37% historical decline.
🔑 Key Takeaways
The NASDAQ 100 s is in a significant correction phase, down -22.6% from its peak.
Price is approaching critical Demand/support zones (DZ-1 to DZ-4), which may act as reversal points.
A return to all-time highs would require substantial gains, particularly if the market reaches the deeper demand zones.
Investors should closely monitor price action around the DZ-2 to DZ-3 range (15,384.25 - 14,557.00) for signs of a potential reversal.
Additionally, staying updated on developments related to the new tariffs is essential, as they may heavily influence market dynamics in the coming months.

Crude OIL CRASH - OPEC & Trump - Recession Catalyst#Recession is here, Markets are bleeding.
Crude #Oil is the kicker.
I shorted TVC:USOIL on Friday.
Hunting on this trade for a while now.
Very #Bearish outlook on #WTI.
MARKETSCOM:OIL Weekly
#FundamentalAnalysis
- #OPEC+ Output Hike (411K bpd)
- #Trump #Tariffs & #TradeWar
I'm looking at a #CrudeOIL #MarketCrash, similar to the #Covid era, when NYMEX:CL1! went in minus on #Nymex #Futures.
TVC:USOIL & my BIG SHORT
#Trading EASYMARKETS:OILUSD via CFDs with #Leverage.
Executed my #Sell Position on #WTI at $64.
* DYOR before, it's not a financial advice, I just share.
#TechnicalAnalysis
- #ElliottWave Impulse Cycle a (white)
- #Correction in Primary ABC (red)
- #LeadingDiagonal in Primary A (red)
- #Descending Triangle in Primary B (red)
Why will BLACKBULL:WTI Crash?
#Bearish Primary C (red) has started.
#Break-out below the Triangle Flat Line.
Important Note:
The #Bearish #Impulse will continue lower.
After the short-lived pull-back, Sellers will dominate.
$63-64 Range is the Entry.
MARKETSCOM:OIL Daily
TVC:USOIL #Short #TradeSignal
- Entry @ $63-64 Range
- SL @ $73
- TP1 @ $40
- TP2 @ $30
- TP3 @ $20
Stay in the green and many pips ahead!
Richard (Wave Jedi)

$SP500 $SPX Is the bull run over?#SP500 SP:SPX S&P500
Is this just a bull-run retracement or the beginning of a bigger crash?
Is the bull run over?
Every major crash started with an “innocent” 10–15% pullback. 🧐
It’s difficult to draw any conclusions right now, but once the current bounce is over, the next retracement will give us more clues. ⏳👀
Are you bullish or bearish? 🐂 🐻

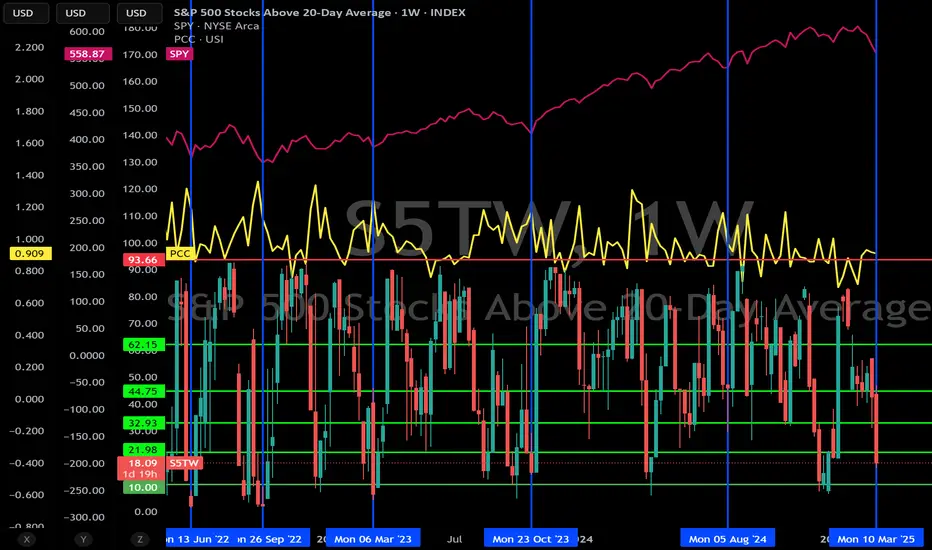
SPY, PCC & Percentage of S&P 500 Stocks Trading Above 20 SMASPY is in pink, PCC is in yellow and candles show S5TW (Percentage of S&P 500 stocks trading above their 20 SMA) on this weekly chart. You will notice after a significant drop of over 5% on S&P 500, once S5TW start getting below 20%, a reversal isn't that far away. Relief rally rips can be dramatic, so it really isn't the time to get bearish. Need to put that bull hat on! For now I am leaning after this retrace pump to 590 area, conclusion of B wave, but we still will put in a C wave which will likely head lower than where we finished A, but after that it will be one more impulsive wave to finish this bull run which should take us to SPY 650 by mid next year. Won't want to miss that one!!!
ETHEREUM CRASH TO $786! (UPDATE)Remember my ETH short bias from last September? Despite it pushing up a little, price has remained within the trendlines & bearish channel, keeping its main trend in a 'downtrend'.
We are still within a 3 Sub-Wave (A,B,C) corrective channel, with the current bearish move down being Wave C. Wave C target still remains around $786🩸

NASDAQ: Correction or Crash?!If this Monthly Chart for March holds then the NASDAQ:QQQ is COOKED!
Next Level: $450
Crash level: $370-$400 🥶
- Breaking out of WCB Trend
- Volume is WAY less than 202 Market Crash (Can get worse)
- Breaking out of Bullish Channel
- Topping tail wicks
Not financial advice
