MICROSOFT Hit a WALL. DOUBLE TOPPED and WILL DROPPrice action has confirmed and triggered a double top pattern.
Calling tops in tech is dangerous as we all know.
But as Tech fatigue hits, and selloffs quicken, the risk of a deeper shakeout increases.
Remember US stock market is 230% of GDP.
With increasing Job Losses.
Microsoft

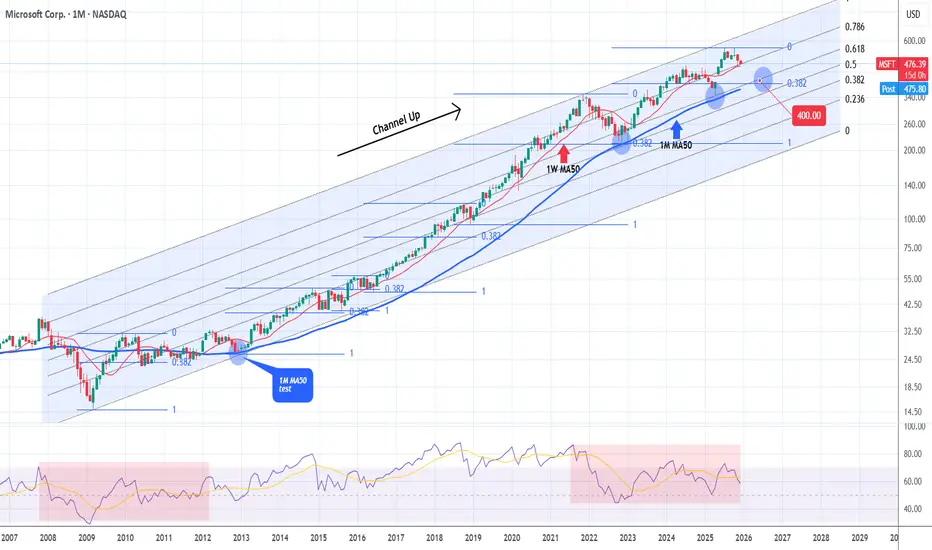
MICROSOFT testing the most important Support of the Cycle.Microsoft (MSFT) hit last month its 1W MA50 (red trend-line) and held. The rebound seems short-lived however as again half-way through December, the market is about to re-test that Support again.
This is a critical Support level for the Bull Cycle that started upon the November 2022 market bottom, as the last two times this broke, the price pulled-back to the 1M MA50 (blue trend-line).
That level has in fact been the ultimate long-term Support since 2012, the most important level of the Channel Up that started after the 2008 Housing Crisis.
We also see here that almost all of the strong bearish corrections within this pattern, hit the 0.382 Fibonacci retracement level and rebounded.
As a result, if 1W MA50 breaks again, we expect the subsequent correction / Bear Cycle to hit $400 at least.
---
** Please LIKE 👍, FOLLOW ✅, SHARE 🙌 and COMMENT ✍ if you enjoy this idea! Also share your ideas and charts in the comments section below! This is best way to keep it relevant, support us, keep the content here free and allow the idea to reach as many people as possible. **
---
💸💸💸💸💸💸
👇 👇 👇 👇 👇 👇
MSFT Selling Pressure Activated — Time to Short!🔥 MSFT Bearish Profit Playbook — Thief-Style Layer Attack Activated! 🔥
Asset: MSFT — Microsoft Corporation (NASDAQ)
Style: Swing / Day-Trade Playbook 📉💼
📉 Plan: Bearish Pressure Play — Smart Sell-Side Thief Approach
Microsoft is showing potential exhaustion on the upside, and this setup focuses on a structured bearish move using a layered sell-limit strategy (Thief Layer Method) 😎🕵️♂️.
🎯 Entry Strategy (Thief Layer Method)
Using the thief-style multi-layer approach, we stack multiple sell-limit orders at different levels to catch premium liquidity:
Sell Limit Layers:
$500, $490, $480
(You can increase or adjust layers based on your own risk tolerance.)
This method aims to fade upward pushes, catching price exhaustion during liquidity grabs.
🛑 Stop Loss (Risk Control)
This is the Thief SL @ $510 🛑
Note: Dear Ladies & Gentlemen (Thief OG’s), I’m not recommending that you use only my stop-loss. It’s your money — your rules. Manage your risk like a pro. 💼⚠️
🎯 Target (Exit Zones)
We are aiming toward strong support zones + potential oversold zones where bearish momentum may slow.
Main Target: $450
Trap may form — escape with profits before the market police catch us 🚓💨
Note: Dear Ladies & Gentlemen (Thief OG’s), I’m not recommending using only my target. Exit where you feel safe and profitable. 🏦✨
📊 Market Summary (Clean, TV-Safe Explanation)
Bearish attempt based on overextended zones
Layered entries help clip premium during upside wicks
Targeting liquidity pockets near support
SL above structural invalidation
Setup respects TradingView House Rules: No financial advice, no promises, no signals, educational thief-style humor only ✔️
🔗 Related Pairs to Watch (Correlation Insights)
Because MSFT is a heavyweight in tech + NASDAQ index weighting:
1️⃣ NASDAQ:QQQ (NASDAQ 100 ETF)
Strongly correlated
If QQQ rejects from local resistance → MSFT bearish play strengthened
QQQ weakness = tech sector weakness
2️⃣ AMEX:SPY (S&P500 ETF)
Broader market risk sentiment
SPY pullback often pressures mega-caps like MSFT
3️⃣ NASDAQ:AAPL (Apple Inc.)
Moves similarly during liquidity rotations
Apple weakness = added pressure to mega-cap tech basket
4️⃣ NASDAQ:NVDA (Nvidia Corp.)
High-beta tech name
When NVDA loses momentum, MSFT downside probability increases through sector rotation
5️⃣ NASDAQ:GOOGL (Alphabet Inc.)
If large-cap tech corrects collectively, MSFT rarely moves opposite
Perfect correlation watch ⚡
Watching these pairs helps confirm bearish bias through sector-wide confirmation, not isolated signals.
✨ “If you find value in my analysis, a 👍 and 🚀 boost is much appreciated — it helps me share more setups with the community!”
⚠️ Disclaimer:
This is a thief-style trading strategy just for fun.
Educational only — not financial advice. Trade at your own risk. 😄🕵️♂️

MSFT Market Blueprint: From Pullback to Profit Zone💼 Asset: Microsoft Corporation (MSFT) — NASDAQ
Type: Swing Trade Setup
Bias: Bullish Pullback Play
🔍 Plan Overview
MSFT is showing a clean bullish pullback confirmation with the Hull Moving Average acting as dynamic support. A Heikin Ashi reversal doji candle has appeared — a strong hint that buyers are gaining control again 🟢.
Momentum looks ready to shift back to the upside as the pullback finds its footing. The plan focuses on catching this move with layered entries (a.k.a. “Thief Strategy” style).
⚙️ Entry Plan (Layered “Thief” Style Method)
This approach uses multiple limit orders to build a strong position during pullbacks. You can add or adjust based on your own risk appetite.
📍 Layered Entry Points:
🟩 520.00 — first buy zone (initial position)
🟩 530.00 — second layer (confirmation add-on)
🟩 540.00 — third layer (momentum add)
💡 Tip: You can increase or decrease the number of layers depending on volatility or confidence in trend continuation.
🔒 Stop Loss (SL)
🛑 Thief OG’s SL idea: 510.00
Note: Dear Ladies & Gentlemen (Thief OG’s), I’m not recommending to stick strictly to my SL — trade with your own risk management. Make money and protect it wisely. 💰
🎯 Target Profit (TP)
🎯 Target zone: 580.00
The “Police Force” (strong resistance zone) is waiting up there — where the market could become overbought or trap late buyers. That’s where we take our profit and vanish with gains like pros 😎.
Note: Dear Ladies & Gentlemen (Thief OG’s), again — you can set your own TP. This level is my personal exit zone for safety and profit lock.
🔗 Related Pairs & Market Watchlist
Keep an eye on correlated tech giants and ETFs to confirm momentum:
💻 NASDAQ:AAPL (Apple Inc.) – often leads the NASDAQ tech sentiment.
🌐 NASDAQ:GOOGL (Alphabet Inc.) – confirms sector strength.
📊 NASDAQ:QQQ (NASDAQ 100 ETF) – index pressure or breakout signal for techs.
⚙️ AMEX:XLK (Tech Sector ETF) – broader sector health indicator.
🧠 Correlation Insight:
When Apple ( NASDAQ:AAPL ) or Google ( NASDAQ:GOOGL ) show the same bullish reversal near their moving averages, it reinforces MSFT’s bullish continuation. Strong moves on NASDAQ:QQQ and AMEX:XLK also validate that the entire tech sector is moving in sync.
⚠️ Disclaimer
This is a Thief-style trading strategy, designed for educational and entertainment purposes only — just for fun 🎭.
Trade responsibly and manage your risk accordingly.
✨ “If you find value in my analysis, a 👍 and 🚀 boost is much appreciated — it helps me share more setups with the community!”
#MSFT #SwingTrade #BullishSetup #TechStocks #LayeredEntry #HeikinAshi #HullMA #TradingPlan #StockMarket #ThiefStyle #TradingView #Investing #NASDAQ #PriceAction
Resurfacing fears of AI overinvestment triggered by MSFT
A report claimed that Microsoft (MSFT) had lowered AI product sales growth targets across several divisions by as much as 50% for the current fiscal year, after many sales teams failed to meet targets for the fiscal year ending June 2025.
Although MSFT swiftly denied the report, it reignited investor concerns about AI monetization and the risk of overinvestment.
Adding to the unease, IBM CEO Krishna warned that even trillions of dollars invested in AI data centers cannot deliver meaningful returns under current cost structures, further fueling market anxiety.
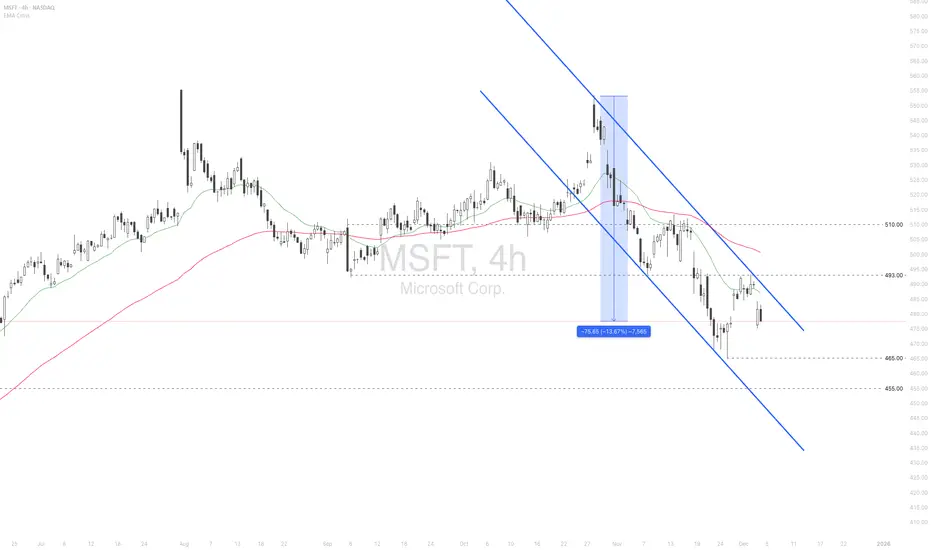
MSFT briefly tested the resistance at 493.00 before falling below EMA21. The price remains below bearish EMAs, indicating a potential downtrend continuation.
If MSFT fails to close above EMA21, the price could retreat toward the following support at 465.00.
Conversely, if MSFT breaches above EMA21 and 493.00, the price may advance toward the next resistance at 510.
Microsoft (NASDAQ: $MSFT) Drops as AI Sales Miss Targets Microsoft (NASDAQ: NASDAQ:MSFT ) slid more than 2% after a report from The Information claimed that the company had reduced growth targets for its AI products because sales teams failed to meet expectations. The report highlighted that several Azure sales units missed ambitious quotas tied to Foundry—Microsoft’s enterprise AI platform used to build and manage autonomous AI agents. According to the report, less than 20% of salespeople in one U.S. Azure division hit the 50% Foundry growth target, while another team initially faced a quota requiring them to double sales.
Microsoft quickly refuted the claims, stating that The Information conflated growth projections with internal quotas. The company emphasized that “aggregate sales quotas for AI products have not been lowered,” reaffirming the strength and ambition of its broader AI roadmap. Despite the clarification, the stock reacted sharply, reflecting heightened sensitivity around AI monetization as enterprise adoption continues to lag expectations.
Although AI is transforming workflows and offering automation opportunities, the adoption curve for enterprise-scale AI agents remains slower compared to consumer AI breakthroughs. Competitors including Google, Amazon, Anthropic, Salesforce, and OpenAI all face similar challenges as traditional organizations navigate data integration, reliability issues, and operational risk.
Technical Outlook
From the chart, MSFT has pulled back sharply from its $555 resistance zone and is now retesting a key support level around $465. This area aligns with previous structure and may act as short-term demand. A breakdown below $465 opens room for a deeper decline toward the $450 level. However, holding this support could trigger a rebound back toward the $555 region. Momentum remains neutral-bearish, with price sitting below the recent swing highs.

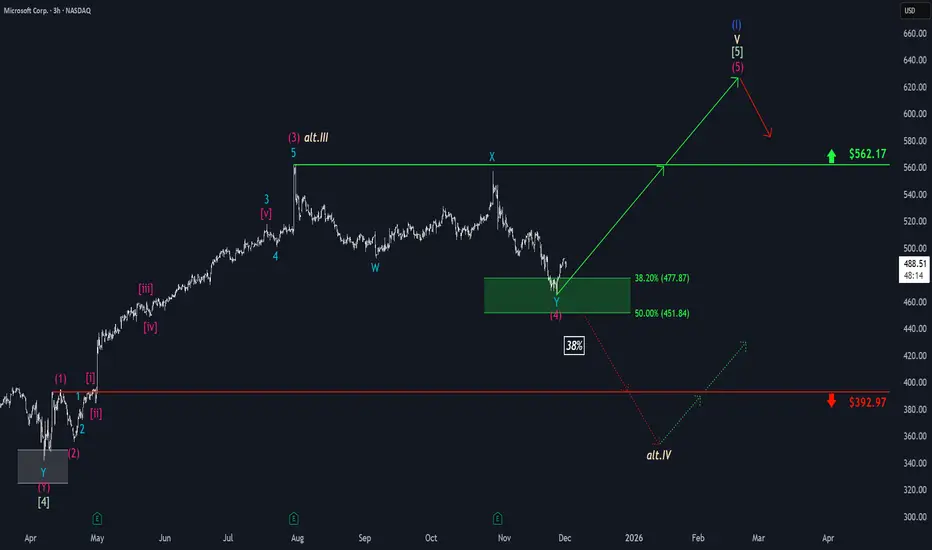
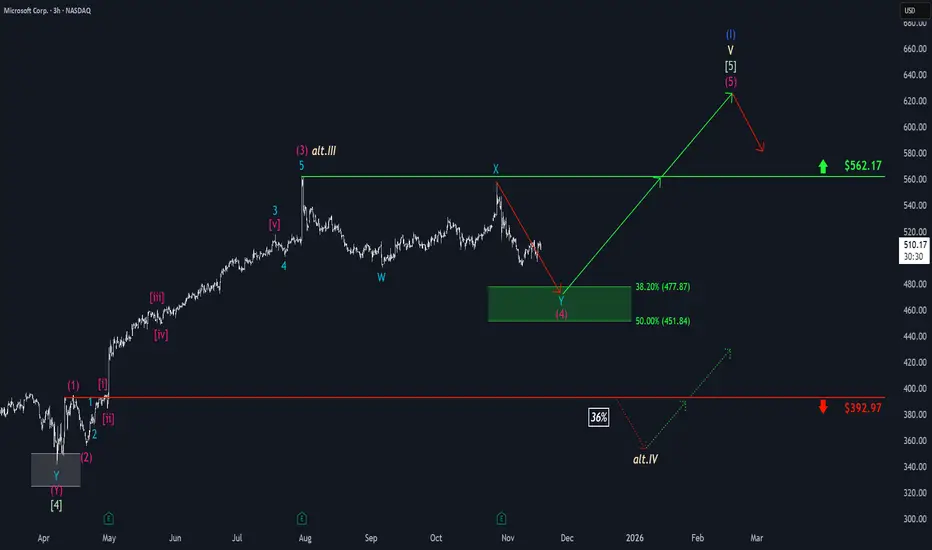
Microsoft: Target Zone Hit!Microsoft has reached our green Long Target Zone between $451.84 and $477.87 as anticipated. In the meantime, the stock has successfully completed the magenta wave (4) and has since broken out of the Target Zone to the upside. We now expect further gains as wave (5) unfolds, targeting a move above the resistance at $562.17, where the larger blue wave (I) is expected to conclude. After that, we anticipate a pronounced correction phase. However, there remains a 38% chance that MSFT could break down through the Target Zone and fall below the support at $392.97. In this case, we would reclassify the last significant high at $562.17 as the top of the beige wave alt.III and prepare for a new low in wave alt.IV .
MSFT Microsoft Corporation Options Ahead of EarningsIf you haven`t bought MSFT before the rally:
Now analyzing the options chain and the chart patterns of MSFT Microsoft Corporation prior to the earnings report this week,
I would consider purchasing the 550usd strike price Puts with
an expiration date of 2025-12-19,
for a premium of approximately $26.70.
If these options prove to be profitable prior to the earnings release, I would sell at least half of them.
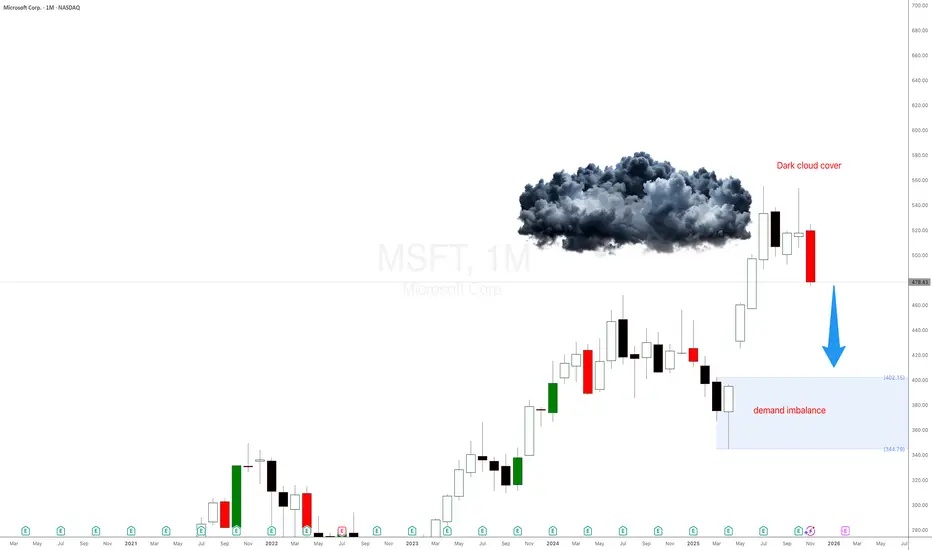
Why is Microsoft Stock $MSFT dropping hard?Microsoft just did what every impatient trader hates… after a massive rally, the candles are shrinking, emotions are rising, and here comes the correction everyone said ‘couldn’t happen.’ Today I’ll show you—using pure supply and demand—why MSFT is being magnetically pulled back into the monthly demand imbalance like a toddler to a candy shop. No fundamentals, no drama… just price action, imbalances, and patience. Let’s dive in.
Microsoft Monthly Supply & Demand Analysis
After Apple’s strong monthly correction setup, Microsoft (MSFT) is showing the exact same pattern — but even cleaner.
This is what I love when I teach traders to learn to trade stocks using pure price action and supply and demand imbalances. You don’t need news, earnings, or any guru opinion — everything is already priced in at the higher timeframes. Just like I explained in the Supply and Demand Free Course , the bigger timeframes tell you what the professionals already did months ago.
Let’s break it down.
Candles Shrinking = Momentum Weakening
Fast-forward to mid/late 2025:
- The wide-bodied candles disappeared
- Small-bodied candles appeared
- Then came the big bearish candle
This is classic momentum decay. This is exactly when most traders start acting emotionally:
- They zoom into 5-minute charts
- Their IQ drops by 50 points
- They forget the trend
- They forget the imbalance
- They become chart zombies
But price action never lies — we’re simply seeing exhaustion after a massive markup.
Mircrosoft wants to pullback to $470MSFT is likely to test $470 support before making it's move to $800. Another thing to be weary about is ratio MSFT/AAPL is at historical avg highs, which usually signals a bias towards AAPL. Waiting for $470 is a good idea before getting long again.
Good luck!
AI Valuation TechnicallyThese are the three largest market-cap listed companies on the Nasdaq.
If we are concerned about an AI bubble, I’m going to show you how I perform a quick glance at some top companies and their index to determine the likelihood of an upcoming short-, mid-, or long-term correction.
In 2017, Microsoft’s P/E reached its highest at 45 — and it continued to rise after that.
In 2023, Nvidia’s P/E reached its highest at 147 — and it continued to rise after that.
In 2024, Apple’s P/E reached its highest at 40 — and it continued to rise after that.
Video version:
Micro E-mini Nasdaq-100 Index
Ticker: MNQ
Minimum fluctuation:
0.25 index points = $0.50
Disclaimer:
• What presented here is not a recommendation, please consult your licensed broker.
• Our mission is to create lateral thinking skills for every investor and trader, knowing when to take a calculated risk with market uncertainty and a bolder risk when opportunity arises.
CME Real-time Market Data help identify trading set-ups in real-time and express my market views. If you have futures in your trading portfolio, you can check out on CME Group data plans available that suit your trading needs tradingview.com/cme/

Microsoft Approaches Key Level, Expands Xbox Design Lab GloballyMicrosoft has announced a major expansion of its Xbox Design Lab through a new global partnership with ESW, significantly widening its international ecommerce footprint. Xbox Design Lab allows gamers to create personalized Xbox Wireless Controllers and Elite Series 2 controllers. With ESW now serving as the Merchant of Record, Xbox can efficiently handle cross-border payments, logistics and compliance, key components for scaling internationally.
The relaunch extends Xbox Design Lab access to 27 countries, including major markets across North America, Europe and APAC. Countries such as the U.S., Canada, Japan, Singapore, Australia, South Korea, Germany and the U.K. are all included in the upgraded rollout. ESW’s ecommerce infrastructure also enables Microsoft to customize checkout flows and streamline international operations under tight timelines. A joint roadmap promises expanded payment options and future global growth.
This move strengthens Xbox’s global branding at a time when personalization and gamer-focused experiences are becoming central to console ecosystems. With Xbox hardware sales stabilizing and Game Pass continuing to anchor recurring revenue, this expansion supports Microsoft’s broader gaming strategy. It also enhances Xbox’s competitive positioning against Sony by offering deeper personalization options and global accessibility. Fundamentally, Microsoft remains a high-margin, high-cash-flow giant with strong performance across cloud, AI, enterprise software and gaming, making this expansion another bullish development.
Technically, Microsoft’s stock maintains a long-term bullish structure. Price is currently trading near $505, trading towards $465 support zone after pulling back from the $555 high. The chart shows clean support and resistance levels that act as strong levels. As long as this $465 support holds, the larger bullish structure remains intact.
If buyers defend the $640–$660 region, a rebound toward $813 becomes the next upside target. A breakout above that level could lead to fresh all-time highs. If support breaks, next levels sit at the trendline near $600 or deeper support around $550. Overall bias remains bullish.
Microsoft: Stuck in Sideways PatternMicrosoft shares have continued to show weakness recently, although the stock has shifted into more of a sideways pattern. In the near term, we anticipate another downward move, which should establish the low for wave (4) in magenta within our green Target Zone between $477.87 and $451.84. From our perspective, this range remains attractive for long entries, as we expect a new upward impulse to follow as part of magenta wave (5). This move should push the stock above resistance at $562.17 and complete the larger blue wave (I). Alternatively, there is a scenario in which the high at $562.17 marks the end of beige wave alt.III (probability: 36%). In that case, we would expect a substantial decline below support at $392.97, where the low of wave alt.IV would be found.
Microsoft - This bullrun will end soon!💊Microsoft ( NASDAQ:MSFT ) might reverse soon:
🔎Analysis summary:
Microsoft created a textbook bullish break and retest back in the beginning of 2025. After this retest, we then witnessed a major rally of about +50% over the past couple of months. But considering the recent weakneses and resistance, this rally might be over very soon.
📝Levels to watch:
$550
SwingTraderPhil
SwingTrading.Simplified. | Investing.Simplified. | #LONGTERMVISION

Has $MSFT topped? NASDAQ:MSFT looks like it has put in a top up at the $555 level.
This is actually one of the most bearish looking charts as I think there's potentially a longer term top being put in here.
I think it's possible that price goes to at least the $287 level, but potentially all the way down to the lower supports in the low $100s before it can see a sustained bounce.

Monitoring AI Valuation - Precision on Upcoming CorrectionThese are the three largest market-cap listed companies on the Nasdaq.
If we are concerned about an AI bubble, I’m going to show you how I perform a quick glance at some top companies and their index to determine the likelihood of an upcoming short-, mid-, or long-term correction.
In 2017, Microsoft’s P/E reached its highest at 45 — and it continued to rise after that.
In 2023, Nvidia’s P/E reached its highest at 147 — and it continued to rise after that.
In 2024, Apple’s P/E reached its highest at 40 — and it continued to rise after that.
Micro E-mini Nasdaq-100 Index
Ticker: MNQ
Minimum fluctuation:
0.25 index points = $0.50
Disclaimer:
• What presented here is not a recommendation, please consult your licensed broker.
• Our mission is to create lateral thinking skills for every investor and trader, knowing when to take a calculated risk with market uncertainty and a bolder risk when opportunity arises.
CME Real-time Market Data help identify trading set-ups in real-time and express my market views. If you have futures in your trading portfolio, you can check out on CME Group data plans available that suit your trading needs www.tradingview.com

MSFT: The “Top Pick” Trap? Or Real Breakout Fuel?Microsoft is testing a critical support zone — and with Morgan Stanley just naming it a top pick in tech, buyers may be gearing up for control. 📈
Quantitative stats back the setup: Sortino Ratio of 0.42 and 90% win rate on this pattern.
👉 What’s your call — breakout to new highs… or one more dip before the rally?

Microsoft Corp.($MSFT) Pullback Forms as AI Momentum Face Test Microsoft Corp. (Nasdaq: NASDAQ:MSFT ) stock slipped 0.34% to $495.43 on Thursday, extending its recent decline from October highs near $555. The retreat reflects broader consolidation in large-cap tech after months of AI-driven gains, with investors reassessing valuations ahead of the company’s next earnings release expected in late January 2026.
The pullback comes as Microsoft’s AI ecosystem continues to evolve rapidly. The company has integrated OpenAI-powered tools across its product lineup, including Microsoft 365, Azure, and GitHub, solidifying its leadership in enterprise AI solutions. However, concerns over slowing cloud revenue growth and competition from Amazon and Google have sparked short-term caution among traders.
Microsoft’s Intelligent Cloud segment remains a core growth driver, generating over $26 billion last quarter. Yet analysts have warned that enterprise clients may delay large-scale AI spending as they evaluate efficiency gains from early deployments. That has prompted expectations for slightly softer Azure revenue growth in the coming quarters.
From a technical perspective, the MSFT chart indicates a potential corrective phase after a strong two-year rally. The price has retreated from resistance around $555, with the next significant support seen near $460, a level that previously acted as a breakout zone. The projected yellow path on the chart suggests a possible retest of that support before a renewed advance toward $580.
Overall, Microsoft’s long-term trend remains bullish, driven by its expanding AI infrastructure, consistent cash flow, and dominant software ecosystem. However, near-term volatility could persist as the market digests regulatory updates and adjusts to a more moderate growth outlook in the AI sector.
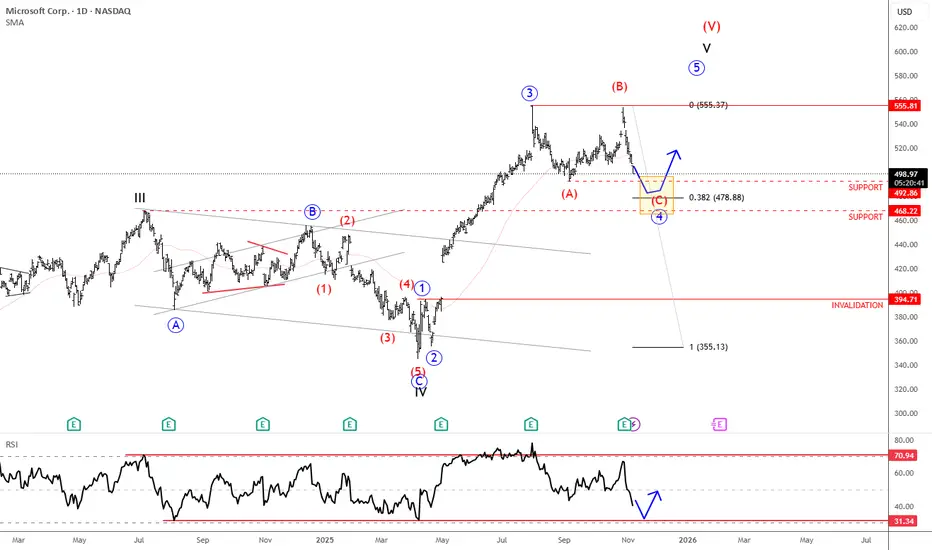
Microsoft Is Finishing Wave 4 CorrectionMicrosoft is in a wave 4 correction, and once it's fully completed, it can extend the rally within wave 5 from a technical point of view and according to Elliott wave theory.
Microsoft is a global technology company founded by Bill Gates and Paul Allen in 1975. It’s best known for its Windows operating system, Microsoft Office suite, and cloud platform Azure. Over the years, Microsoft has expanded into gaming (with Xbox), professional networking (LinkedIn), and AI (through partnerships like OpenAI). Today, it’s one of the world’s most valuable and influential companies, shaping software, hardware, and cloud computing industries.
Microsoft reported earnings last Wednesday after the close, with the price turning lower after reaching new highs. The structure still appears to be a wave four in progress — a flat correction where the current drop likely represents wave C. Wave C often stabilizes near wave A levels, suggesting support around 492 and 468 (the former 2024 high). Holding this zone could set up the next rebound into the final higher-degree wave five.
Highlights:
Trend: Corrective phase, wave C of flat in progress
Potential: Rebound toward new highs once support holds
Support: 492 / 468
Invalidation: Below 394
Note: Watch for stabilization at support before potential wave five continuation
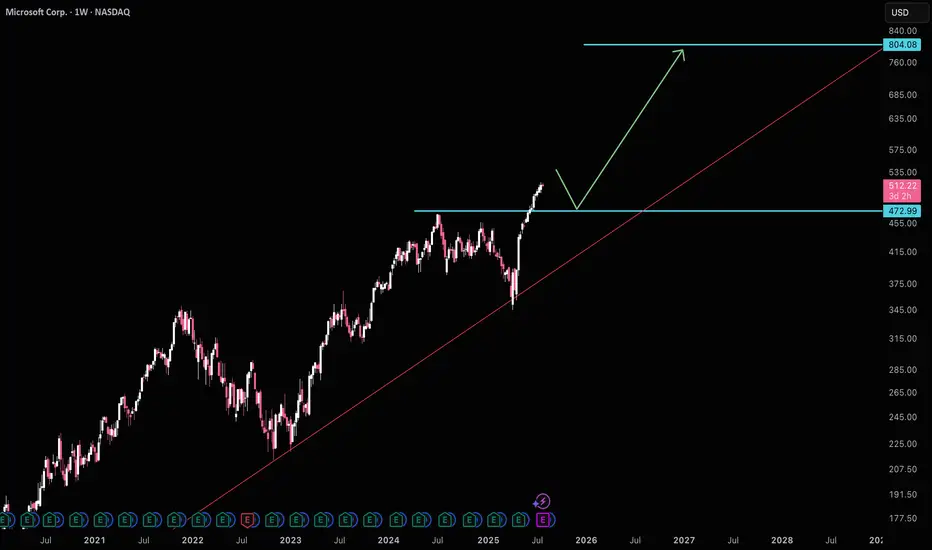
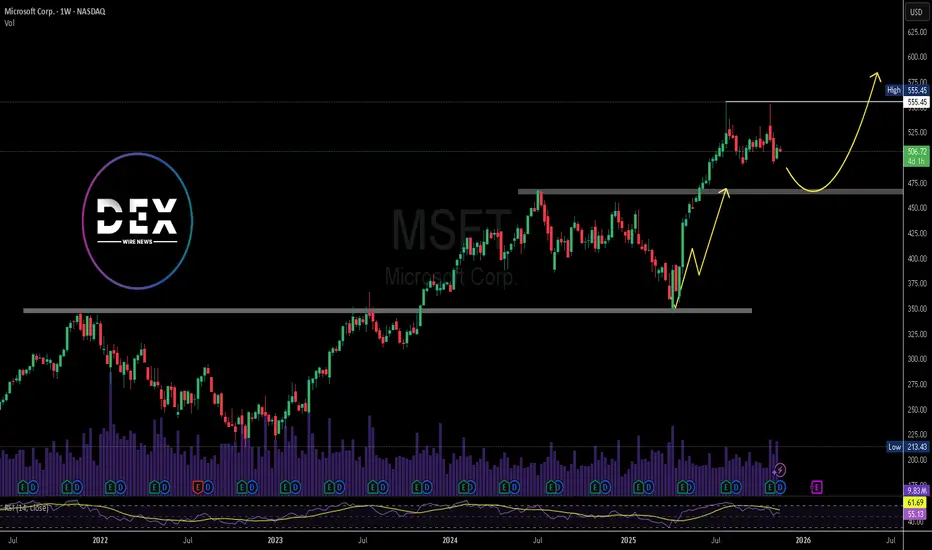
MICROSOFT may fall to $450 if this Support breaks.Microsoft (MSFT) has been trading within a 4-year Channel Up since the November 22 2021 High. Last week it got rejected exactly on its July 28 2025 Resistance (which was a Higher High for the Channel Up) and formed a Double Top, which continues to decline this week as well.
With its 1W RSI also displaying a Bearish Divergence (since the July High) similar to past sell alerts within this Channel Up, it is possible for the stock to correct to at least $450, which represents the 0.5 Fibonacci level where the previous July 2024 - March 2025 correction found Support. That was just above the 1W MA200 (orange trend-line), which also priced the bottom of the October 31 2022 Low but that correction was -38.69%, considerably stronger that -26.54%, which is also plausible if 2026 is a Bear Cycle.
The level that has confirmed those two correction Sell Signals within this Channel Up has been the 1D MA150 (red trend-line). On both occasions, Microsoft closed a 1W candle below the 1D MA150 and confirmed the correction, something that hasn't happened at any other time during these 4 years.
-------------------------------------------------------------------------------
** Please LIKE 👍, FOLLOW ✅, SHARE 🙌 and COMMENT ✍ if you enjoy this idea! Also share your ideas and charts in the comments section below! This is best way to keep it relevant, support us, keep the content here free and allow the idea to reach as many people as possible. **
-------------------------------------------------------------------------------
💸💸💸💸💸💸
👇 👇 👇 👇 👇 👇

MSFT Bearish: H&S Breakdown Eyes 455–465 SupportMicrosoft (MSFT) just cracked lower from a three-month range. After topping near 560 in early August, price chopped between 500 support and 530 resistance before breaking beneath the 20/60-day MAs and the neckline at 510–515. It’s now pressing the 120-day MA around 502 with expanding volatility and heavy sell volume—classic signatures of a confirmed head-and-shoulders top.
Primary path: favor fades into resistance and breakdowns. A weak bounce that stalls inside 515–525 (neckline retest) keeps the short idea intact; a break-and-daily-close below 502 unlocks 490 first, then the 455–465 demand zone. Tactically, shorts can also lean on an intraday trigger (e.g., 1H close below 512) with stops tightened if momentum accelerates. Invalidation for shorts is clean: a daily close back above 531, which would neutralize the breakdown.
Alternative: if 502 holds and buyers reclaim the range, a daily close above 530–531 would negate the bearish structure and open a squeeze toward 555–560. Bulls still have work to do while price sits below the falling 20/60-day MAs and the 530 ceiling.
This is a study, not financial advice. Manage risk and invalidations

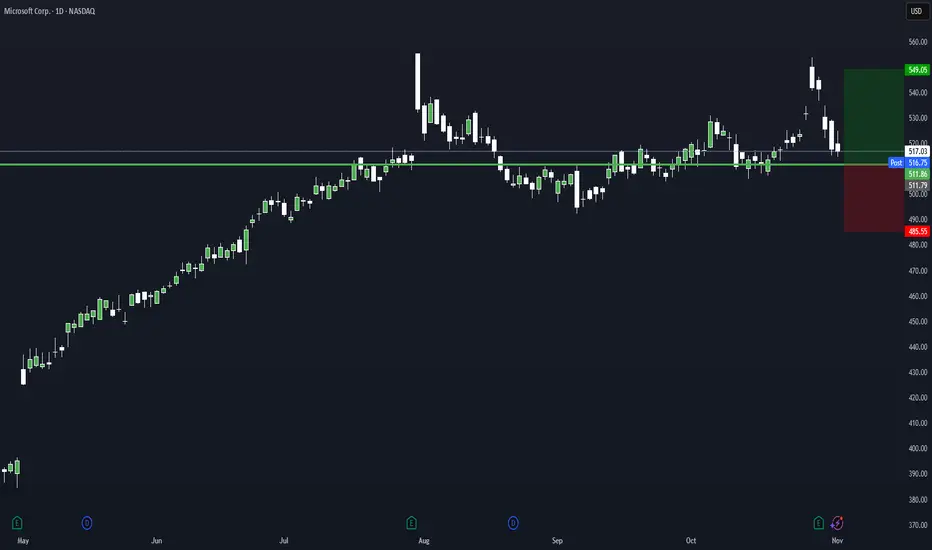
Rebound Setup: Limit-Buy after Short-Term Exhaustion (MSFT)Hi Traders
This is a systematic mean-reversion setup I use across liquid ETFs and large-cap equities.
The goal is simple: enter weakness into exhaustion, not falling knives.
I will place a limit order for MSFT at $511.86. If the order remains unfilled, I will cancel it at the close of trading tomorrow.
Key Concepts:
Oversold short-term conditions
Price deviation vs recent mean
Volume/volatility context
Limit order for the next session only when criteria align
Exit next session open (or rules-based exit, depending on version)
I don’t chase dips — I predefine levels and only enter when price comes to me. This trade idea triggered a limit buy level for today on EFA at 93.55.
General notes:
Works best in mean-reverting environments
Avoid news catalysts & low-liquidity names
This is not a signal service — just a research-based framework
If you like data-driven, rule-based setups, follow along —
I will share more systematic edge ideas like this.
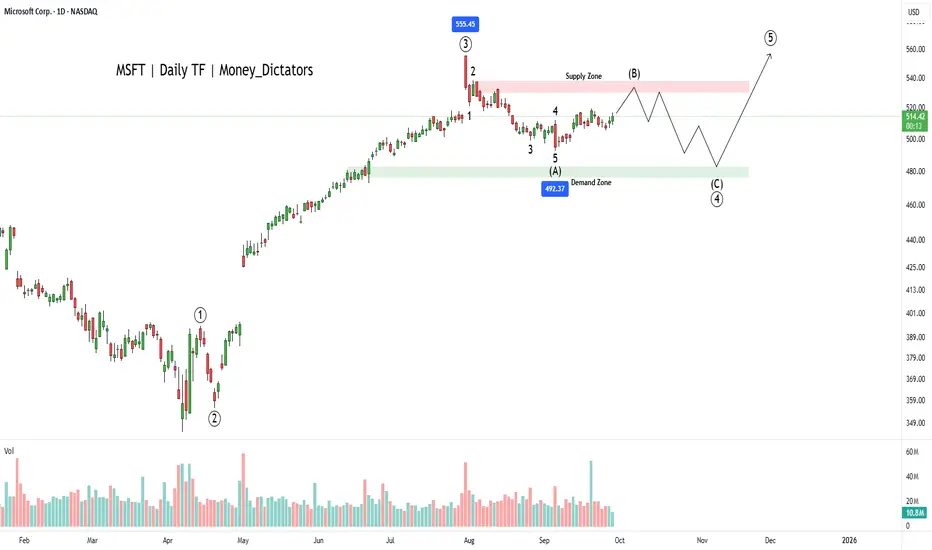
Why MSFT Could Be a Smart Pick in 2025?MSFT has bullish signals from the multiple moving averages, RSI and volume analysis. However, wave principle asks evidence from the buyers. The wave count suggests that the corrective wave (B) is ongoing, and bears will control the final wave of the primary wave 3.
Wave C will start falling nearby the supply zone and high of the 2nd wave of wave intermediate wave A. Wave C can fall up to 476 which will be the strength for wave primary wave 5. As per the chart, breakout above 540 will be a good signal for bulls to take charge back.
Zones:
Supply zone: 538 - 528
Demand zone: 482 - 476
I will update the chart and details shortly.