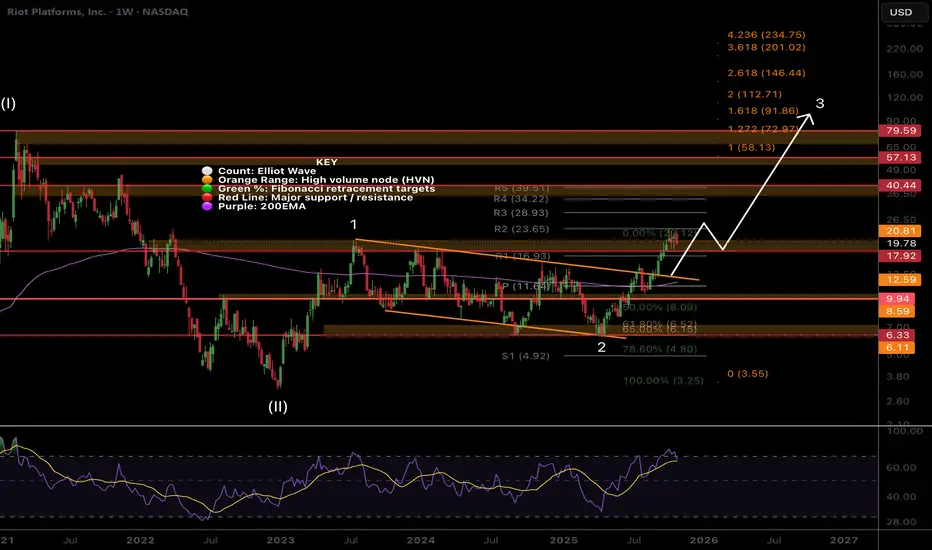
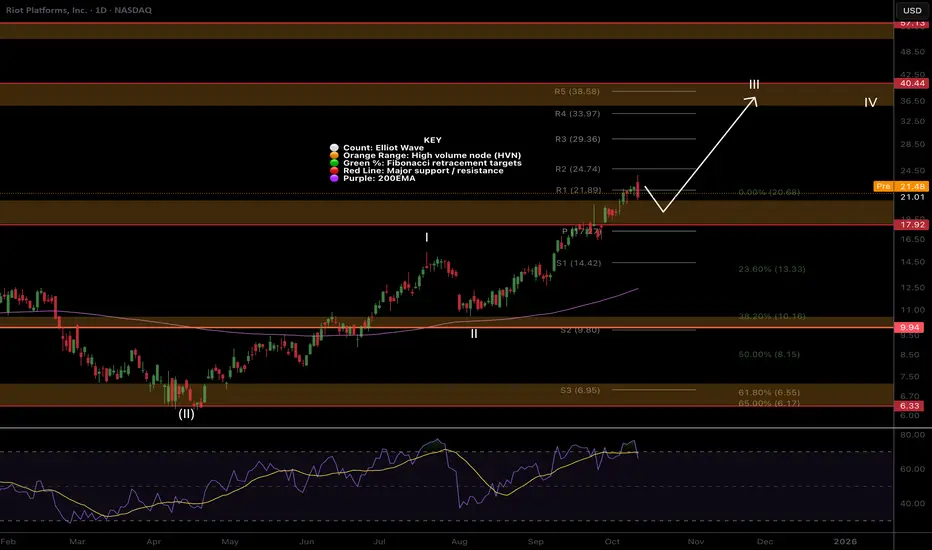
RIOT, nothing changed, Higher...Riot is another low cap volatile asset that keeps people afraid with its wild swings as I am seeing panic in my comments across platforms.
Price remains in momentum breaking out of the channel in a wave 3 with a minimum target of the 1.618 Fibonacci extension at $91, a 4x from here. Wave 2 completed at triple support- Fibonacci golden pocket, High Volume Node and channel boundary before quickly overcoming the weekly pivot and 200EMA. Breaking out above wave 1 is a show of strength.
Price should stall at the High Volume Nodes as supply comes in; $21, $40 and $57 but ultimately they should be overcome.
🎯 Terminal target for the business cycle could see prices as high as $112 based on Fibonacci extensions
📈 Weekly RSI is oversold with no divergence and can remain here for months as price keeps increasing.
👉 Analysis is invalidated if we close back below $9
Miner
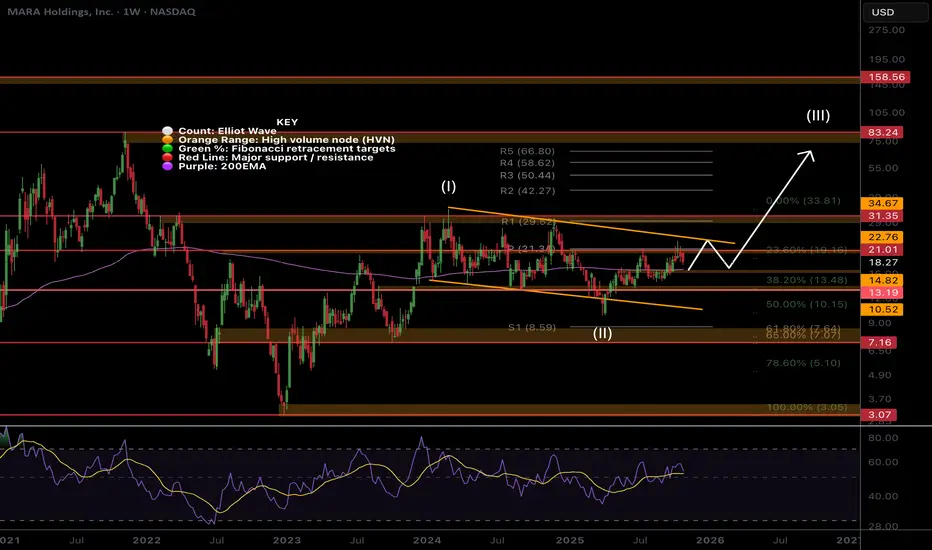
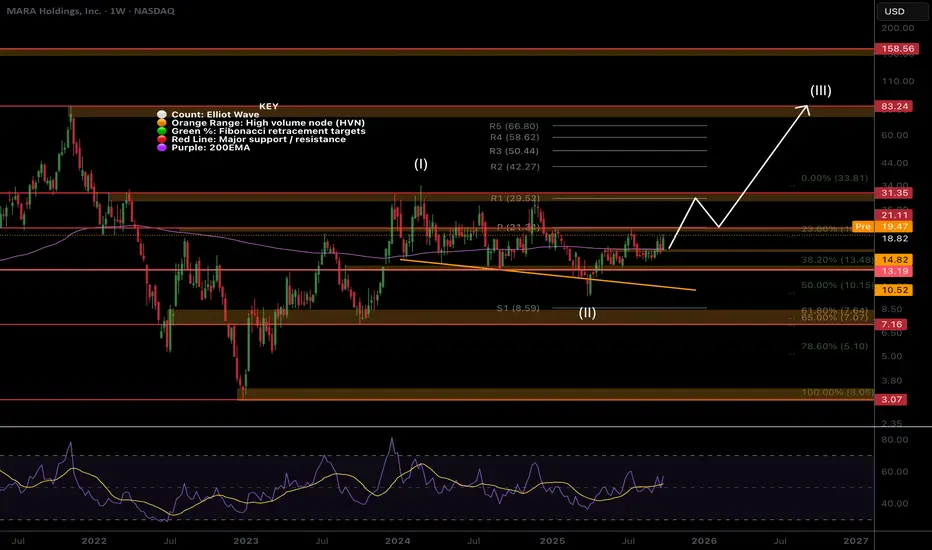
MARA boring... Investors cant waitMara has the potential for a strong move alongside Bitcoin but has ultimately been boring. Investors struggle the most with boredom and see is as negative and bearish. This is not the case and it could just be accumulating towards a strong breakout.
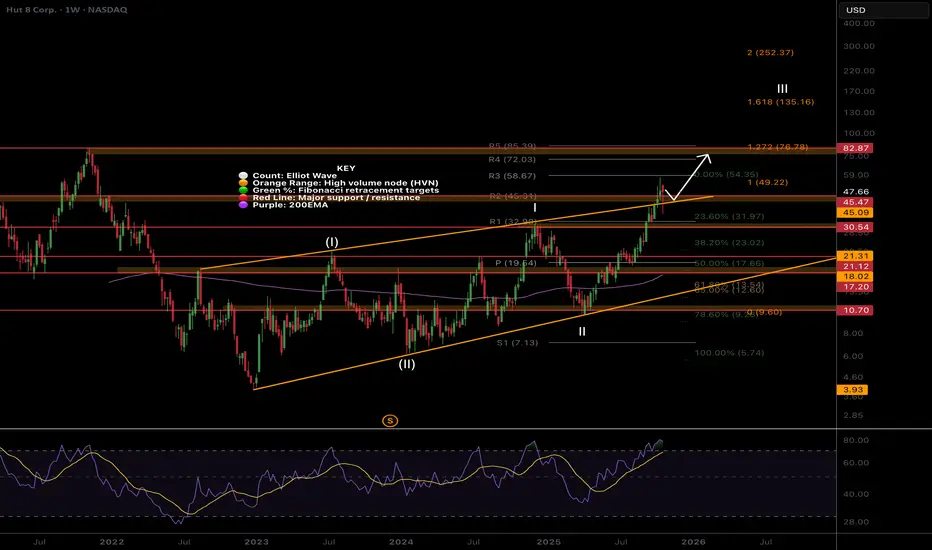
Price is stalling at the weekly pivot as expected but is above the 200EMA- a great buy spot. Wave (II) appears complete at the 0.5 Fibonacci retracement with a swing below the lower boundary trend-line. Wave 3 of (III) appears to be underway so I am looking for an aggressive breakout to the upside once we clear the current resistance. The R1 pivot is the first target at $30 where the last bit of major resistance is. Wave (III) has a target of $83 at the next major High Volume Node resistance, just above the R5 pivot.
🎯 Terminal target for the business cycle could see prices as high as $80 based on Fibonacci extensions and High Volume Nodes
📈 Weekly RSI is at the EQ.
👉 Analysis is invalidated if we close back below wave 2 at $9.50.
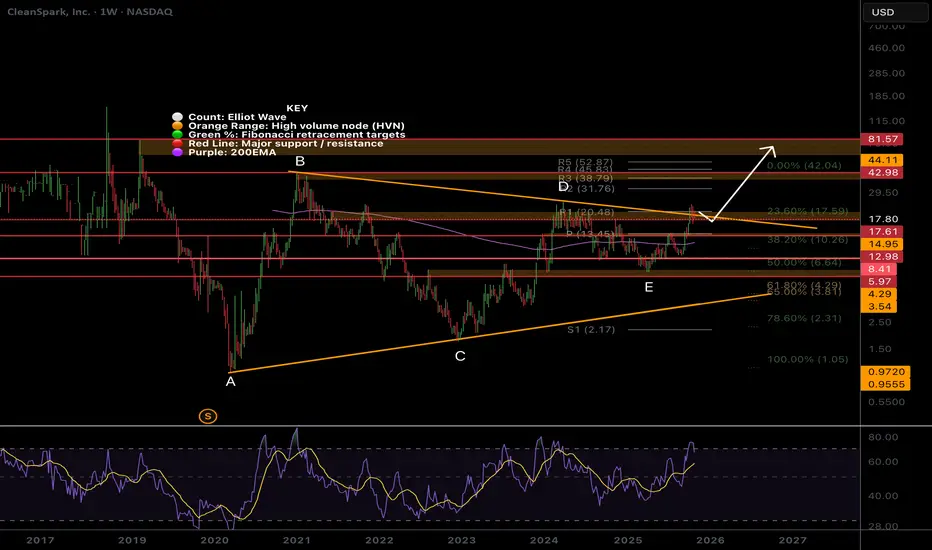
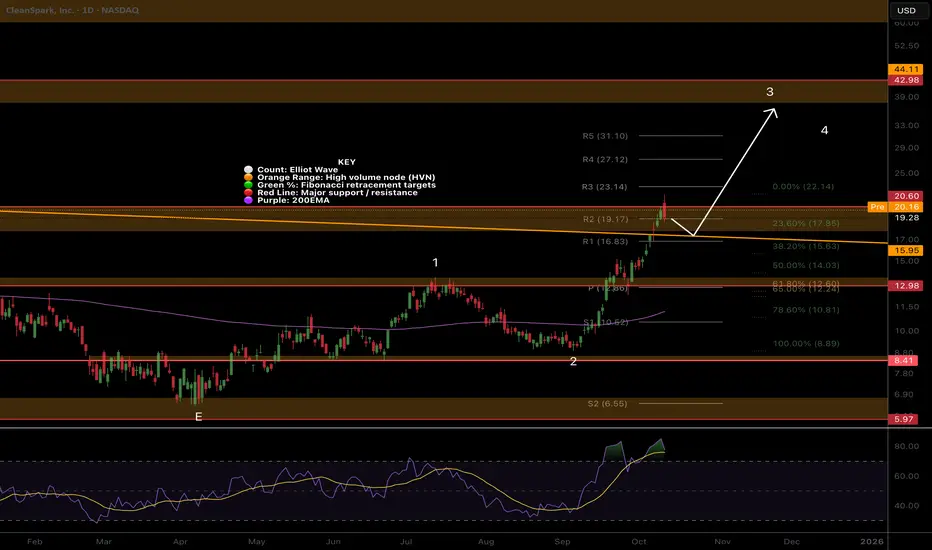
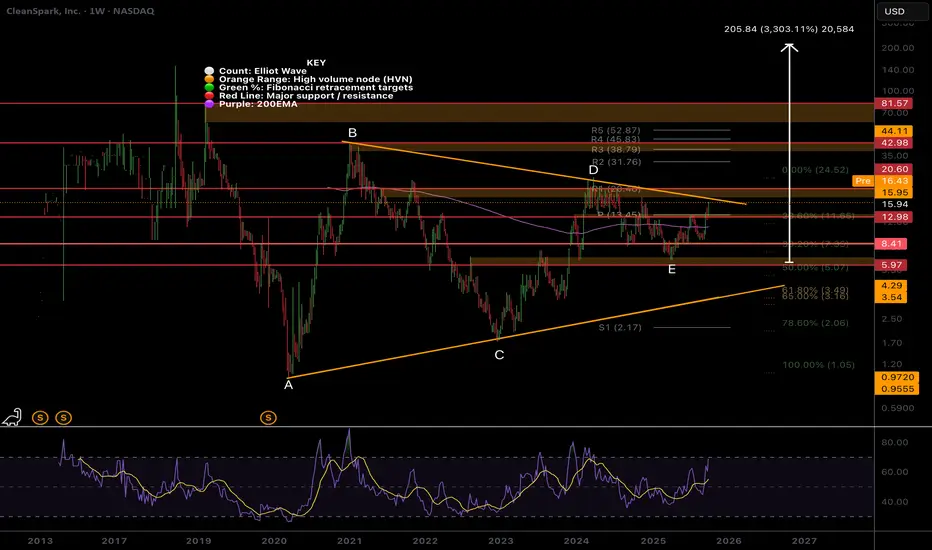
CLSK, Still much higher to goTheres a lot of fear in my comments across platforms due to the candle sizes. Participants need to understand the volatility of their holdings or face repeated mistakes and stress due to fear.
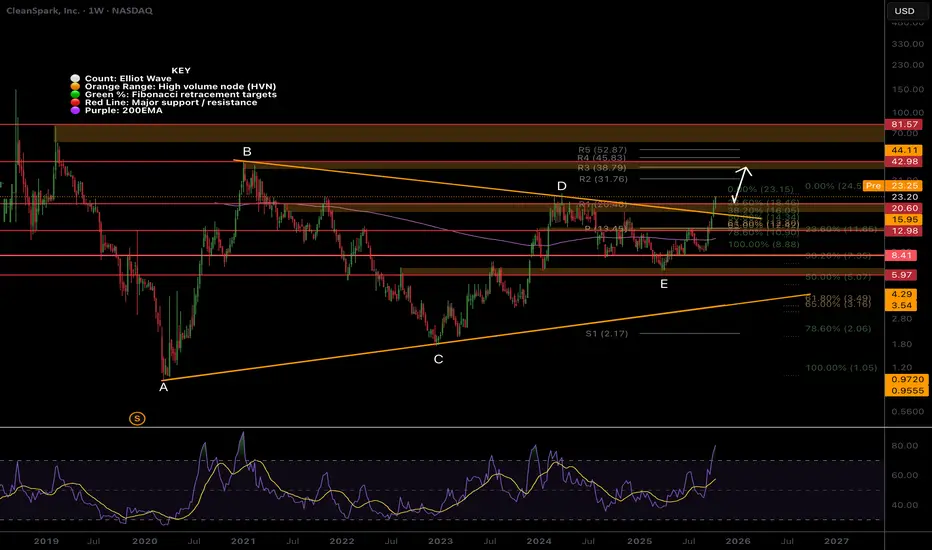
Price is attempting to breakout of the macro triangle upper boundary but was rejected. Breaking above wave D at $24 is key to trigger the next thrust I’m looking for towards $42 then $80 all time High Volume Node. Triangles are penultimate patterns found before a final strong move.
Price has momentum above the weekly pivot 200EMA but currently trapped in a High Volume Node where we expect price to stall before continuing upwards.
🎯 Terminal target for the business cycle could see prices hit $80- the all time High Volume Node
📈 Weekly RSI is oversold with no divergence and can remain here for months as price keeps increasing.
👉 Analysis is invalidated below wave E, keeping the triangle alive
BTDR Nothing changedHuge daily candles are perfectly normal behaviour and nothing to be afraid of, we stay zoomed out to observe the larger trend to keep our emotions check. It is feature of these type of assets and is why we can make so much money from them when using the right risk management strategy.
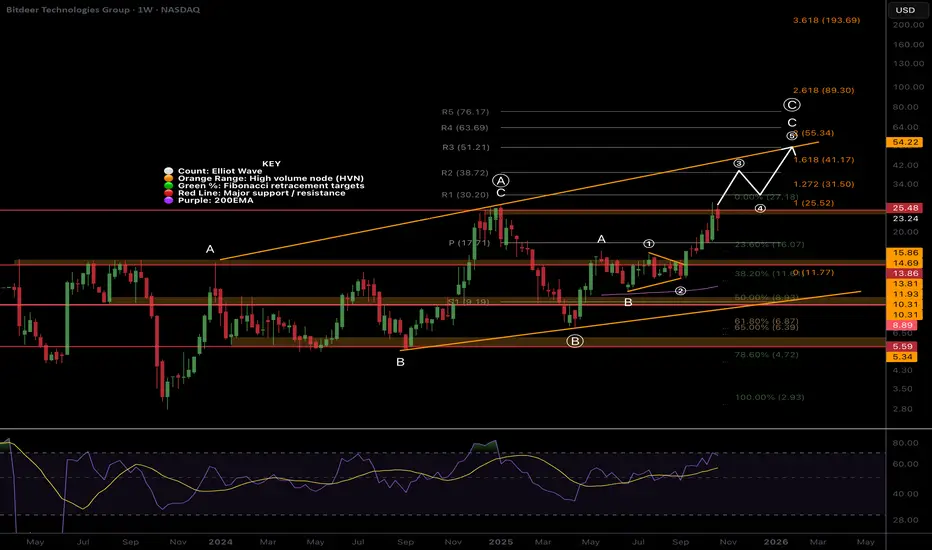
Our first profit target has been hit at $25 all time High Volume Node where price is finding a range as some exit. Price has done 10x since the 2023 bottom. Once this range has worked itself out price is expected to continue upwards into price discovery. A retracement to the weekly pivot should be expected, where I will add to my positions and look for a long.
The macro structure is bullish in an Elliot wave ABC as there are many series of 3 wave structures. Wave (3) of C of (C) is underway with a target of the 1.618 Fibonacci extension $41.17. Price can significantly overextend in volatile assets with momentum and it’s these extremities we look to take secondary profit.
🎯 Terminal target for the business cycle is still the channel upper boundary and R3 weekly pivot at $55. A break out above this would be very bullish and could see prices as high as $80+
📈 Weekly RSI has months left of upside potential.
👉 Analysis is invalidated below wave B and 200EMA, $11.

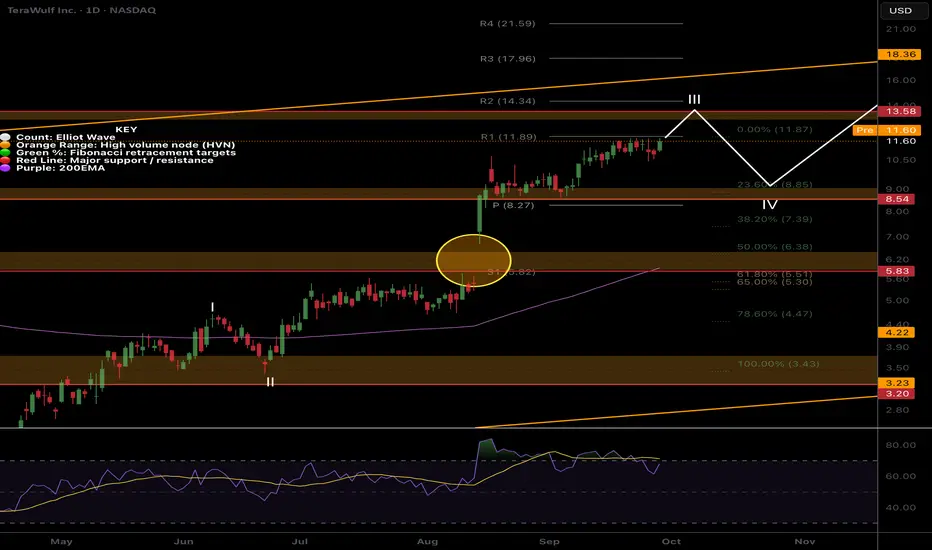
Wulf exhausted?NASDAQ:WULF appears exhausted at the upper channel boundary and I have exited completely for now. The Elliot wave pattern completes a leading diagonal which hints at higher to go after a wave 2 pullback which could end at the 0.382 Fibonacci retracement but more a likely target is the 0.5 Fib at $5.84 also the weekly 200EMA.
Breaking out above the channel would change the count and structure and be very bullish. RSI has been overbought for a while. For now we watch and wait.
Safe trading

MARA Strong breakout incomingNASDAQ:MARA is stalling at the weekly pivot as expected but is above the 200EMA. Wave (II) appears complete at the 0.5 Fibonacci retracement with a swing below the lower boundary trend-line.
Wave 3 of (III) appears to be underway so I am looking for an aggressive breakout to the upside once we clear the current resistance. The R1 pivot is the first target at $30 where the last bit of major resistance before the stronger breakout should come in, the High Volume Node.
Wave (III) has a target of $83 at the next major High Volume Node resistance, just above the R5 pivot.
Analysis is invalidated if we fall below $10. RSI is at the EQ with plenty of room for upside
Safe trading

IREN Exhausted? PUllback time?IREN wave (3) ran incredibly and I am looking for a deeper pullback as people begin to take profit. I have closed my positions at a 10x and am waiting for re-entry. The weekly pivots have been ran, RSI is at max overbought but can remain here for months (as it has done).
Initial downside targets for wave (4) is the 0.236 Fib retracement at $39 followed by the 0.382, $26.43. Expect shorts to pile in adding to any downside momentum.
In the long term I believe we have much higher to go towards $100 in wave (5).
Safe trading

$HUT Breaking out, test of channel done and dusted!Hut has broken out of the channel upper boundary and a test of the boundary took place as expected, quickly catching a bid and recovering 17% Friday, producing a long signal for me.
The next target is the High Volume Node resistance at $82 just under the R5 weekly pivot. Fibonacci extension has a minimum target of the 1.618, $135.
The Elliot wave count suggests a very bullish move come in wave III of (III) which would overextend the 1.618 target above, $200+.
RSI is overbought but can remain here for months.
Safe trading
CLSK, nothing changed, $40+ incoming, 2x minNASDAQ:CLSK is low cap asset and is prone to large volatile swing like we are seeing but also gives way to opportunities.
Price is attempting to breakout the macro triangle upper boundary was rejected at first. Breaking above wave D at $24 is key to trigger the thrust I'm looking for towards $42 and $80 all time High Volume Node after that.
Price has momentum above the weekly pivot 200EMA but currently trapped in a High Volume Node where we expect price to stall before continuing upwards.
RSI can stay in overbought for months.
Participants are still afraid of this asset coming against them and its volatility, a reflection of the broader sentiment of FEAR in retail that is still persisting at all time high. Ridiculous bear market PTSD.
A recipe for MUCH higher. until market wide confidence takes hold.
Safe trading

Bitdeer BTDR Macro Outlook. Nothing changed, Min 2x to come $54NASDAQ:BTDR is a low-cap volatile asset so traders and investors should expect wild pullbacks like we are seeing and is feature of these type of assets and is why we can make so much money from them when using the right strategy.
The macro structure is bullish in an Elliot wave ABC as there are many series of 3 wave structures.
Wave (3) of C of (C) is underway with a minimum target of the 1.618 Fibonacci extension $41.17 but price can significantly overextend in these assets.
Terminal target is the channel upper boundary and R3 weekly pivot at $55. A break out above this would be very bullish and could see prices as high as $80+
RSI has months left of upside. Analysis is only invalidated below the 200EMA.
Safe trading
RIOT wave 3 continues, $57 min targetWave 3 continues in NASDAQ:RIOT per previous posts with a minimum target of the $57 High Volume Node

CLSK Almost confirmed huge macro triangle breakout signal!NASDAQ:CLSK Should hit the wave D high today signalling the macro triangle breakout is ready to really move!
Nothing more to add.. send it!
Safe trading
BTDR Volatile, but uptrend intactNASDAQ:BTDR had a huge bearish engulfing candle Friday. I keep my positions smaller on these assets.
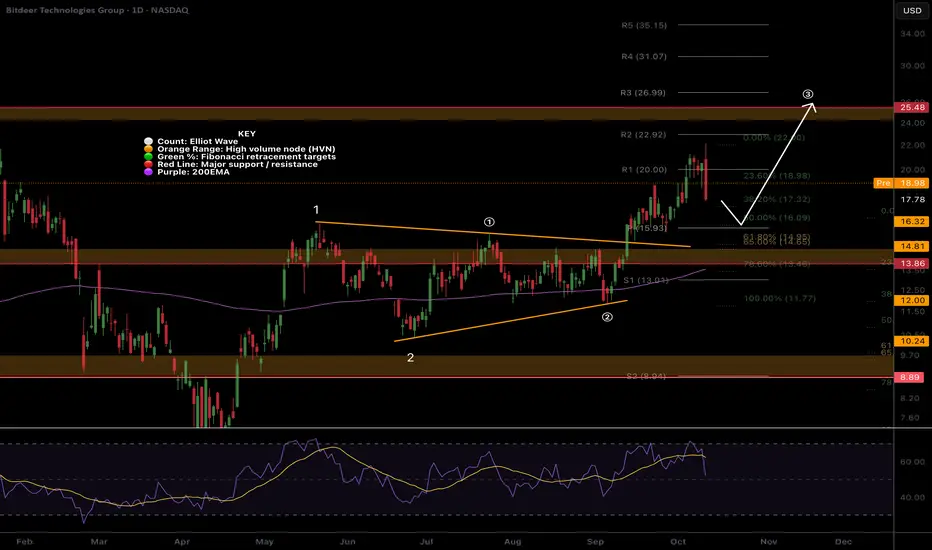
Price is still in a wave 3 breakout towards the $25 High Volume Node target. It appears wave (1) of 3 is complete with a wave (2) target of the daily pivot and 0.5 Fibonacci or golden pocket zone nearby. That would also test the untested wave 1 high as support a highly likely event.
RSI has reset to the EQ where it often finds support in a strong uptrend.
Safe trading
RIOT.. Nothing changed, $40 targetNASDAQ:RIOT broke out through resistance earlier than expected! A retest of the High Volume Node as support is highly likely event and price has a little down to go to get there. It may even be front run today.
RSI is overbought with no bearish divergence and can persist here for months in trending asset.
Wave II is underway and the next target is $40 High Volume Node resistance and the R5 daily pivot.
Safe trading
CLSK Rejected at thr major resistance, higher to go CLSK hit our first take profit target at the major resistance High Volume Node but has broken out of the macro triangle structure hinting at a big move still to come! Nothing concerning for me yet happening.
Wave 3 is underway to a minimum target of the $40 High Volume Node
RSI is overbought but no divergence and this can persist up here for months.
Safe trading
RIOT Continues in Wave 3. Resistance? What resistance?NASDAQ:RIOT shot straight through resistance now support with only a small consolidation. The path should be clear for a stronger move towards $38

CLSK Breaking out!CLSK continues with momentum closing above the macro triangle upper boundary trend-line and now testing the last resistance before a breakout! This will coincide with a break above wave D and flip the macro structure bullish bringing in more capital!
Daily RSI is overbought with slight bearish divergence but can remain this way for weeks in a strong uptrend!

IREN Wont Quit! Fib extension Analogue targets..NASDAQ:IREN Has ran all the weekly pivot in an astonishing wave III. RSI is extremely overbought.
The next Fibonacci extension targets (analogue scale) are the 3.618 at $59 and the 4.236 at $68 for a wave 3 termination.
Fibonacci log targets are as high as $400 but this seems unrealistic so switched to analogue in this case! Stranger things have happened still...
Safe trading

BTDR Closed above the weekly pivot!NASDAQ:BTDR Wave (3) is underway and price has overcome the weekly pivot for now and bulls want to see this hold! The trend is up, the supports have been tested and the all time High Volume Node is the next target $25.
Fibonacci extension targets are minimum if $38 at the 1.618 with possibility to overextended bringing up the next target of the R5 weekly pivot at $76
RSI is not overbought and has plenty of room to grow, reaching the next leg often kicks in serious momentum!
Safe trading

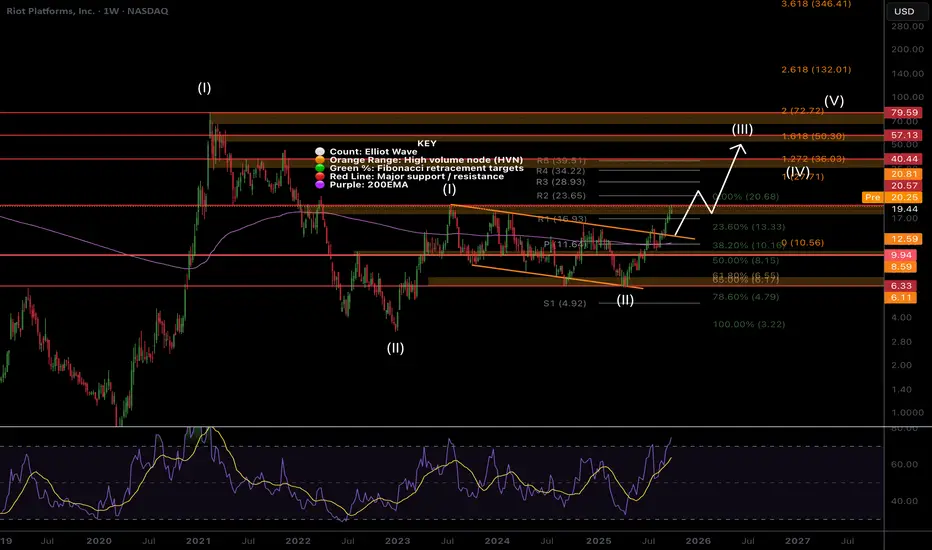
RIOT Macro, Higher for Longer!RIOT’s weekly RSI is overbought but can stay like this for many months as price continues upwards, just look at IREN!
Elliot wave (II) completed at the golden pocket. Price is finding minor consolidation at the wave (I) High Volume Node but is expected to break through with current price action and accelerate to $40, the High Volume Node and R5 weekly Pivot. Momentum is in control. Wave (III) has a minimum target of $50, per Fibonacci extension rules.
Safe trading
MARA Ready To Finally Move towards $30?MARA’s Elliot Wave (II) retracement front run the Fibonacci golden ratio and has now overcome the weekly 200EMA. The weekly pivot looms as strong resistance $21 just above the first target of our recent trade signal. If wave (III) is underway we should see price begin to accelerate alongside Bitcoin with an initial target of $31 followed by $80 High Volume Node.
Expect price to consolidate at the wave (I) resistance $30 for a while. Weekly RSI is crossed bullishly at the range EQ giving it room to move bullishly!
Safe trading
CLSK Testing Macro Triangle Upper Boundary!NASDAQ:CLSK Macro analysis shows a multi-year triangle has completed at the mid EQ, where price has the highest probability of completing wave E. CRYPTOCAP:XRP Did a x10 after this breakout and I am expecting similar move with CLSK.
Price should consolidate for a while in $16-$20 range as it works through wave D and trend-line resistance. Downside target is the weekly pivot at $13.45 which could offer a great buy!
All time high sits at $80, triangle pattern target is extremely high at $200 (triangle height measured from wave E bottom) but take this with a pinch of salt and keep your profit taking realistic! Crazier price moves have happened!
Weekly RSI is not yet oversold and price often gathers months of strong momentum when RSI gets to these levels reinforcing the analysis.
Safe trading
WULF Still in wave 3!NASDAQ:WULF continues to push onwards in wave 3 although gradually. The first target remains $13.48 High Volume Node followed by the macro channel upper boundary trend-line.
Support target is the daily Pivot and High Volume Node at at $8.27 and this is also the wave 4 expected Fibonacci retracement zone of 23.6-38.2.
Daily RSI does have bearish divergence from overbought so a retracement is likely.
Safe trading