NASDAQ 100 (NQ1!): Wait For Valid Buys! #nasdaq Welcome back to the Weekly Forex Forecast for the week of Oct. 20-24th.
In this video, we will analyze the following FX market: NASDAQ (NQ1!) NAS100
The NASDAQ had ranged last week, but had a bullish end on Friday. I suspect we may see some continuation to the upside this week.
Wait for confirmation before taking valid buys setups.
I don't see a reason to look for sells. A bearish break of market structure would be a good reason.
Enjoy!
May profits be upon you.
Leave any questions or comments in the comment section.
I appreciate any feedback from my viewers!
Like and/or subscribe if you want more accurate analysis.
Thank you so much!
Disclaimer:
I do not provide personal investment advice and I am not a qualified licensed investment advisor.
All information found here, including any ideas, opinions, views, predictions, forecasts, commentaries, suggestions, expressed or implied herein, are for informational, entertainment or educational purposes only and should not be construed as personal investment advice. While the information provided is believed to be accurate, it may include errors or inaccuracies.
I will not and cannot be held liable for any actions you take as a result of anything you read here.
Conduct your own due diligence, or consult a licensed financial advisor or broker before making any and all investment decisions. Any investments, trades, speculations, or decisions made on the basis of any information found on this channel, expressed or implied herein, are committed at your own risk, financial or otherwise.
Nasdaq100

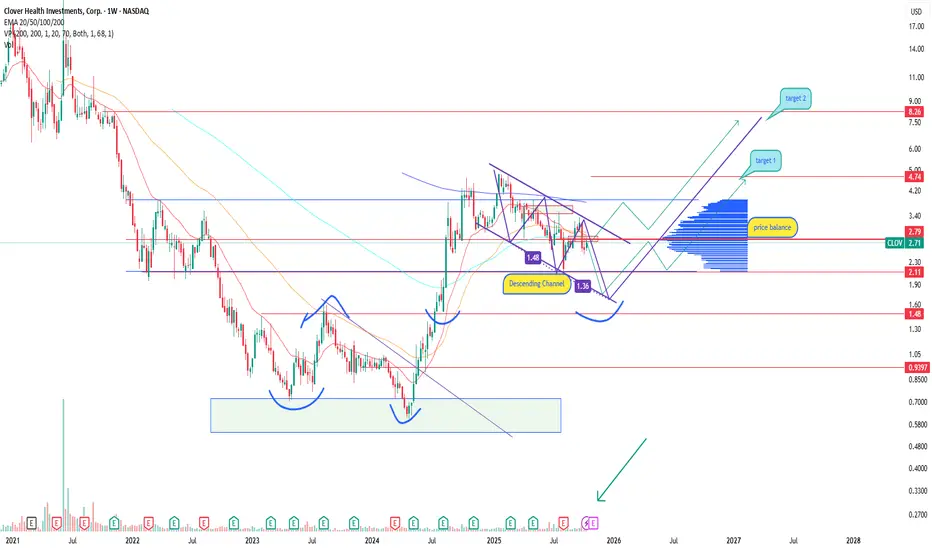
Topic: Clover Health growth emerging after a long declineClover Health (CLOV) stock is trading within a descending channel, approaching the lower boundary around 1.36–1.48, which previously acted as a demand zone. Rising volume suggests renewed buyer interest, and the flattening EMA 50/200 lines point to a potential trend reversal. A breakout above 2.80 could unlock targets at 4.74 and 8.26 — key supply levels.
Clover Health is a health-tech company providing AI-driven healthcare insurance and analytics solutions. After a restructuring phase and a reduction in losses, the company shows signs of stabilization. Improved financials and the growing focus on healthcare innovation could serve as catalysts for a new growth phase.
As long as the price holds above 2.10, the recovery scenario remains valid. A breakout from the descending channel may confirm the start of a mid-term bullish trend. Still, given the sector’s volatility, risk management is crucial.
NASDAQ 100 Resistance Reaction and Countertrend Short SetupThe NASDAQ 100 has rallied strongly and is now trading near the top of its current range 📊. Price is approaching a key resistance level, and I’m expecting a potential reaction from liquidity above the highs, followed by a retracement back to equilibrium — around 50% of the current price swing 📉.|
A countertrend short setup could be considered here, with the option to take partial profits early to reduce risk 💡. Full details of the trade idea and execution are explained clearly in the video.
⚠️ Disclaimer: This is for educational purposes only and not financial advice.

US100 Bearish Bias!
HI,Traders !
#US100 keeps growing
But a horizontal resistance
Level of 25039.3 is nearby
So after the retest of the
Level we will be expecting
A local bearish correction
On Monday !
Comment and subscribe to help us grow !

NAS100 Technical Outlook (18–25 Oct 2025)Trend Summary:
NASDAQ 100 remains in a corrective phase after rejecting near the 25,200–25,300 resistance zone. Recent price action forms a potential Wave 4 retracement within a medium-term bullish Elliott structure.
1D Chart View:
The index is hovering around key support at 24,750, aligned with the 3 8.2% Fib retracement of the prior leg and near daily EMA50. A bullish reversal from this zone would confirm continuation toward 25,800–26,000.
4H Structure:
A descending channel is observed, acting as a corrective pullback. Ichimoku Cloud shows price testing the lower edge; a break above 25,050 could signal momentum recovery. Volume divergence hints at accumulation beneath.
1H / 30M:
RSI forming a higher low while price prints a lower low — a bullish divergence setup. Bollinger Bands are tightening, suggesting volatility expansion ahead. Watch VWAP reclaim above 25,000 for confirmation of short-term trend reversal.
15M / 5M Intraday Bias:
Short-term traders should monitor the 24,800–24,750 zone for a bounce. Failure below this area exposes 24,620, while a decisive break above 25,050 may trigger an intraday rally targeting 25,250–25,300.
🎯 Trading Plan
Bullish Scenario:
Buy Zone: 24,750–24,800
Targets: 25,050 → 25,250 → 25,800
Stop Loss: 24,580 (below structure low)
Bearish Scenario (alternative):
Sell Zone: 25,250–25,300 (resistance rejection)
Targets: 25,000 → 24,750 → 24,620
Stop Loss: 25,400
🔍 Confluence Factors:
Elliott Wave: Wave 4 correction likely ending.
Fibonacci: 38.2–50% retracement aligning with structure support.
Ichimoku: Testing lower cloud — potential bullish crossover setup.
RSI Divergence: Positive momentum building.
VWAP: Reclaim signals early buyer strength.
Volume: Accumulation noted during low volatility phase.
📘 Outlook Summary:
Bias remains cautiously bullish above 24,750, targeting 25,800–26,000.
Break below 24,620 invalidates bullish structure and opens path to 24,300–24,200.
NAS100 traders should monitor intraday reactions and volume confirmations near key zones. This week may define whether the correction phase transitions into a new impulsive wave or deeper retracement.

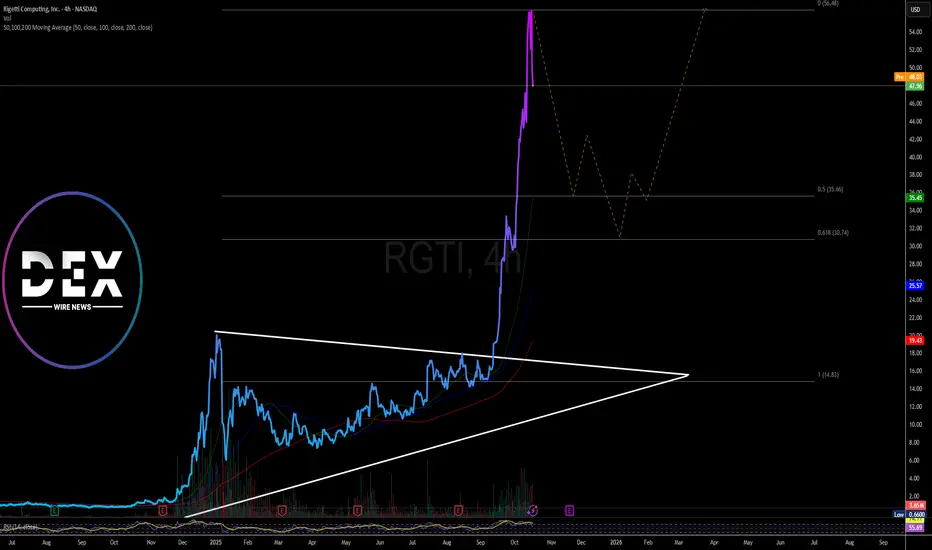
Rigetti Stock (RGTI) May Retraced After Breaking Out of A Wedge The share price of Rigetti Computing, Inc. (NASDAQ: NASDAQ:RGTI ) is poised to retraced to the 61.8% fib. retracement level after a wonderful stint- The computing giant spike 218% in the past 1 month to break out of a bullish symmetrical triangle to reclaim the $50 zone.
With the last recorded SI at 55, NASDAQ:RGTI might consolidate more pushing the RSI to 35 amidst bearish sentiment.
The stock was down 14% in yesterday's trading session further pushing the loss to premarket trading currently down 1.48%.
Further adding to the bearish sentiment is the fact that the founder- Subodh Kulkarni, has no stake whatsoever in the quantum technology company.
In May, Kulkarni exercised options to acquire 1,000,000 shares, only to sell them immediately – leaving him with zero ownership in RGTI.
About RGTI
Rigetti Computing, Inc., through its subsidiaries, builds quantum computers and the superconducting quantum processors the United States, the United Kingdom, rest of Europe, Asia, and internationally. The company offers quantum processing units (QPUs) and quantum computing systems through the cloud in the form of quantum computing as a service (QCaaS) products. It also provides 9- ubit quantum processing unit under the Novera QPU trade name; 84-qubit Ankaa-3 system under the name Novera QPU; and sells access to its quantum computers
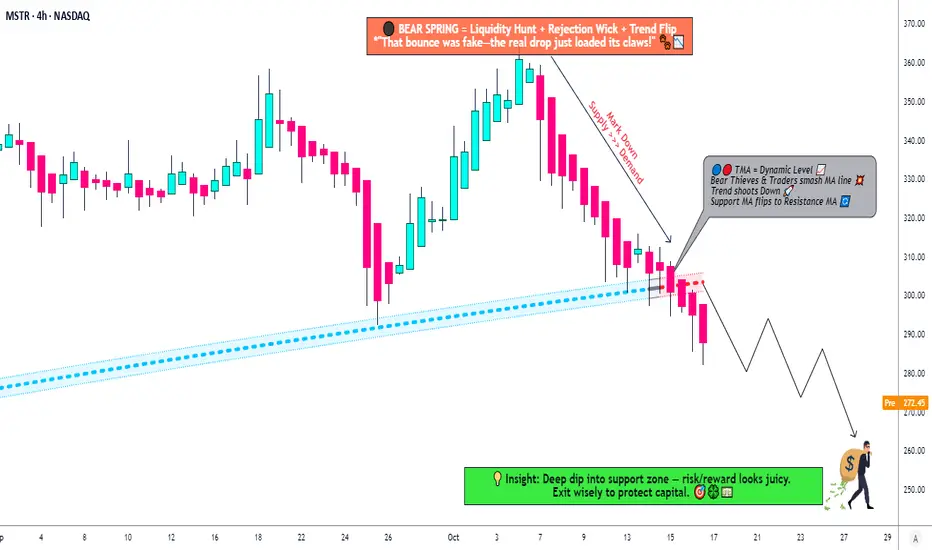
MSTR: Time to Short? Death Cross + Triangle Break Analysis🐻 MSTR "STRATEGY INC." - The Bear's Playground | Thief's Multi-Layer Setup 💰
📊 MARKET SNAPSHOT
Asset: NASDAQ:MSTR (Strategy Inc. - formerly MicroStrategy)
Current Price: ~$291.23 (Oct 17, 2025)
Setup Type: Swing/Day Trade - Bearish Confirmation
Strategy Style: "Thief Method" - Layered Limit Orders 🎯
🔍 THE SETUP - Why This Bearish Play Makes Sense
Ladies and Gentlemen, welcome to the Thief's playbook! 👋 MSTR just gave us a beautiful bearish signal with a triangular moving average breakdown. Here's what the charts are screaming:
🎯 The "Thief" Entry Strategy - Layered Limit Orders
This isn't your typical "buy now" play. We're sneaking in like a thief in the night with MULTIPLE SELL LIMIT LAYERS:
Entry Zones (Layer Your Shorts):
Layer 1: $310 (First resistance retest)
Layer 2: $300 (Psychological level)
Layer 3: $290 (Current consolidation zone)
💡 Pro Tip: Scale into your position! You can add MORE layers based on your risk tolerance (e.g., $305, $295, $285). The "Thief Method" is all about spreading your entries to catch the perfect price zones.
🛑 RISK MANAGEMENT - The Thief's Insurance Policy
Stop Loss: $320 🚨
(This is the Thief's emergency exit - if price breaks above this, the bears lost control)
⚠️ IMPORTANT NOTE:
Dear Thief OG's (Original Gangsters), this is MY stop loss level based on MY analysis. You should set YOUR OWN stop loss based on YOUR risk tolerance. Don't copy blindly - manage YOUR money, take YOUR profits (or losses) at YOUR own risk! This is YOUR trade, not mine. 💯
🎯 PROFIT TARGET - Where the Money's Hiding
Primary Target: $250 🎉
Why $250?
Strong historical support level
Oversold bounce zone (RSI typically rebounds here)
TRAP ALERT: Institutional buyers often accumulate at this level - be ready to ESCAPE with your profits before the bulls wake up! 🐂💤
⚠️ TAKE PROFIT NOTE:
Dear Thief OG's, $250 is MY target based on MY analysis. You can (and should) set YOUR own targets. If you're in profit at $270, $260, or even $280 - TAKE THE MONEY AND RUN! 💰 No shame in banking profits early. Remember: pigs get fat, hogs get slaughtered. This is YOUR trade, YOUR risk, YOUR decision!
🔗 RELATED ASSETS TO WATCH - The Correlation Game
MSTR doesn't trade in a vacuum! Keep your eyes on these correlated assets:
📈 Primary Correlation:
CRYPTOCAP:BTC (Bitcoin): ~$108,625 (Oct 17, 2025) - MSTR holds 640,000+ BTC (3%+ of total supply!)
Correlation Strength: 🔥🔥🔥🔥🔥 ULTRA HIGH
Why It Matters: MSTR is essentially a leveraged Bitcoin play. When BTC sneezes, MSTR catches a cold. Bitcoin's current bearish pressure directly impacts MSTR's valuation.
🔄 Secondary Watchlist:
NASDAQ:COIN (Coinbase): Crypto exchange - sentiment indicator
NASDAQ:RIOT (Riot Platforms): Bitcoin mining stock
NASDAQ:MARA (Marathon Digital): Another BTC-related equity
NASDAQ:CLSK (CleanSpark): Bitcoin mining operations
Key Point: If Bitcoin breaks below $105K support, expect MSTR to accelerate downward. Conversely, if BTC rallies back above $115K, this bearish setup could invalidate. Watch Bitcoin like a hawk! 🦅
📊 THE BIGGER PICTURE - Why MSTR Is Vulnerable Right Now
Bitcoin Pressure: BTC down -2.19% today, testing critical support levels
Institutional Caution: Recent S&P 500 rejection (not included in index) = credibility questions
Valuation Concerns: Trading at significant premium to NAV (Net Asset Value)
Technical Breakdown: Multiple MA crosses + trend reversal signals
Macro Headwinds: Risk-off sentiment in crypto markets (3-day consecutive decline)
🎓 THE THIEF'S WISDOM - Final Thoughts
This setup combines:
✅ Technical confirmation (MA breakout)
✅ Layered entry strategy (better average price)
✅ Clear risk management (defined stop loss)
✅ Realistic profit targets (strong support zone)
✅ Correlated asset monitoring (BTC relationship)
Remember: The market doesn't care about your opinion. Respect the charts, manage your risk, and don't get greedy. The "Thief Method" is about stealing profits intelligently, not gambling recklessly! 🎰❌
💬 TRADE SMART, NOT HARD!
This is a BEARISH SETUP with defined entries, exits, and risk parameters. Whether you're swing trading or day trading, the key is DISCIPLINE. Stick to your plan, don't chase, and protect your capital.
Questions? Thoughts? Drop them below! 👇
Let's build a community of smart traders who help each other win! 🤝
✨ If you find value in my analysis, a 👍 and 🚀 boost is much appreciated — it helps me share more setups with the community!
#MSTR #Bitcoin #BTC #TradingView #SwingTrading #DayTrading #BearishSetup #ShortSetup #CryptoStocks #TechnicalAnalysis #MovingAverages #LayeredEntry #RiskManagement #ProfitTarget #StrategyInc #MicroStrategy #ThiefMethod #TradingStrategy #StockMarket #NASDAQ
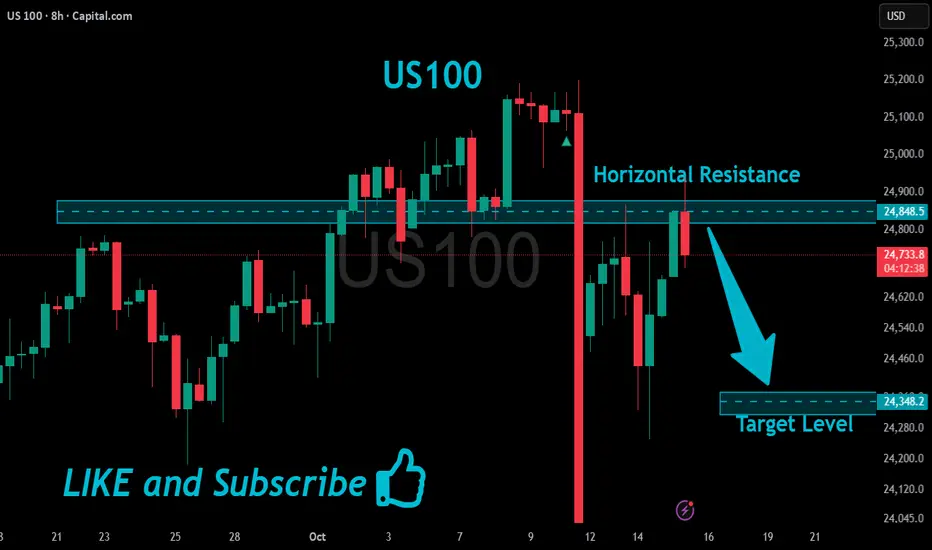
US100 Local Bearish Pullback Expected!
HI,Traders !
#US100 is hit A strong horizontal resistance
Level of 24848.5 after a sharp
Push upwards by the bulls
So a local correction is needed
From the resistance with the
Expected target being the
Local level below at 24348.2 !
Comment and subscribe to help us grow !
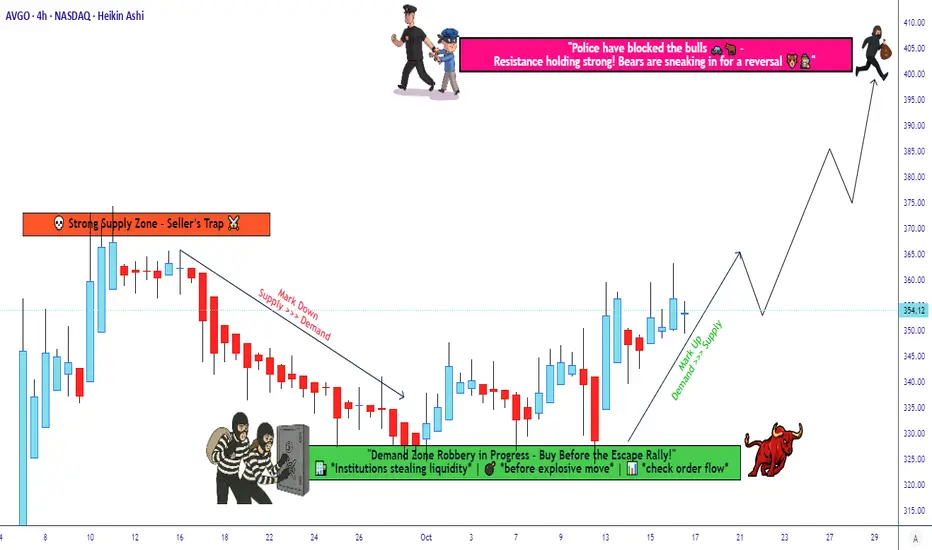
Broadcom Technical Setup - Systematic Entry Approach🎯 AVGO: The Great Heist Setup | Layered Entry Strategy 💰
📊 Asset Overview
Broadcom Inc. (AVGO) - The semiconductor kingpin that's been printing money like a Vegas casino! 🎰
🎭 The Heist Plan: BULLISH Setup
Strategy Style: The "Thief Method" - Layered Limit Orders (Ocean's Eleven style but legal! 😎)
🚪 ENTRY ZONE: The Multi-Layer Approach
This ain't your grandma's single entry point! We're going full stealth mode with multiple limit buy orders spread across the zone like a well-planned heist:
Suggested Entry Layers:
💵 Layer 1: $330
💵 Layer 2: $340
💵 Layer 3: $345
💵 Layer 4: $350
💵 Layer 5: $355
OR feel free to enter at ANY current price level if you're feeling bold! 🎲
Pro Tip: You can add more layers based on your capital and risk appetite. More layers = Better average price = Smoother ride! 🎢
🛑 STOP LOSS: The Emergency Exit
Thief's Escape Hatch: $320
⚠️ RISK DISCLAIMER: Dear Thief OG's (Ladies & Gentlemen of Fortune), this is MY stop loss level for MY strategy. You're the boss of your own money! Set your SL based on YOUR risk tolerance. Make money, take money - at your own risk! 🎲
🎯 TARGET: The Vault Unlocks Here!
POLICE BARRICADE ZONE (Strong Resistance Alert! 🚨): $400
This level is where we expect:
💪 Strong resistance
📈 Overbought conditions brewing
Bull traps potentially forming
Strategy: Escape with your bags of cash before the sirens go off! 🚔💨
⚠️ PROFIT DISCLAIMER: Again, Thief OG's - this is MY target, not financial advice! Take profits whenever YOUR plan says so. Your money, your rules, your responsibility! 💯
🔗 Related Pairs to Watch (Correlation Play)
Keep your eyes on these accomplices in the semiconductor/tech heist:
NASDAQ:NVDA (NVIDIA) - The GPU mastermind, moves often correlate with AVGO
NASDAQ:AMD (Advanced Micro Devices) - Another chip champ in the gang
NYSE:TSM (Taiwan Semiconductor) - The supplier kingpin
NASDAQ:QCOM (Qualcomm) - Wireless chip crew member
NASDAQ:SMH (VanEck Semiconductor ETF) - The whole gang in one basket
Key Correlation: When semiconductor sector heats up, AVGO typically rides the wave. Watch NASDAQ:SMH for sector-wide momentum! 📡
🎪 Why This Setup Works (Technical Edge)
✅ Layered entries reduce timing risk
✅ Multiple support zones below current price
✅ Clear risk/reward structure
✅ Room to run toward resistance at $400
✅ Semiconductor sector showing strength
🎬 Final Words from Your Friendly Neighborhood Thief
This is the "Thief Strategy" - a layered, calculated approach to catching moves in AVGO. It's all about spreading your risk, averaging your entry, and having a clear exit plan whether things go right (🎯 $400) or wrong (🛑 $320).
Remember: The best thieves always have an escape plan! 🏃💨
Trade smart, not hard! And always remember: Past performance doesn't guarantee future results, but a solid plan beats panic every time! 🧠💪
✨ If you find value in my analysis, a 👍 and 🚀 boost is much appreciated — it helps me share more setups with the community!
#AVGO #Broadcom #SwingTrading #DayTrading #TradingStrategy #StockMarket #TechnicalAnalysis #LayeredEntry #ThiefStrategy #Semiconductors #TechStocks #RiskManagement #TradingIdeas #StockTrading #BullishSetup #TradingView #MarketAnalysis #PriceAction #SupportAndResistance
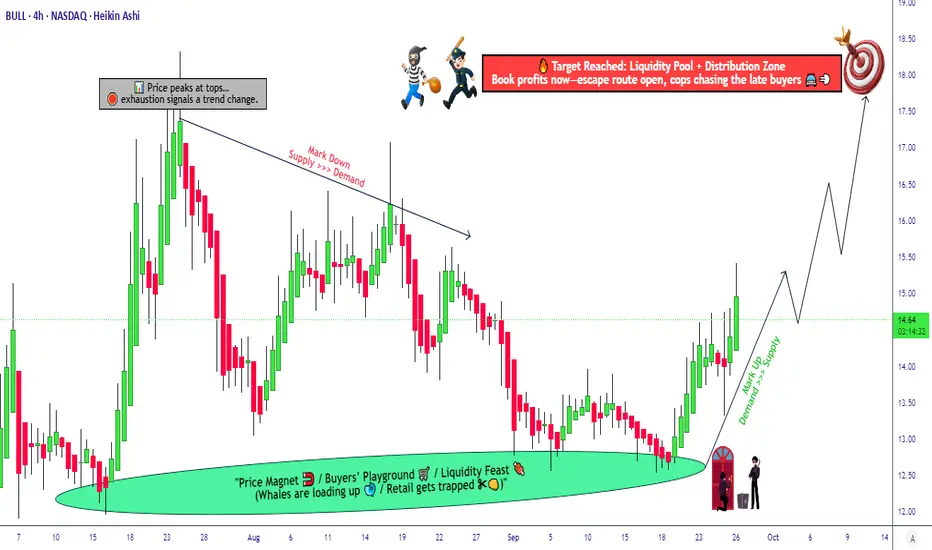
Step-by-Step Strategy Map: BULL Stock Bullish Case Study🚨 Stealing Profits with WEBULL CORPORATION ( NASDAQ:BULL ): The Ultimate Thief Strategy Map 🗺️💰
Asset: WEBULL CORPORATION ( NASDAQ:BULL )
Market: US Stock
MarketStrategy: Swing/Day Trade
Vibe: Bullish 🐂
Buckle up, my fellow Thief OG's 😎! We're about to pull off a heist on NASDAQ:BULL with a slick, layered entry strategy that’s as smooth as a cat burglar in the night. This plan is designed to maximize profits while dodging the police barricades (resistance levels) with style. Let’s break it down with a professional yet fun twist to make this idea pop on TradingView! 🚀
📜 The Heist Plan: Bullish Swing/Day Trade
🎯 Plan: Bullish — we're sneaking into NASDAQ:BULL ’s upward momentum like master thieves!
🔑 Entry Strategy: Thief Layering Strategy 🕵️♂️
Use multiple buy limit orders to layer entries like a pro. Suggested entry points:
$13.00
$13.50
$14.00
$14.50
Pro Tip: Feel free to add more layers based on your risk appetite — scale up or down as you see fit! This flexible approach lets you catch the best price action without chasing the market. 🏃♂️
🛑 Stop Loss: Set a Thief SL at $12.50 to protect your loot.
Note: Dear Ladies & Gentlemen (Thief OG's), this SL is my suggestion, but it’s your heist! Adjust based on your risk tolerance and make those profits at your own discretion. 💼
🎉 Target: Watch out for the police barricade (strong resistance) around $18.00, where overbought conditions and potential traps may lurk. Take profits here or earlier if you spot trouble!
Note: Thief OG's, this is my suggested target, but you’re the boss of your trades. Secure your gains when you feel the heat! 🔥
🔍 Why NASDAQ:BULL ? Key Points & Market Context
📈 Technical Analysis: NASDAQ:BULL is showing bullish momentum with strong volume and price action, making it a prime candidate for swing/day trading. Recent breakouts above key moving averages signal potential upside.
💡 Thief Strategy Edge: The layered entry approach minimizes risk by spreading buy orders across price levels, allowing you to capitalize on pullbacks while avoiding overpaying during spikes.
🚨 Resistance Watch: The $18.00 level is a critical zone due to historical resistance and potential overbought signals (check RSI and volume). Plan your exit carefully to avoid getting caught!
📊 Market Sentiment: Positive sentiment in the fintech sector, driven by increased retail trading activity, supports NASDAQ:BULL ’s upward potential.
👀 Related Pairs to Watch
To maximize your heist, keep an eye on these correlated assets for additional opportunities or confirmation:
NASDAQ:HOOD (Robinhood Markets): Another fintech stock with similar retail trading exposure. If NASDAQ:HOOD is also bullish, it could confirm NASDAQ:BULL ’s momentum. Watch for synchronized breakouts!
NASDAQ:SOFI (SoFi Technologies): A fintech peer with strong correlation to $BULL. Check for parallel price action to validate the bullish setup.
AMEX:SPY (S&P 500 ETF): As a broad market proxy, AMEX:SPY ’s direction can influence $BULL. A bullish AMEX:SPY supports our heist, while a bearish turn signals caution.
Correlation Key: These stocks often move together due to shared exposure to retail investor sentiment and fintech sector trends. If NASDAQ:HOOD or NASDAQ:SOFI lags, it could hint at weakening momentum for $BULL.
🛠️ How to Execute the Thief Strategy
Set Up Layers 🧱: Place buy limit orders at $13.00, $13.50, $14.00, and $14.50 (or customize your levels). This spreads your entry risk and catches dips.
Monitor Momentum 📡: Use indicators like RSI, MACD, or Bollinger Bands to confirm bullish strength. Avoid entering if momentum weakens.
Secure the Loot 💸: Set a stop loss at $12.50 to limit downside. Trail your stop as price climbs to lock in gains.
Escape Plan 🏃♂️: Take profits near $18.00 or earlier if resistance kicks in. Don’t get greedy — the police (market traps) are always watching!
Stay Flexible 🌀: Adjust layers and stops based on real-time price action. This is a dynamic heist, not a one-size-fits-all plan.
⚠️ Disclaimer
This Thief Style Trading Strategy is for entertainment and educational purposes only. Trading involves risks, and you’re responsible for your own decisions. I’m not a financial advisor, just a fellow market bandit sharing ideas for fun! 😜 Always do your own research and trade at your own risk.
✨ “If you find value in my analysis, a 👍 and 🚀 boost is much appreciated — it helps me share more setups with the community!”
#Hashtags:#BULL #WEBULL #SwingTrading #DayTrading #ThiefStrategy #Fintech #StockMarket #Bullish #TradingView #ProfitHeist
Nasdaq100 Breakout Map – Bullish Targets Ahead?🕵️♂️ NDX/US100 “NASDAQ100” Market Wealth Strategy Map (Swing/Day Trade) 🚀
📊 Plan: Bullish Bias (Swing/Day Trade)
🎯 Entry Idea (Thief Layering Style):
Using a layering strategy (multiple limit orders). My preferred buy zones are:
🟢 24,300
🟢 24,400
🟢 24,500
🟢 24,600
(Feel free to adjust/add layers based on your own style — flexibility is key.)
🔒 Protective Stop (Thief SL):
❌ Around 24,000 (but note: this is just my map, you can manage risk as per your own plan).
💰 Target Area (Profit Zone):
🚧 25,500 = strong resistance barricade + overbought region + potential bull trap.
✅ My preferred exit: 25,400 (just before the “police barricade” 🚓).
⚠️ Note for Thief OG’s:
I’m not recommending to only follow my SL/TP. This is an educational trade map, not a fixed financial call. Adapt, adjust, and take profits your way.
🔑 Key Catalysts & Correlation Map:
Tech Sector Strength: US100 often mirrors mega-cap tech momentum ( NASDAQ:AAPL , NASDAQ:MSFT , NASDAQ:NVDA ).
Risk-On/Off Mood: Watch TVC:VIX — if fear spikes, layers may fill quicker.
Dollar Impact: TVC:DXY weakness often fuels NASDAQ:NDX upside.
Bond Yields: Higher yields = pressure on tech. Keep TVC:US10Y in your radar.
📌 Other Related Charts to Watch:
SP:SPX / CME_MINI:ES1! → Correlated US equity benchmark.
TVC:DXY → Inverse correlation (watch dollar moves).
TVC:VIX → Volatility indicator for risk sentiment.
BITSTAMP:BTCUSD → Risk sentiment cousin, moves with tech flows sometimes.
✨ “If you find value in my analysis, a 👍 and 🚀 boost is much appreciated — it helps me share more setups with the community!”
⚠️ Disclaimer:
This is a Thief Style Trading Strategy Map — created for fun, educational purposes, and market observation only. Not financial advice. Trade at your own risk, ladies & gentlemen. 🕵️♂️💸
#NASDAQ100 #NDX #US100 #SPX #Stocks #Indices #Trading #SwingTrade #DayTrade #LayeringStrategy #ThiefTrader

NASDAQ 100 ShortRetracement function on the daily chart...
Price has filled the inefficiency on the daily chart here on NQ and formed a Reversal on all 3 correlated assets alongside Dow Jones 30 and S&P500
Anticipating price to drop down to the lows outlined before the end of next week 24 Oct 25', option puts??
Daily chart projection, nothing more than that, lower timeframes are subject to fluctuations that we may not be able to update quickly enough, so yeah.
I use the VANTAGE:NAS100FT by Vantage
GLGT

iShares Semiconductor ETF Eyes Bullish Continuation🚀 SOXX Breakout Play — Swing/Day Trade Setup 🎯
Asset: SOXX – iShares Semiconductor ETF
Playbook Type: Fund ETF Market Profit Playbook
Plan: 🔥 Bullish Plan (Swing/Day Trade Setup)
⚡️ Entry Plan
Looking for long entries after a confirmed breakout above $292.50.
Once this resistance gives way, momentum traders may pile in — that’s where our profit zone starts heating up! ⚙️
🛡️ Stop-Loss (Risk Control)
Stop Loss: $277.50 — a.k.a. The Thief SL.
Dear Ladies & Gentlemen (Thief OG’s) 👑 — I’m not recommending you to use only my SL. It’s your call, your risk, your money. Manage like a boss. 💼
💰 Profit Target
Target: $308.00 — this level sits near a strong resistance zone where the market might turn overbought or trap late buyers.
Be smart. Escape with profits before the herd does. 😎
Again, Thief OG’s — my TP is just my view. You decide when to take your money and run. 💸
🔗 Correlated Assets to Watch
Keep your eyes on these key players — they often front-run SOXX moves or confirm direction:
SMH (VanEck Semiconductor ETF) → Often mirrors SOXX behavior.
NASDAQ:SOX (Philadelphia Semiconductor Index) → Sector index — leads ETF flow.
NVDA / AMD / TSM → Chip giants that heavily influence ETF weight.
QQQ → Tech sentiment gauge; if NASDAQ rallies, SOXX gets wings.
💡 Tip: When NVDA and SMH break resistance together, SOXX rarely stays quiet — momentum usually follows fast.
⚠️ Key Watchpoints
Always confirm breakout volume before entry.
Keep an eye on macro headlines — rate decisions, chip demand, or supply chain data can shift the tone fast.
Protect profits once RSI hits overheated zones near the upper channel.
🧠 Thief Trader Mindset
This setup isn’t about guessing — it’s about waiting for confirmation, reacting fast, and locking profits like a pro thief in daylight. 🕶️
✨ “If you find value in my analysis, a 👍 and 🚀 boost is much appreciated — it helps me share more setups with the community!”
Disclaimer: This is a thief-style trading strategy just for fun. Always trade responsibly and at your own risk.
#SOXX #Semiconductors #ETF #BreakoutTrade #SwingTrade #DayTrade #TechSector #TradingView #TradeIdea #ThiefTrader #RiskManagement #MarketPlaybook

rYojbaba Co., Ltd. (RYOJ) Is Gearing For A 200% Breakout rYojbaba Co., Ltd. (RYOJ) stock is gearing for a breakout from a bullish symmetrical triangle. While already up 119% in premarket trading, the asset is poised to claim the $5 resistance.
With just 2 months since IPO, the stock seems to break key resistance every month achieving impossible stints.
Next earnings date is slated for November 20th, 2025.
About RYOJ
rYojbaba Co., Ltd. provides consulting and health services to various customers in Japan. It operates through two segments, Consulting Services and Health Services. The Consulting Services segment offers labor and corporate consulting services to labor unions, companies to support the practice of whistleblowing and stress checks, and companies and labor unions to resolve disputes.

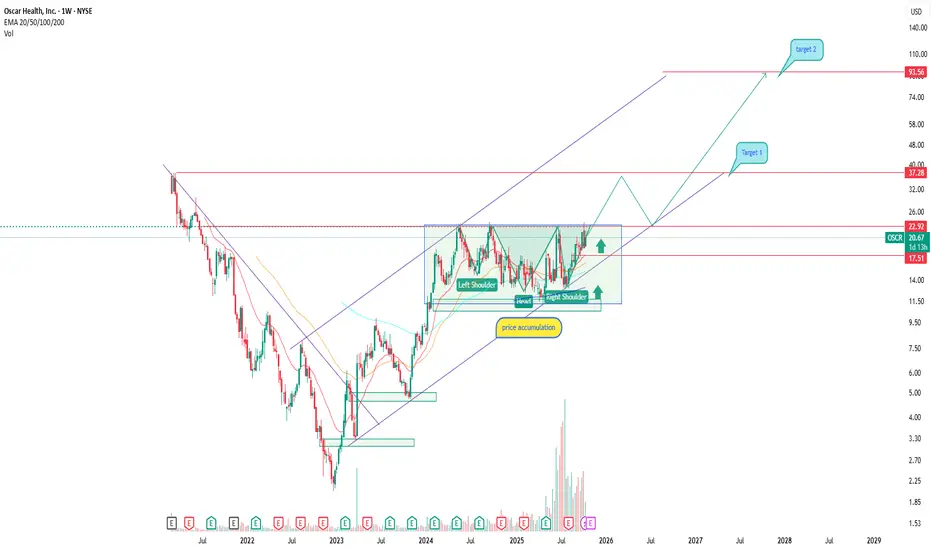
OSCR breakout from accumulation and start of a new trendOscar Health (NYSE: OSCR) is emerging as one of the more interesting names in the U.S. healthcare insurance sector. After an extended accumulation phase, the stock has broken out and is now trading above its major EMAs (50/100/200), confirming a structural shift toward a bullish trend.
The pattern resembles an inverse head and shoulders, with the 17.50–20.00 area acting as strong base support. A confirmed breakout above this zone sets the stage for a move toward 37.78 (Target 1) and potentially 93.55 (Target 2) — the upper boundary of the mid-term ascending channel.
Fundamentally, The company continues to grow its customer base and improve margins after strategic restructuring. Its shift toward tech-driven insurance solutions and partnerships with major healthcare providers strengthen its position. Recent earnings reports show narrowing losses and revenue stabilization — a sign of operational progress.
This looks like the early stage of a longer recovery cycle: the market is moving out of accumulation, but confirmation above 20.00–25.00 is crucial. As always — stay disciplined and trade by structure, not emotion.
NAS100 Forecast: A Fresh Bullish Impulse Toward New HighsThe NAS100 index is currently moving within a classic Elliott Wave structure. After completing wave (3), the market entered a correction phase that formed wave (4). This correction appears to have ended in the highlighted support zone, where buyers stepped in strongly. The five-wave pattern before wave (4) confirms a solid bullish trend. Now, the index seems to be preparing for the final upward move wave (5). This wave often represents the last push of a rally before a larger correction starts. As long as the price stays above the recent support near 24,400 , the next targets could be seen around 25,200–25,600 . In simple terms, the market is expected to continue its uptrend after a short pullback, following the typical Elliott Wave sequence of five upward waves and three corrective ones.

Powell Signals the End of QT — Relief Rally or the Calm Before?First, let’s look at the key points from Powell’s remarks at the 67th Annual Meeting of the National Association for Business Economics (NABE):
* The future path of monetary policy will depend on the assessment of data and risks.
* The balance sheet remains a vital tool of monetary policy.
* Fed officials will discuss the composition of the balance sheet.
* Balance sheet reduction (QT) could come to an end in the coming months.
* Inflation remains on an upward trajectory.
* The labor market shows signs of notable downside risks.
From this set of statements, my conclusion is that if the Fed and Powell start speaking more decisively about ending QT and halting balance sheet reduction, it would be highly significant.
It would indicate that the Fed is becoming increasingly concerned about the future of the labor market — and likely signals more aggressive and deeper rate cuts ahead.
Halting the balance sheet reduction while simultaneously cutting rates could provide some support to the U.S. economy and ease pressure on equities and financial markets.
However, if QT is paused but unemployment continues to rise, we should expect a sharp downturn in financial and equity markets.
Overall, given Powell’s dovish tone, my trading bias remains bearish, unless a strong technical reversal emerges.
That said, the U.S.–China trade tensions currently carry even greater importance in shaping market direction.

Can NASDAQ100’s Retest Turn Into a Full-Fledged Rally?⚡ NASDAQ100 — “The Wall Street Engine” Trade Opportunity Guide (Swing / Day Trade)
Plan:
📈 Bullish confirmation awaited at the Hull Moving Average retest.
When price respects that dynamic zone and momentum aligns, the Thief layers up — ready to stack positions like a pro!
💰 Thief Strategy Playbook:
Thief’s weapon? Layering entries — the art of scaling in like a patient hunter.
Multiple buy limit orders are placed around:
🔹 24,400 🔹 24,500 🔹 24,600
(You can adjust or add more layers based on your own trading structure and capital.)
🛡️ Stop-Loss:
This is the Thief’s SL → @24,200
🕵️♂️ Note to all Thief OGs:
I’m not recommending that you copy my SL — risk management is your call.
Remember: Make money, then take money at your own risk.
🎯 Target Zone:
@25,300 — where the POLICE BARRICADE (resistance) stands tall!
⚠️ The zone aligns with overbought levels + liquidity trap potential, so don’t overstay your welcome.
Escape with profits like a smart thief before the market cuffs you! 💨
🕵️♂️ Note again to Thief OGs:
Targets are flexible — adapt based on your execution and structure confirmation.
🔍 Correlated Assets to Watch:
SP:SPX (S&P500) — often mirrors NASDAQ’s overall direction.
TVC:DJI (Dow Jones) — gives early risk-on/risk-off sentiment clues.
TVC:US10Y (US Treasury Yield) — rising yields can pressure tech stocks.
TVC:VIX (Volatility Index) — watch for volatility spikes; they often precede reversals.
Correlation Key Insight:
When the dollar weakens and yields cool, NASDAQ tends to fly 🚀 — liquidity rotation favors growth stocks and tech-heavy indices.
⚙️ Quick Recap:
✅ Bias: Bullish (with retest confirmation at Hull MA)
💸 Entry Zone: 24,400 → 24,600 (Layered limits)
🧱 SL: 24,200 (risk-controlled zone)
🎯 TP: 25,300 (liquidity + resistance zone)
⚠️ Risk: Adjust position size and trail stops as structure evolves
✨ “If you find value in my analysis, a 👍 and 🚀 boost is much appreciated — it helps me share more setups with the community!”
📜 Disclaimer:
This is a Thief-style trading strategy — designed for entertainment, education, and market storytelling. Trade responsibly; it’s just for fun, not financial advice.
#NASDAQ100 #US100 #IndexTrading #HullMA #PriceAction #MarketStructure #SwingTrade #DayTrade #TechnicalAnalysis #SmartMoneyConcepts #TradingCommunity #ThiefTrader #ChartArt #EditorPickCandidate

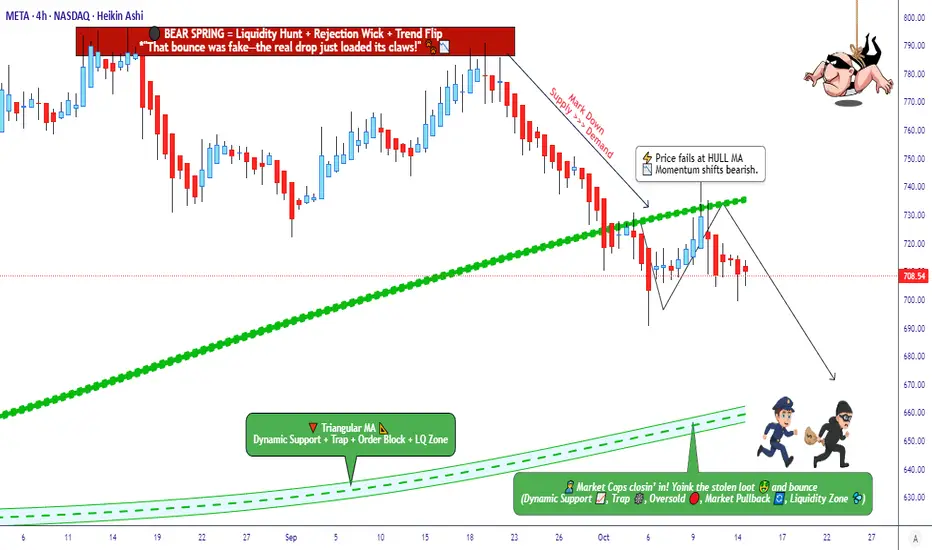
META Platforms Chart – Technical Reversal Signals Sell Momentum🎯 META's Bearish Heist: Time to Rob the Bears' Bank! 💰
📊 Asset Overview
META PLATFORMS, INC - The social media giant is about to get socially distanced from higher prices!
🔍 Market Analysis
Current Setup: Bearish Momentum Confirmed ⚠️
The Hull Moving Average just broke down like my New Year's resolutions! 🐻 Bears have grabbed the steering wheel and they're driving this bus downhill. The technical setup is screaming "SHORT" louder than your stop loss alerts at 3 AM.
🎭 The "Thief Strategy" Game Plan
🎯 Entry Strategy: Layer Like a Pro
The Layered Limit Order Approach (because catching falling knives is for amateurs!)
Layer 1: $740 🎯
Layer 2: $730 🎯
Layer 3: $720 🎯
Layer 4: $710 🎯
You can add more layers based on your risk appetite and portfolio size. Think of it as building a profit sandwich - the more layers, the tastier! 🥪
Alternative: Direct market entry at current price levels (for the adrenaline junkies among us)
🛡️ Risk Management
🚨 Stop Loss: $760
⚠️ IMPORTANT NOTE: Dear Thief OG's (Ladies & Gentlemen),
This is MY stop loss level based on my risk tolerance. This is NOT a recommendation - you MUST set your own stop loss based on YOUR risk management rules. Trade at your own risk, secure your own bag! 💼
🎯 Profit Target
💎 Target: $660
Why $660?
✅ Triangular Moving Average acting as Fort Knox-level support
✅ Oversold conditions brewing like a perfect storm
✅ Bull trap zone where buyers might step in
✅ Technical barricade stronger than a police checkpoint 🚓
⚠️ IMPORTANT NOTE: Dear Thief OG's,
This is MY take profit level. You can exit whenever you want - secure those gains at YOUR comfort zone. Take profits when you're happy, not when I tell you! Your money, your rules. 💵
📈 Related Pairs to Watch
Keep your eyes on these correlated assets:
🔗 NASDAQ:GOOGL - Fellow tech giant showing similar bearish pressure
🔗 NASDAQ:AAPL - Tech sector leader; weakness here confirms broader tech selloff
🔗 NASDAQ:MSFT - Big tech correlation play
🔗 NASDAQ:AMZN - FAANG/Magnificent 7 correlation
🔗 NASDAQ:QQQ - Nasdaq ETF; META's moves often mirror tech sector sentiment
Key Correlation: When META sneezes, social media stocks catch a cold! Watch NYSE:SNAP and NYSE:PINS for sympathy plays.
🎪 The Thief Style Philosophy
This isn't your grandpa's trading strategy - we're playing chess while others play checkers! ♟️ The "Thief" approach uses strategic layering to maximize entry opportunities while managing risk like a boss.
Remember: We're not thieves in the literal sense - we're just stealing profits from the market inefficiencies! 😎
📊 Technical Summary
✅ Hull MA Breakdown Confirmed
✅ Bearish Momentum Building
✅ Multiple Technical Resistance Overhead
✅ Risk-Reward Ratio Favoring Shorts
✨ If you find value in my analysis, a 👍 and 🚀 boost is much appreciated — it helps me share more setups with the community!
#META #MetaPlatforms #StockMarket #SwingTrading #DayTrading #TechnicalAnalysis #BearishSetup #ShortSetup #HullMovingAverage #ThiefStrategy #LayeredEntry #RiskManagement #TradingStrategy #StockTrading #MarketAnalysis #TradingIdeas #TradingView #FAANG #TechStocks #BearishMomentum
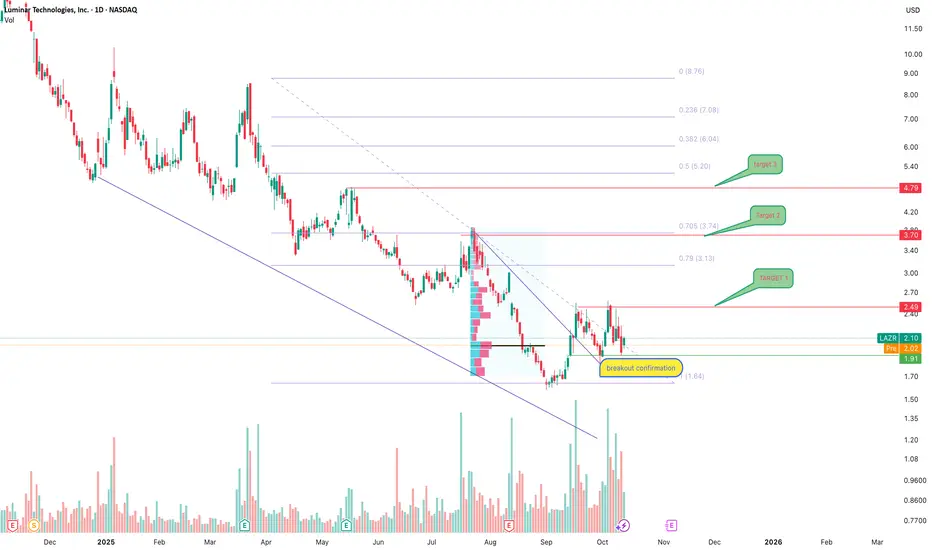
LAZR trend breakout and early recovery phaseLuminar Technologies (NASDAQ: LAZR) is showing the first signs of trend reversal after a prolonged decline. On the daily chart, the price broke the descending trendline and confirmed a breakout around the 1.90–2.00 zone, where accumulation started.
Technically, the 2.00–2.10 area acts as base support.
As long as the price stays above this level, the upside targets are 2.49 (TP1), 3.70 (TP2), and 4.79 (TP3) — all aligned with key Fibonacci levels. Rising volume supports the bullish bias.
From a fundamental perspective, Luminar remains a major player in the lidar industry, with partnerships including Volvo and Mercedes-Benz. Despite short-term pressure from higher rates, operational improvements and scaling could strengthen margins in the medium term.
This setup looks like an early recovery stage — the sentiment shifts slowly, but sustained support above 2.00 is the confirmation needed. Emotions aside — we wait for structure and confirmation.
SMH ETF Power Move Incoming – ATR Confirms Bullish Momentum!🎯 SMH Semiconductor Heist: Bulls Loading Up! 💎🚀
📊 Asset Analysis
VanEck Semiconductor ETF (SMH) - The chip sector's flagship ETF is showing serious strength after bouncing off the ATR (Average True Range) support zone. Bulls are flexing their muscles, and momentum is building for an upside breakout. Time to plan your entry like a pro! 🧠💰
🔥 Trade Setup: The "Layered Thief" Entry Strategy
Bias: BULLISH 🐂
Strategy: Multi-layered limit order entries (maximize your position while managing risk)
🎯 Entry Zones (Layer Your Orders):
Deploy multiple buy limit orders across these price levels to build your position strategically:
Layer 1: $328
Layer 2: $332
Layer 3: $336
Layer 4: $340
Note: You can add more layers based on your capital allocation and risk tolerance. The goal is to average into the position as price consolidates before the breakout.
🛑 Risk Management
Stop Loss: $324
This level invalidates the bullish setup if breached. The ATR support zone should hold — if it doesn't, we're outta here!
⚠️ Risk Disclosure: This stop loss level is based on my analysis. However, YOU are the captain of your own ship! Adjust your risk parameters according to your account size and risk appetite. Trade smart, not reckless! 🧠
🎯 Target Zones
Primary Target: $364 (Take Profits Here!) 💰
Maximum Target: $368 (Resistance Zone/Overbought Alert) ⚠️
At $368, we're approaching a major resistance level where profit-taking, overbought conditions, and potential bull traps converge. It's the "police barricade" 🚨 — smart thieves know when to escape with the loot! Secure your gains before hitting this ceiling.
⚠️ Profit-Taking Disclosure: These are MY target levels based on technical analysis. Your profit targets should align with YOUR trading plan and risk-reward preferences. Take money when YOU feel comfortable — it's your capital, your rules! 💼
🔗 Correlated Assets to Watch
Keep an eye on these related tickers for confirmation and broader market context:
NASDAQ:SOXX - iShares Semiconductor ETF (direct sector peer)
NASDAQ:NVDA - NVIDIA (semiconductor heavyweight, major SMH component)
NASDAQ:AMD - Advanced Micro Devices (chip sector bellwether)
NYSE:TSM - Taiwan Semiconductor (global chip manufacturing leader)
NASDAQ:AVGO - Broadcom (diversified semiconductor play)
NASDAQ:QQQM / QQQ - Nasdaq 100 ETFs (tech sector correlation)
📈 Why it matters: SMH trades in sync with these assets. If they're showing strength, it confirms the bullish thesis. If they're weak, proceed with extra caution!
📈 Technical Confluence
✅ ATR support zone holding strong
✅ Bulls regaining control after retracement
✅ Volume accumulation at support levels
✅ Risk-reward ratio favors the bulls (SL: $324 → Target: $364 = solid R:R)
The technical stars are aligning for a bullish continuation move! 🌟
🎓 Trading Wisdom
This setup combines patience (layered entries), discipline (defined stop loss), and realistic expectations (conservative profit targets). The semiconductor sector is volatile but rewarding when you trade with a plan! 💼📊
✨ If you find value in my analysis, a 👍 and 🚀 boost is much appreciated — it helps me share more setups with the community!
⚠️ Disclaimer
This analysis represents the "Thief Style Trading Strategy" — a playful approach to technical analysis meant for educational and entertainment purposes only. This is NOT financial advice. Trading involves substantial risk of loss. Always conduct your own research, manage your risk appropriately, and never trade with money you can't afford to lose. Past performance does not guarantee future results. Trade at your own risk! 🎲
#SMH #Semiconductors #SwingTrading #DayTrading #TechnicalAnalysis #NVDA #AMD #ChipStocks #TradingSetup #StockMarket #BullishSetup #LayeredEntry #RiskManagement #TradingStrategy #VanEckETF #TechStocks #MarketAnalysis #TradingIdeas #PriceAction

NASDAQ NAS100 Trade Plan: VWAP & Volume Profile StrategyI’m currently watching the NASDAQ #100 (#NDX) 📊. After a strong correction due to geopolitical turmoil 🌍, the market rebounded just as aggressively. Right now, price is trading above VWAP 📈. If it stays above VWAP, I’ll be looking for a long opportunity.
In the video, we zoom into a 30-minute timeframe ⏱️, using VWAP and Volume Profile to plan the trade. If price respects these levels, we can take a long. If it falls below the support level ❌, we abandon this idea.
⚠️ Disclaimer: This is for educational purposes only and not financial advice.

Nasdaq - Clearly heading to $30.000!🎉Nasdaq ( TVC:NDQ ) points much higher:
🔎Analysis summary:
Yes, we witnessed a short term correction over the past couple of days. But no, this does not mean that the bullrun is now entirely over. In fact, looking at the longer term rising channel pattern, the Nasdaq can still rally higher until it will retest the upper trendline.
📝Levels to watch:
$25.000, $30.000
SwingTraderPhil
SwingTrading.Simplified. | Investing.Simplified. | #LONGTERMVISION
