GOLD | Pullback in the making? Watching the FVG and demand zoneGold continues to trade inside a well-defined bullish channel on the daily chart, but the last vertical expansion has created vulnerability to deeper pullbacks. The strong impulse followed by rejection signals profit-taking and a potential transition from momentum phase to corrective phase.
In the short term, price may complete a technical bounce toward the midline of the channel, before potentially rotating lower into the Fair Value Gap around 4.240–4.260. A breakdown below this area would open room toward lower demand zones, aligned with previous institutional order flow still unmitigated.
RSI has exited overbought territory, indicating waning momentum and consistent with a trend-normalization phase.
Positioning:
The COT report shows Non-Commercials increasing long exposure, supporting a medium-term structural bullish bias. However, the simultaneous expansion of shorts highlights growing hedging activity and the potential for corrective volatility.
Seasonality for January historically shows positive average performance, but often after interim drawdowns — reinforcing the idea of a technical pullback before any renewed extension higher.
Retail sentiment remains predominantly long. Typically, when most traders are positioned in the same direction, the probability of contrarian moves increases, adding weight to the short-term downside scenario.
Trading bias:
Medium-term bullish, but preference remains for entries on deeper pullbacks into value areas rather than chasing late breakouts.
Key levels:
• 4.560 — upper channel resistance
• 4.260 — FVG and first liquidity zone
• 4.170-4.200 — intermediate demand
• 4.000-4.070 — primary strategic demand zone
Plan:
Wait for a retracement into marked zones and look for clear accumulation patterns and bullish re-engulfing confirmations before considering new long positions.
Opec

NZD/USD Daily: Corrective Bounce Toward Key SupplyBase bias: short-term corrective upside → potential sell zone higher.
Macro context: the USD remains supported by institutional positioning and a resilient US macro backdrop, while NZD continues to look vulnerable.
1️⃣ Technical Structure (Daily)
Price reacted strongly from the daily demand area (blue zone) after filling part of the prior impulse. A higher low has formed and price is currently trading inside/around a fair value gap (FVG) aligned with the ascending trendline.
A continuation toward the 0.5840–0.5880 supply zone remains possible.
As long as price holds above 0.5720–0.5740, the corrective recovery remains intact; a breakdown below that area increases the probability of a move back toward prior lows.
RSI is recovering from weakness, consistent with a corrective bounce rather than a confirmed structural reversal.
2️⃣ COT (Commitments of Traders)
USD Index: non-commercials remain broadly positioned pro-USD / short NZD. Recent flows show renewed support for the dollar.
NZD Futures: non-commercials remain significantly net short. The recent uptick in longs is marginal compared with the broader bearish imbalance.
Overall, institutional positioning continues to suggest medium-term downside pressure on NZD. Rallies into key supply zones are more likely to be sell opportunities.
3️⃣ Retail Sentiment
Retail traders are ~64% long NZD/USD. Historically, persistent retail long skew often precedes contrarian downside moves.
4️⃣ Seasonality
January has historically been weak to neutral-weak for NZD/USD, with average returns below other months and wide variability.
Seasonality does not support a sustained bullish trend and aligns more with a temporary bounce followed by renewed selling pressure.

GBPUSD – Daily Bullish Channel While Specs Stay ShortOn the daily chart GBPUSD is still respecting a clear bullish channel from the November lows. Price just reacted from a previous imbalance / FVG around 1.34 and is consolidating inside a broader supply zone, but structure remains constructive as long as we hold the mid–lower part of the channel.
1. Daily structure
After the October–November selloff, GBPUSD has been making higher highs and higher lows inside an ascending channel. Current price is trading around the mid-range of that channel, with a small pullback into the daily FVG / demand around 1.3360–1.3430. As long as daily closes hold above this block and the lower trendline, the path of least resistance remains to the upside, with room into the higher supply layers between 1.3550–1.3600 and above.
2. COT data (GBP & USD Index)
GBP futures: non-commercials are still net short, but they have started to cover shorts (short positions decreasing while longs tick higher). This suggests the pain trade is still to the upside if price continues to grind higher. Commercials are net long GBP, which fits with accumulation into prior lows. USD Index futures: specs are slightly net short USD, which reinforces a softer-USD backdrop and supports a bullish bias on GBPUSD as long as risk sentiment does not deteriorate sharply.
3. Seasonality
Seasonality on GBPUSD shows that recent years (5–10Y and especially 2Y) tend to favour mild GBP strength into late December / early January, while the very long-term average is more neutral. I interpret this as a supportive, but not decisive, tailwind: seasonality aligns with the current bullish structure but is not a stand-alone signal.
4. Sentiment
Retail traders are slightly net short into a rising market – a contrarian bullish signal, but not yet at an extreme. This fits with the idea of buying dips while the crowd tries to fade the trend.

EURUSD: Extended rally into daily supplyOver the past few weeks, EURUSD has continued to extend higher, pushing deep into a daily supply zone that overlaps with a previous distribution area. The ascending channel is still intact, but I’m starting to see some loss of momentum and the first signs of selling pressure within the 1.1780–1.1850 range.
On the daily chart, price has left a potential imbalance open, with a more interesting demand structure sitting between 1.1700 and 1.1650. If recent lows are taken out, I would expect price to rotate back into that zone to fill liquidity and test buyer strength. Only a clean break and hold above 1.1850 would invalidate the corrective scenario and reopen the path toward higher highs.
The COT data shows:
Non-commercials remain net long on the euro, but positioning is not increasing as aggressively as in previous months.
On the Dollar Index, non-commercials still hold a meaningful short exposure, but they’ve been gradually reducing it.
In my view, this suggests a market that may have already priced in much of the pro-euro bias, creating room for a short-term technical reset.
Seasonality
Historically, December tends to be positive for EURUSD, but the final part of the month often brings volatility and rebalancing flows — consistent with the idea of a pullback before any renewed extension.
Retail sentiment
Current sentiment shows roughly 81% of retail traders short.
Typically, that’s a contrarian bullish signal. However, given that we’re trading inside supply and the structure is stretched, I interpret it as the uptrend is still alive, but the risk of a corrective phase is increasing.
Invalidation
This corrective view is invalidated with daily closes above 1.1850 and strong continuation inside the channel.

EURCAD: Pullback First, Then Potential BreakdownSeasonality shows that EUR tends to be moderately bullish in December, especially when looking at 5–10 year horizons, while CAD typically experiences mild weakness during the same period and historically regains strength between January and February. In the short term, this means seasonality favors EUR over CAD, but as we move into the new year the balance shifts toward CAD appreciation. This creates a favorable environment for waiting on technical pullbacks first and then looking for selling opportunities at higher levels.
Retail sentiment currently shows roughly 54% short positions versus 46% long, indicating that positioning is not extreme, yet traders are slightly biased to the short side. Historically, when retail is predominantly short, price tends to remain supported for a while before eventually reversing. As a result, there may still be room for bullish retracements in the very short term, although this does not change the broader bearish context.
From a COT perspective, speculators appear to be covering CAD short exposure, which is supportive for CAD in the medium term, while EUR is attracting additional long interest but not at extreme levels. Overall, this suggests that upside in EURCAD is likely limited and the risk of a medium-term reversal remains elevated.
Technically, price is trading within a descending channel that has been respected multiple times and is currently testing a demand zone, which may generate a short-term reaction. RSI has not yet completed a full bullish divergence, indicating that one more bounce remains possible, while the daily structure continues to print lower highs and lower lows. A potential rebound toward the 1.6120–1.6150 area, where former support may now act as supply, would allow the market to retest structure before resuming the dominant downtrend.

USD/CAD at a Turning Point: Smart Money vs Retail CrowdTechnical Context (Macro View)
USD/CAD has completed a distribution phase following the rally of recent months and is now rotating decisively back into a broad daily demand area between 1.3650 and 1.3550, a zone that has historically generated strong directional reactions. Short-term structure remains bearish, but price is now trading within a potential absorption area, with RSI compressed in the lower range, consistent with bearish momentum exhaustion. From a structural standpoint, this is not an environment to chase extended shorts, but rather to monitor for technical long reactions from high-value support.
COT Report (Commitments of Traders)
USD Index: Non-Commercials are net short, accompanied by a significant contraction in overall open interest, signaling a loss of structural strength in the US dollar following the previous bullish excess.
Canadian Dollar (CAD): Non-Commercials are heavily net short CAD, while Commercials continue to absorb, a classic setup often preceding a potential inversion or corrective rebound in CAD.
Retail Sentiment
79% of retail traders are long USD/CAD, while only 21% are short. This highlights a strong retail exposure positioned against the recent bearish move. However, context is key: sentiment is already at extreme levels, but price is now sitting at an institutional support area, increasing the probability of a short squeeze or technical rebound rather than an immediate continuation of downside extension.
Seasonality
Historical seasonality for USD/CAD shows that late December to early January often favors consolidation phases or rebounds. Data over 5, 10, and 20 years indicate a bearish pressure that progressively loses strength, with frequent mean-reversion dynamics.
Seasonal Conclusion: current timing aligns with a potential rebound or pause in the bearish trend, rather than the start of a fresh downside acceleration.

EURJPY: Bullish Trend Under Pressure | COT & SeasonalityEURJPY remains in a well-defined medium-term bullish trend on the daily timeframe, characterized by a clear sequence of higher highs and higher lows within an ascending channel. The latest impulse pushed price above the upper boundary of the channel, an area where historically the market tends to lose momentum and attract profit-taking. Recent candles confirm this behavior, showing fading momentum and early corrective closes, consistent with a consolidation or technical pullback phase rather than trend exhaustion.
From a technical perspective, the 181.00–180.00 area stands out as a key zone of interest. This region aligns with a daily fair value gap, a prior consolidation base, and the dynamic support of the ascending channel. As long as price holds above this zone, the broader bullish structure remains intact. Any retracement into this area should be interpreted as corrective price action within the trend, not as a reversal. Only a clear and sustained break below 179.80 would open the door to a deeper correction toward the lower demand zone.
The COT report reinforces the idea of slowing upside momentum. On the JPY side, non-commercial traders continue to increase short positions, indicating persistent bearish expectations on the yen. However, the sharp rise in open interest suggests a mature trend environment, where the risk of corrective squeezes increases. On the EUR side, commercials remain heavily net short, a typical hedging behavior when prices trade at elevated levels. This divergence points to limited short-term upside potential for EURJPY.
Seasonality adds further context. December is historically supportive for the euro, while the Japanese yen tends to strengthen toward year-end. This mixed seasonal backdrop favors a phase of unstable equilibrium, with higher probability of consolidation or corrective moves rather than aggressive bullish continuation.
Looking at FX sentiment, retail positioning is heavily skewed to the short side on EURJPY. While this contrarian signal has supported the bullish trend in previous phases, near technical extremes such imbalance loses directional strength and increases the likelihood of orderly pullbacks before any potential trend resumption.
Operational conclusion: the broader bias remains bullish, but in the short term a corrective or consolidation phase is more likely. The 181.00–180.00 zone is the key area to monitor for potential bullish reactions aligned with the primary trend. Caution is warranted near highs, with greater focus on confirmed price action signals at value areas.

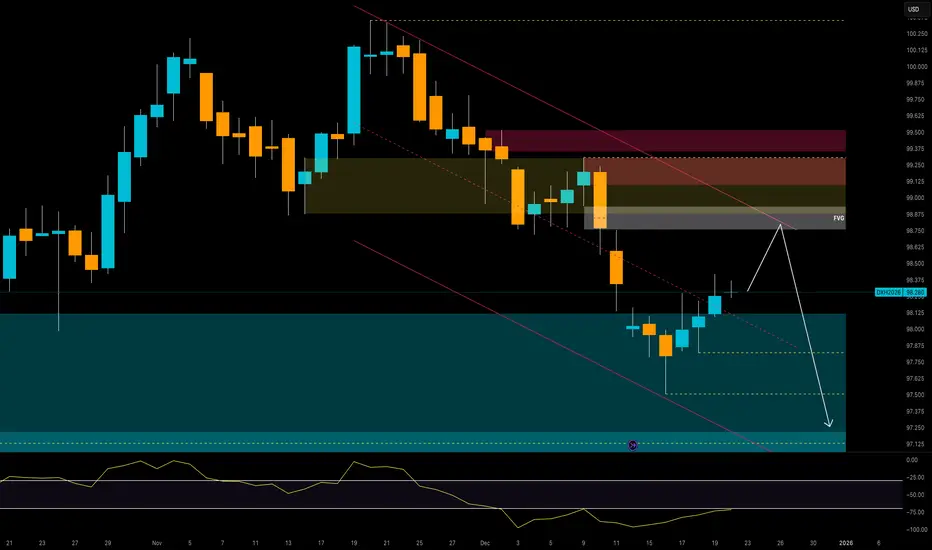
US Dollar Index – Temporary Relief Before Further Downside?The US Dollar Index continues to trade under structural pressure on the daily chart, following the strong downside impulse that broke November’s value area and pushed price into a key weekly demand zone around 97.90–97.30. After a clear momentum swing lower, the index is now showing early signs of corrective strength, but the broader context continues to favor weakness into year-end.
On the technical side, price has reacted from support and is attempting a corrective retracement toward the 98.75–99.00 supply zone. This zone aligns with:
– Daily bearish trendline resistance
– A fresh Fair Value Gap (FVG)
– Previous structure imbalance
If price completes this pullback, the zone provides a high-probability region for bearish continuation targeting new lows into 97.50–97.20. The RSI remains below the midline, indicating momentum has not fully shifted to the upside and that current strength is corrective, not impulsive.
Seasonality reinforces this bearish narrative. December historically records negative averages in the Dollar Index across virtually every timeframe. The 20-year average in particular shows strong downward pressure late in the month, with typical weakness accelerating into year-end. Current price action is consistent with this seasonal pattern.
From a positioning standpoint, the latest COT report shows Non-Commercial traders significantly net short, with shorts sitting at 28,652 vs. longs at 14,778. This imbalance continues to reflect confidence in downside continuation. At the same time, the Commercial category reduced long exposure and increased shorts, adding further weight to bearish bias. The aggregate positioning structure is clearly aligned with the existing downtrend.
Overall, the Dollar Index remains structurally bearish. A final upside correction into the 98.75–99.00 supply zone could precede the next leg lower. Only a clean break and close above 99.20 would weaken the bear case and signal a potential shift in directional bias. Until then, rallies remain sell-side opportunities.
EUR/AUD: Is This Daily Rejection the Start of a Breakdown?1. COT Positioning
The latest COT data reflects a clear divergence between EUR and AUD positioning:
• EUR futures (Non-Commercial) continue to show strong net-long positioning, with +5,367 new long contracts added and the long/short ratio holding firm. This supports medium-term EUR strength.
• AUD futures (Non-Commercial) show an opposite movement, with +6,517 new short contracts added and a further reduction in speculative long exposure. This reinforces AUD weakness.
From a COT perspective, the gap between EUR strength and AUD weakness remains wide. This does not immediately justify a deeper EURAUD downside move unless commercial positioning begins to shift. However, extended net-long imbalances can sometimes precede corrective phases, meaning current EUR strength may be late-cycle rather than early-stage accumulation.
2. Seasonal Tendencies
December seasonality is notably skewed:
• The EUR historically performs well in December across all major lookback periods (20Y, 15Y, 10Y, 5Y, 2Y), creating a supportive seasonal tailwind.
• The AUD shows mixed to mildly positive seasonal behaviour at shorter timeframes, but lags the EUR significantly over the 10-year dataset.
Overall, seasonality favours EUR strength against AUD into year-end, adding a bullish seasonal bias to EURAUD.
3. Sentiment
Retail sentiment on EURAUD currently shows:
• 68% short
• 32% long
Such an imbalance typically acts as a contrarian bullish signal. As long as retail traders remain heavily short, upward pressure on EURAUD is likely to persist.
4. Daily Chart Structure
Price is currently rejecting a major daily supply zone after a sustained three-week upside rotation. The rejection aligns with key technical factors:
• descending trendline resistance
• previous distribution area
• RSI rejection from mid-range
Key levels:
• Daily supply: 1.7806 – 1.7921
• First downside target: 1.7558 demand
• Secondary liquidity zone: 1.7500 – 1.7440
The recent bearish move off supply suggests the start of a potential corrective phase. However, the higher timeframe structure remains bullish, and this decline may represent a pullback rather than a full structural reversal.
Macro factors (COT + seasonality + sentiment) lean bullish, which conflicts with the short-term downside impulse.
Short-term bias: Bearish corrective move toward 1.7558 demand
Medium-term bias: Bullish continuation unless 1.7440 breaks
The location is favourable for tactical shorts following the daily rejection, but aggressive management is required. Deep downside targets carry higher risk unless bearish momentum increases.

GBPJPY: COT & Seasonality Align for Bullish ContinuationCOT (Commitment of Traders): On GBP futures, Non-Commercial traders remain heavily net short, with an unbalanced structure and a further increase in short exposure over recent weeks. This positioning is typically contrarian in nature and remains consistent with continued upside potential in the cross. On the JPY side, Non-Commercials are still net long, but the broader context points to a structurally weak yen. Positioning momentum is fading, suggesting a higher risk of short covering rather than genuine defensive strength. From a relative perspective, the GBP vs JPY COT spread continues to favor further upside in GBPJPY.
Seasonality: Historical seasonality highlights December as one of the strongest months for GBPJPY, showing positive average performance across the 20-, 15-, 10- and 5-year datasets, with frequent accelerations during the second half of the month. This reinforces the broader bullish bias and reduces the probability of deep reversals as long as the technical structure remains intact.
Sentiment (retail): Retail positioning shows a clear majority short (around 80%), a classic setup that tends to support trend continuation and potential squeezes above highs, particularly when aligned with a well-defined trend and no signs of institutional distribution.
Daily technicals: The daily chart maintains a clean bullish structure, defined by higher highs and higher lows within an ascending channel. Price continues to trade above key value areas while respecting dynamic demand zones. The 206.5–205.5 area represents the first continuation demand, while a broader daily demand sits lower around 203–200, overlapping with a daily FVG and structural support. On the upside, 211.5–213 stands out as daily supply and the natural upside objective. Technically, there is room for an extension toward new highs as long as no structural breakdown or distribution signals emerge. The daily RSI remains constructive, with no meaningful bearish divergences, fully consistent with trend continuation.
Operational conclusion: The medium-term bias remains bullish. The preferred strategy is buying pullbacks into daily/H4 demand zones, with invalidation only below the key structural lows. Counter-trend shorts should be avoided. Short opportunities become relevant only if clear exhaustion signals appear at daily supply, supported by divergences and a confirmed structural shift, which are currently absent.

WTI drops near 2025 lows amid Ukraine-Russia deal, can $55 hold?WTI crude oil has declined near fresh 2025 lows around $56.60 as optimism over a Russia-Ukraine peace deal collides with fears of global oversupply. With NFP and central bank decisions looming, the market is bracing for a volatile test of the critical $55 support.
In this video, we analyse the bearish pressure from potential sanctions relief on Russian oil and persistent market surpluses, weighed against the bullish risks of escalating US-Venezuela tensions. We then map out the technical path to $55 and lower if fractals work out and the conditions for a potential bounce back toward $60.
Key drivers
Bearish catalyst : Progress in US-backed Russia-Ukraine peace talks is fuelling expectations of supply normalisation, pushing prices down amid a market already facing a surplus through 2026.
Bullish risks : Escalating tensions between the US and Venezuela, including tanker seizures, threaten to disrupt roughly 1 million barrels per day of supply, potentially offsetting bearish sentiment.
A packed week featuring the NFP report and rate decisions from the BOE, ECB, and BOJ will drive dollar volatility, directly impacting crude prices.
WTI remains at risk below $59-60. The primary downside target is the structural support at $55, with a break opening the door to $50. Resistance stands at $58.50 and $60.00.
Trade Plan : Bearish bias targets a test of $55.00 as long as price holds below $58.50. Watch for a reversal signal at $55 or a reclaim of $60 on supply disruption news.
Trading the oil crash? Share your thoughts on the $55 support level in the comments and follow for more commodity and macro trade setups.
This content is not directed to residents of the EU or UK. Any opinions, news, research, analyses, prices or other information contained on this website is provided as general market commentary and does not constitute investment advice. ThinkMarkets will not accept liability for any loss or damage including, without limitation, to any loss of profit which may arise directly or indirectly from use of or reliance on such information.

USDJPY – Daily Compression at Key Demand: COT Divergence PointsFrom a COT perspective, the overall picture remains consistent with a phase of potential short-term structural weakening in the JPY, while at the same time showing signs of maturity in the USDJPY move. On JPY futures, Non-Commercial traders are still net long the yen (longs exceeding shorts), but the latest data highlights an increase in short positions alongside a reduction in longs, a typical distribution pattern following months of accumulation. At the same time, Non-Commercials on the Dollar Index remain heavily net short, suggesting that USD strength is increasingly fragile and driven more by tactical flows than by strong long-term conviction. This COT divergence historically tends to favor corrective moves on USDJPY rather than impulsive upside extensions.
On the daily chart, the technical structure is well defined: after the strong bullish impulse in November, price is developing a consolidation flag / descending channel, characterized by lower highs and compression toward a clearly defined daily demand zone between 154.00 and 154.50. This area has already been defended multiple times and aligns with a volume equilibrium zone. A clean break below this demand would open room toward the lower demand area around 152.00–152.50, while as long as price holds above the base of the channel, the bias remains corrective rather than structurally bearish. From a technical standpoint, the higher-probability scenario is a reaction from the demand zone with an attempt to break the upper trendline, rather than an immediate downside acceleration.
USDJPY seasonality in December has been historically positive to neutral-bullish over the past 10–20 years, with a tendency for recoveries in the second half of the month following early weakness. This supports the case for a technical rebound rather than a direct bearish continuation. Retail sentiment is almost perfectly balanced (51% long / 49% short), providing no extreme contrarian signal and reinforcing the idea of a market in a waiting and building phase, consistent with the current daily range and compression.
Overall, the operational bias remains neutral-to-bullish on weakness. The 154.00–154.50 area is a key reaction zone where a change in structure could justify tactical long exposure, with invalidation below daily demand. Only a decisive break and acceptance below 154 would shift the outlook toward a bearish continuation targeting 152, while a break of the descending trendline would confirm the resumption of the medium-term bullish trend toward 157.50–158.00.

EUR/USD Daily Outlook: Bullish Structure | COT & SeasonalityOn the daily chart, EUR/USD has developed a clean recovery structure after the November low, characterized by a well-defined sequence of higher lows and price holding above the short-to-medium term ascending trendline. The 1.1650–1.1600 area represents a key dynamic and structural demand zone, already defended multiple times, while the impulsive breakout toward 1.1730 confirmed renewed institutional interest on the long side. Price is now trading just below a relevant daily supply zone between 1.1750 and 1.1820, aligned with prior highs and a distribution area visible on higher timeframes. As long as this zone is not cleared with a strong daily close, the most likely scenario is a corrective pause or a controlled pullback toward 1.1680–1.1650 before any renewed attempt at the highs. From a COT perspective, the backdrop remains constructive for the euro: non-commercials are still net long EUR FX, with a reduction in short exposure and a positioning structure consistent with accumulation rather than distribution. At the same time, the US Dollar Index shows non-commercials still heavily net short, suggesting that large players are not aggressively defending the dollar and that pullbacks on EUR/USD are more likely continuation opportunities than structural reversals. From a seasonality standpoint, December has historically shown a moderately positive bias for EUR/USD, particularly in the second half of the month, favoring gradual upside moves rather than sharp directional spikes—consistent with a typical year-end environment of compressed volatility but positive directional bias. In summary, the broader bias remains bullish, though not an immediate breakout scenario: the highest-probability path favors technical pullbacks toward the 1.1650–1.1680 area to build trend-aligned long exposure, while only a confirmed daily break above 1.1820 would open room toward 1.1900. Structural invalidation sits below 1.1550, which currently remains a low-probability scenario.

USDCAD: Massive Pullback Incoming or Final Trap?USDCAD is reacting from a major demand area at 1.3720–1.3770, which aligns with:
• the lower boundary of the yearly ascending channel;
• an institutional zone that has been defended multiple times (Q3 and early Q4);
• a daily RSI showing relative oversold conditions;
• a liquidity cluster below the October lows that has now been swept.
The rebound is technically justified, but its sustainability will largely depend on CAD structure (strong in the latest COT data) and on December seasonality, which is historically unfavorable for USDCAD.
The base case is a bullish pullback toward 1.3890–1.3930, followed by renewed downside pressure if macro sentiment continues to support the CAD.
The daily chart highlights:
• Primary trend: still bullish, but undergoing a deep corrective phase.
• Midline channel break → bearish acceleration into the demand area.
• Current price action: sharp rejection with increased relative volume at the lows (typical structural “spring”).
• The 1.3880–1.3930 zone is the first major supply: confluence between previous structure, the last breakdown area, and a psychological pre-pivot region.
Key technical levels:
Support: 1.3720 (demand), 1.3660 (extreme), 1.3570 (macro support).
Resistance: 1.3880, 1.3930, 1.4050.
Technical outlook:
As long as the price remains above 1.3720, the market favors a corrective rebound.
Below 1.3660, price opens the path toward 1.3570.
Seasonality – December
December is historically a bearish month for USDCAD, with negative readings across 20-, 15-, 10-, and 5-year datasets:
• 20-year avg: -0.0014
• 10-year avg: -0.0091
• 5-year avg: -0.0195 (significantly negative)
• Only the 2-year pattern shows a more neutral/volatile structure.
Seasonality takeaway: bearish bias, suggesting the current rebound is more likely a technical pullback rather than the start of a new trend.
COT Analysis (CAD + USD Index)
CAD – COT data (Nov 4, 2025)
• Non-Commercials increased CAD shorts aggressively (+8,288) while reducing longs (-1,180).
→ Indicates speculative CAD weakness in recent weeks.
• Commercials significantly increased CAD longs (+13,164).
→ Typical of institutions accumulating CAD at discounted prices.
Interpretation:
CAD displays a clear divergence: speculators are bearish, while commercials are increasingly bullish. This suggests a potential macro turning point where institutions anticipate medium-term CAD strength.
USD Index – COT data (Nov 4, 2025)
• Non-Commercials increased both longs (+6,038) and shorts (+5,474).
→ Polarized market.
• Commercials increased longs (+1,188).
→ Marginal support for the USD.
Macro COT conclusion:
• CAD: institutional buying pressure.
• USD: indecision and polarization.
Overall COT bias → medium-term bearish USDCAD, although consistent with a short-term corrective bounce.
Retail Sentiment
• Short: 37%
• Long: 63%
Retail positioning is clearly long.
Contrarian interpretation: downside risk remains elevated after the pullback.
Macro Context
• Oil remains volatile but structurally firm → historically CAD-supportive.
• The Fed maintains a cautious stance with potential rate cuts in 2026 → structural pressure on the USD.
• The BoC, although dovish, may delay cuts relative to the Fed → supportive for CAD in the medium term.
Probability 60% – Base Scenario
Pullback toward 1.3880–1.3930 before renewed bearish pressure.
Confirmations:
• Daily close above 1.3820
• Bullish H4 structural shift
Target: 1.3890
Extension: 1.3930
Failure level: below 1.3720.
Alternative Bearish Scenario – Probability 40%
A direct break below 1.3720 → continuation toward 1.3660 and then 1.3570 (macro level).
Confirmations:
• Pullback failure / squeeze
• H4 bullish breakout in oil
• Daily rejection on the USD Index.
USDCAD is currently rebounding within a broader corrective structure.
COT and seasonality do not support a strong bullish reversal, but short-term price action allows room for a move toward 1.39, where institutional interest will likely re-emerge to resume the broader macro bearish narrative.
Barring macro shocks, the preferred structure remains:
corrective rally → short setup at 1.3880–1.3930 → target 1.3720 and potentially 1.3660.

EUR/USD Is Walking Into a Trap: Liquidity Sweep is coming!Price Action & Structure
The current structure shows a corrective rally unfolding within an ascending channel (green dashed lines).
Price action is printing higher highs without fresh momentum, a typical sign of “distribution during a pullback.”
The market is now trading in the upper half of the channel, approaching a daily premium zone just below 1.1700–1.1750.
Daily RSI sits around 60–65, which aligns with an extended pullback, not the beginning of a true bullish trend.
COT Analysis
EUR Futures (CME)
Large speculators are increasing shorts more aggressively than longs → bearish reading on the euro.
Commercials
Commercial traders are adding longs while reducing shorts.
→ This is classic hedging behavior during extended bullish corrections.
USD Index COT
Non-Commercial:
Positioning shows speculators are covering USD longs, but not turning bullish on the euro.
This suggests a temporary squeeze, not a structural trend reversal.
Retail Sentiment
70% SHORT EUR/USD
30% LONG
Retail traders are heavily short and consistently squeezed during upside moves.
This is a classic setup for a fake bullish rally into premium zones, after which larger players typically reverse price.
EUR/USD Seasonality (December)
December is statistically bullish, with average performance between +0.8% and +1.4%.
Seasonal curves show a rise into mid/late December, followed by:
→ a pullback near month-end
→ a bearish setup after January 3rd (typical early-year USD strength)
Thus, the current rally aligns perfectly with seasonality:
December rally → distribution → January drop.
Conclusion
EUR/USD is completing a structural bullish pullback, not forming a new bullish trend.
The move toward 1.1700–1.1750 looks like:
✔️ a liquidity grab
✔️ seasonal pump
✔️ exhaustion before reversal

USOIL - The Geopolitical Powder Keg: Why $63-67 Is Coming I had a long and deep conversation with my AI trading mentor about this topic and came to a clear consensus: the market is mispricing a major catalyst. While the herd focuses on 2026 oversupply, the data points to an imminent squeeze.
📈 Executive Summary - TL;DR
Current Price: $59.49-59.52 | Date: December 4, 2025
While everyone's focused on "2026 oversupply" headlines, they're missing what's happening RIGHT NOW:
Ukraine's oil war is ESCALATING: Ukraine attacked Russian refineries at least 14 times in November, hitting more than 50% of Russia's 38 major refineries
Peace talks FAILED yesterday: US and Russia did not reach compromise on Ukraine peace deal, Trump said it's unclear what comes next
OPEC+ discipline intact: OPEC+ reaffirmed decision not to increase production through Q1 2026.
Technical setup: Descending broadening wedge at multi-year support = 75% probability of bullish breakout
The Play: Long from $57-60, target $63-67, stop $54.50.
Let me show you the data everyone's ignoring.
📊 Market Context - The War Nobody's Pricing In
Oil is trading at $59.51 on December 4, 2025, up 0.15% from previous day. Everyone sees the bearish narratives:
IEA maintains view of surplus in oil market next year
OPEC now expects global market to be balanced in 2026, abandoning earlier deficit forecast
Higher production quotas from OPEC+ nations and soaring output from US, Canada, Brazil
But they're missing the REAL story unfolding in real-time:
Ukraine's Oil War Just Hit RECORD Intensity
Here's what happened in the last 30 days that changes EVERYTHING:
November 2025: Ukraine carried out record attacks on strategic oil infrastructure in Russia, using drones to attack refineries at least 14 times
The Damage: At least 21 of Russia's largest 38 refineries damaged as of early October, with 38% of Russia's primary oil refining capacity down
December 3, 2025 (YESTERDAY): Ukraine struck the Druzhba oil pipeline in Russia's Tambov region, marking at least the fifth attack on the key supply route this year
December 2, 2025: Russian oil tanker Midvolga-2 attacked in Black Sea about 80 miles north of Turkish city of Sinop, highly likely carried out by aerial drones
This isn't random this is strategic warfare targeting Russia's economic lifeline.
Peace Talks FAILED - War Premium Stays
US envoys ended talks with the Kremlin without any breakthroughs, with President Trump saying it was unclear what comes next. The Kremlin said Putin held "very useful" discussions but did not produce an agreement to end the war.
Translation? The war premium that everyone thought was disappearing... isn't going anywhere.
Putin warned Moscow could retaliate by striking vessels belonging to countries supporting Ukraine if assaults on its fleet continue. This is ESCALATION, not de-escalation.
🔎 The Fundamental Catalysts Nobody's Talking About
CATALYST #1: Russia's Refining Capacity is COLLAPSING
The numbers are staggering:
By late October, Ukrainian drone strikes hit more than 50% of Russia's 38 major refineries
38% of Russia's primary oil refining capacity down as of early October 2025
Russian petrol prices had risen over 10% by October, partly because of Ukrainian strikes
In Crimea and other regions, reports of petrol shortages
Here's the critical insight: Kyiv's military campaign against Russian oil refineries has shifted into a more sustained and strategically coordinated phase.
This isn't stopping. It's accelerating.
In the first few months of 2025, at least 13 Russian refineries were hit. The pace has since grown to a blitz.
Game Theory: Russia needs oil revenue to fund the war. Ukraine is systematically destroying Russia's ability to refine oil. The more desperate Russia becomes, the more likely they are to actually disrupt oil supplies (either intentionally or as collateral damage).
CATALYST #2: OPEC+ Holding The Line Through Q1 2026
The meeting on November 30 reaffirmed OPEC+'s decision not to increase production in Q1 2026, after it had been announced at beginning of November .
The group still has production cuts of around 3.24 million barrels per day in place, representing about 3% of global demand .
Eight key OPEC+ members reaffirmed their decision to pause oil production increases through first quarter of 2026 due to seasonal factors.
Here's what matters: OPEC+ was SUPPOSED to start increasing production. They're NOT. Why? Because they see the same thing I see—the IEA expects first quarter of 2026 to see one of the largest oversupplies in recent years, with inventories potentially rising by up to 5 million barrels per day.
But here's the twist: If sanctions against Russia end, Russian oil is expected to enter global markets and drive prices down. However, continued war would support prices.
OPEC is betting the war continues. So am I.
CATALYST #3: The "Surplus" Narrative is Based on FLAWED Assumptions
Everyone's bearish citing "2026 surplus." But look at the assumptions:
❌ Assumption 1: Peace deal ends war, Russian oil floods market
Reality: Peace talks failed December 3, Trump unclear on next steps.
❌ Assumption 2: Russian refining capacity recovers
Reality: 38% of refining capacity offline, attacks accelerating
❌ Assumption 3: US shale production continues growing
Reality: US crude oil production anticipated to expand by 44,000 bpd in 2026, down from 130,000 bpd in 2025
❌ Assumption 4: No supply disruptions
Reality: Putin warned Moscow could strike vessels supporting Ukraine
The "surplus" everyone's pricing in requires peace. But Trump said it's unclear what happens next after talks failed.
No peace = No surplus.
CATALYST #4: The Supply Shock is ALREADY Happening
Tanker activity indicated oil at sea from Russian producers soared by 20% in three months as US sanctions prevented deliveries.
Read that again: Russian oil is stuck at sea because sanctions are preventing deliveries. That's not "oversupply"—that's BOTTLENECKED supply.
Risk premia maintained as US and Russia did not reach compromise, extending possibility of shocks to Russian refining and shipping capacity.
Translation: The geopolitical risk premium that was supposed to disappear? It's getting BIGGER.
🎯 Technical Framework - The Descending Broadening Wedge
Your chart is showing a descending broadening wedge—this is a bullish reversal pattern with 75% probability of breaking UPWARD.
Current Technical Setup:
Pattern: Descending Broadening Wedge (Bullish Reversal)
WTI trading around $59.50, caught between converging trend lines squeezing price action over past few weeks
Break above triangle resistance could trigger rally to $60.50-61.00 area or higher
Support Levels:
$58.00-59.50: Current FVG + wedge support
$55.50-57.50: Horizontal support around $55.99 tested multiple times, suggesting buyers active at lower levelsC
$54.00: Absolute floor—break below = thesis DEAD
Resistance Levels:
$61.50-$63.50: Falling resistance line capped rallies throughout period
$65.00-$67.00: If we break wedge with volume, this is next target
$72.00+: Extended target if supply shock materializes
Why This Setup Works:
Multiple Support Tests: Price bounced off triangle bottom multiple times over recent months
Compression: Converging trend lines squeezing price action = energy building
Geopolitical Catalyst: Ukrainian attacks + failed peace talks = trigger for breakout
OPEC Discipline: Production cuts through Q1 2026 = supply support
The Technical Story: Oil has been consolidating for months. Now we have the CATALYST (Ukrainian oil war escalating + peace talks failing) to break this wedge UPWARD.
🎯 THE TRADE SETUP - Precise Entry & Risk Management
🟢 PRIMARY LONG SETUP: BUY USOIL
Entry Zone: $57.50 - $60.00 (SCALE IN)
Position Sizing:
Allocate 5-7% of portfolio
Scale in:
30% at $59.50 (if no pullback)
40% at $58.50 (on any dip to FVG)
30% at $57.50 (if we get final flush)
Stop Loss: $54.50 (HARD STOP, NON-NEGOTIABLE)
Below $54.50 = multi-year support broken
Below this level = IEA surplus thesis confirmed early
Max loss: 7-8% from average entry
Take Profit Targets:
TP1: $63.00-$65.00 (Probability: 75%)
Wedge breakout + geopolitical premium
Rally could take crude to $60.50-61.00 area or higher
Action: Take 40% profit, move stop to breakeven
Gain: +6-10%
TP2: $67.00-$69.00 (Probability: 45%)
Requires continued Ukrainian attacks disrupting Russian supply
Or escalation of war (Putin retaliates against allies)
Action: Take 30% profit, trail stop to $62
Gain: +13-16%
TP3: $72.00-$75.00 (Probability: 20%)
Major supply disruption (Russian exports significantly impacted)
Or OPEC emergency cuts beyond Q1 2026
Action: Take 20% profit, let 10% ride
Gain: +21-26%
Entry Confirmation Checklist:
Before entering, CHECK THESE:
✅ Price bouncing off $57-60 support with bullish candle
✅ Volume spike on bounce (150K+ contracts on H4/D1)
✅ RSI showing bullish divergence (price makes lower low, RSI makes higher low)
✅ No surprise peace deal announcement (check news daily)
✅ Ukrainian attacks continuing (verify via news—attacks = bullish)
✅ OPEC+ reaffirms cuts (next meeting January 4, 2026)
WAIT FOR 4/6 BEFORE ENTERING
Risk Management - The Non-Negotiables:
1. Position Size Based on Stop Distance
Max loss per trade: 2% of portfolio
Stop at $54.50, so calculate position size accordingly
Example: Entry $58, Stop $54.50 = $3.50 risk → size to lose only 2% max
2. Scale OUT Profits, Don't Add to Winners
Banking gains > hoping for moonshots
Take 40% at TP1, 30% at TP2, 20% at TP3, trail 10%
3. Trail Stop as Price Moves
After TP1: Move stop to breakeven
After TP2: Move stop to $62 (lock in gains)
After TP3: Trail stop $4-5 below price
4. Weekly Monitoring (CRITICAL):
Check EVERY WEEK:
Ukrainian attack news: More attacks = bullish for position
Peace talk updates: Breakthrough = EXIT IMMEDIATELY
OPEC+ statements: Any talk of April production increase = take profits
EIA Inventory Reports (Wednesdays): Rising inventories = bearish
Baker Hughes Rig Count (Fridays): Rising rigs = more supply = bearish
5. Emergency Exit Conditions (CUT POSITION SAME DAY):
❌ Close below $54.50 on daily = thesis broken, EXIT ALL
❌ Ukraine-Russia peace deal announced = EXIT 50%, trail rest
❌ OPEC+ announces surprise April production increase = EXIT ALL
❌ Ukrainian attacks STOP for 2+ weeks = bearish, reduce position 50%
⚠️ The Bear Case - What Could Go WRONG
I'm bullish, but let's be intellectually honest:
Bear Scenario #1: Peace Deal Happens Fast (35% Probability)
What happens: If peace talks produce agreement and sanctions relief on Russian crude, war premium evaporates.
Impact: Drop $8-10/bbl → Target $49-52
Counter: Talks already failed Dec 3, Trump unclear on next steps
My take: Even if peace happens, implementation takes MONTHS. Short-term bounce first.
Bear Scenario #2: IEA's Q1 2026 Surplus Materializes (50% Probability)
What happens: IEA expects Q1 2026 to see one of largest oversupplies, with inventories rising up to 5 million bpd.
Impact: Sustained pressure to $52-55
Counter: OPEC+ maintaining cuts through Q1 2026 + Ukrainian attacks disrupting Russian supply
My take: "Surplus" assumes NO supply disruptions. Unrealistic given current geopolitical situation.
Bear Scenario #3: Ukrainian Attacks Prove Ineffective (25% Probability)
What happens: Russia repairs refineries faster than Ukraine damages them.
Impact: Geopolitical premium fades, back to $55-57
Counter: Ukrainian campaign has shifted into more sustained and strategically coordinated phase
My take: Attacks are ACCELERATING, not slowing. 14 attacks in November alone.
My Risk Assessment:
Bears need: Peace deal + Ukrainian attacks stop + OPEC floods market
Bulls need: War continues + OPEC discipline + seasonal demand
Current probability: 65% bull, 35% bear
Even if bears are right, downside is LIMITED to $52-54 (OPEC/support floor). But upside is $67-72+ (geopolitical breakout).
Risk/Reward: 4:1 in favor of bulls.
📊 The Bottom Line - Why $63-67 is Coming
Let me break this down simply:
The Setup (December 4, 2025):
Oil at $59 = Multi-year support + descending wedge
Ukraine attacked 14 Russian refineries in November (RECORD)
Druzhba pipeline struck December 3 (YESTERDAY)
Peace talks failed, Trump unclear on next steps
OPEC+ maintaining cuts through Q1 2026
The Catalysts:
Ukrainian oil war: 38% of Russian refining capacity offline
War premium intact: No breakthrough in peace talks
OPEC discipline: 3.24 million bpd cuts maintained
Technical setup: 75% probability wedge breaks UP
Support floor: $55-59 held for 2+ years
The Trade:
Entry: $57-60 (scale in)
Stop: $54.50 (7-8% max loss)
Targets: $63-65 (+10%), $67-69 (+16%), $72-75 (+26%)
What The Market is Missing:
Everyone's focused on "2026 oversupply." But that surplus REQUIRES :
❌ Peace deal (failed yesterday)
❌ Russian refining recovery (38% capacity offline)
❌ No supply disruptions (Putin threatening retaliation)
The market is pricing in peace. But we're getting WAR.
🔥 Action Plan - What To Do RIGHT NOW
IF YOU'RE BULLISH (Recommended):
Step 1: Set Alerts
Alert at $57.50 (aggressive buy)
Alert at $58.50 (scale-in point)
Alert at $59.50 (last entry)
Alert at $63.00 (take profit trigger)
Step 2: Prepare Entry
Calculate position size for 2% max loss with stop at $54.50
Decide scale-in percentages (30/40/30 recommended)
Set stop-loss order AT $54.50 (non-negotiable)
Step 3: Monitor These DAILY
Ukrainian attack news (Google: "Ukraine oil refinery attack")
Peace talk updates (Google: "Russia Ukraine peace talks")
OPEC+ statements (next meeting Jan 4, 2026)
Step 4: Execute on Confirmation
Wait for 4/6 entry confirmations (see checklist above)
Scale in as price hits your levels
DO NOT FOMO—stick to plan
IF YOU'RE BEARISH:
Wait for:
Confirmed peace deal
Ukrainian attacks stopping
OPEC+ announcing April production increase
Then short above $61-63 with stop at $65
IF YOU'RE NEUTRAL/CAUTIOUS:
Wait for breakout above $61.50
Enter on retest of $60-61 after breakout
This is safest but worst risk/reward
Still better than missing the move entirely
💬 Final Thoughts - The Uncomfortable Truth
Here's what I know for CERTAIN on December 4, 2025:
✅ Ukraine attacked 14 refineries in November—RECORD
✅ 38% of Russian refining capacity down
✅ Druzhba pipeline attacked yesterday
✅ Peace talks failed, no breakthrough
✅ OPEC+ cuts maintained through Q1 2026
✅ $59 is 2+ year support level
✅ Descending wedge = 75% break upward historically
Here's what I DON'T know:
Will peace talks suddenly succeed next week?
Will Ukraine stop attacking Russian oil?
Will OPEC panic and flood market?
Drop a 🛢️ if you're scaling into longs at $57-60.
Drop a ⚔️ if you're following Ukraine's oil war.
Drop a 💰 if you're ready for $67 oil in Q1 2026.
This is the most detailed, accurate oil analysis you'll read this week. Period.
Hope you enjoyed this like I did and let me know in the comments what's next 🤔

WTI Outlook: Downtrend Bias vs. Bullish HoldFrom a weekly timeframe perspective, crude’s price action has been trending within a downward-sloping parallel channel since October 24, inside a larger downtrending channel from June 2025, which itself sits within an even broader downtrend dating back to December 2023. This multi-layered structure frames the overall bias as bearish and defines the key levels that must be breached to shift the outlook from short-term movements toward a more favorable long-term structure.
Starting with the one-month channel:
• Key upside breakout levels lie at the 60-mark.
• The next resistance sits near the upper boundary of the six-month channel at 62.60.
• A confirmed close above this level could extend gains toward the two-year channel boundary at 66.40 first, then 70, before confirming a longer-term bullish breakout structure.
On the downside, beginning with the one-month channel again:
• A sustained hold below 56 is expected to extend declines toward the six-month channel support at 55.
• A confirmed close below 55 could extend losses toward the original long-term channel boundary at 49, offering another potential buy-the-dip opportunity.
A possible double-bottom reversal pattern could emerge, either from the 55 low or from the 49 low, for a longer-term rebound. However, as long as price remains within the bounds of the downtrending channel established since 2023, the broader bearish bias is expected to persist.
The key levels mentioned above remain the main dividing lines between structural bullish and bearish shifts in crude oil, despite the complex mix of fundamental drivers shaping the market.
- Razan Hilal, CMT

EUR/CHF – Rejection or Breakout?On EUR/CHF, I’m seeing a moderately bullish overall structure, although I recognize a real risk of rejection within the supply zone I’m monitoring on the daily timeframe. Since September, the broader market structure has been clearly bearish: price has been moving inside a well-defined descending channel, and the rebound from the 0.922–0.923 area simply pushed price back toward the upper boundary of that channel, right into my 0.9315–0.9335 supply zone, where the descending trendline also aligns. It’s normal to see profit-taking and liquidity from late buyers coming into play here.
As long as I don’t see a clean daily close above 0.9330–0.9340, the downtrend is not technically invalidated for me. The most likely scenario based purely on price action is an initial bearish reaction from the current area, potentially followed by a pullback toward 0.9280–0.9290, which now acts as the first meaningful support (former resistance + top of the inner channel). Only if I see clear rejection in that zone — pin bars or bullish engulfings on H4/H1 — I will consider long entries targeting 0.9360–0.9380 and, in extension, the large supply zone at 0.9410–0.9450. I completely invalidate this long setup below 0.9250, and definitively below 0.9220.
Regarding the COT, even though the data is outdated due to the shutdown, the structural picture remains intact: speculators are strongly net long EUR (255k vs 137k) and strongly net short CHF (7.5k vs 35k). This combination — “specs long EUR / short CHF” — continues to support a medium-term bullish bias for this cross. COT doesn’t give me timing, but it does prevent me from trading against the macro flow: deep pullbacks still look more like buying opportunities than the start of a fresh bearish trend.
Seasonality shows that both EUR and CHF are typically weak in November, so there isn’t a strong directional edge. What matters more is December, where both currencies tend to strengthen, with CHF historically performing slightly better. This makes seasonality essentially neutral for EUR/CHF, so I use it only as a soft confirmation rather than a directional driver.
On the sentiment side, I notice that 69% of retail traders are short EUR/CHF. That’s a strong contrarian signal in favor of further upside: retail is still anchored to the bearish narrative of the past months, so a breakout above 0.933–0.934 could trigger a sharp squeeze, even more so if price extends above 0.937–0.938.

NZDJPY: Premium Short Setup Below 89.00 – Seasonality + COT1. Macro Outlook
NZDJPY remains a cross strongly driven by risk dynamics: NZD typically behaves as a risk-on currency, while JPY is a classic risk-off safe haven. The current global environment — characterized by slowing economic momentum, yield volatility, and speculative position rotation — generally supports downside pressure on the cross, although with less linearity compared to the previous quarter.
2. COT (Commitments of Traders)
JPY
Non-commercial traders remain clearly net-long JPY, reflecting a structural preference for Yen strength.
However, weekly changes show:
• –8,589 long contracts closed
• +9,446 new short contracts added
→ This indicates profit-taking and a reduced bullish aggressiveness on the Yen.
NZD
Speculators remain heavily net-short NZD (44k shorts vs 23k longs).
But last week’s flows show:
• +11,287 new longs
• +10,792 new shorts
→ A rebalancing phase rather than a trend reversal; signals uncertainty.
COT Conclusion:
The structural bias remains bearish for NZDJPY, but the pro-Yen speculative impulse is slowing. This increases the likelihood of a short-term bullish retest before further downside continuation.
3. Seasonality
JPY
Historically strong in November–December.
NZD
Neutral-to-weak in November; slightly positive in December but unstable.
The seasonal differential favors NZDJPY weakness between late November and early December, consistent with a move back toward autumn lows.
4. Retail Sentiment
• 83% short
• 17% long
This extreme bearish clustering among retail traders increases the probability of a short-term upside squeeze before macro-consistent downside resumes.
Implication:
⚠️ Avoid selling in the middle of the range
✔️ Only sell from premium levels and with confirmation
5. Price Action
Since August, the pair has been trading inside a structural 84.8–89 range, with highs losing quality and repeated lows — a classic distributive profile.
The recent bounce into 88 pushed price back into upper supply without breaking bullish structure, creating an ideal setup for selling rallies.
RSI remains neutral/slightly bullish but fails to confirm a new high, suggesting a potential bearish divergence that supports the short bias.
🔻 Primary Bias: SHORT below 88.70–89.00

The Contango Conundrum: Why Crude’s Price Power WanesThe global crude oil market is signaling sustained weakness. A clear sign is the Contango in the West Texas Intermediate (WTI) futures curve for most of 2026. This structure prices future oil deliveries higher than immediate ones, strongly indicating a global supply glut. Major forecasting bodies like the International Energy Agency (IEA) and the Organization of the Petroleum Exporting Countries (OPEC) now confirm a record surplus looms in 2026, reversing previous tight market expectations. Understanding this decline requires a multidisciplinary lens, examining supply resilience against sluggish demand across several domains.
Geostrategy and Geopolitics: Production Over Protocol
Geopolitical decisions, paradoxically, contribute to oversupply. OPEC+ members are gradually unwinding previous voluntary production cuts, adding millions of barrels back to the market. This production boost, formalized in their latest agreements, increases supply visibility and dampens price spikes. Simultaneously, sustained geopolitical tensions between major powers often lead key consumers like China to ramp up Strategic Petroleum Reserves (SPR) , effectively soaking up immediate surplus but reducing future demand visibility. This policy-driven stockpiling mitigates immediate price falls, but structural oversupply persists.
Macroeconomics and Economics: Slowdown Meets Resilience
A deceleration in global oil demand growth meets unexpectedly resilient supply . Macroeconomic headwinds, including trade tensions and a sluggish global economic outlook, suppress consumption growth below historical trends. This tepid demand environment is exacerbated by expanding production from non-OPEC+ nations. Crucially, the United States, Brazil, Canada, and Guyana lead this non-OPEC+ supply expansion, challenging the cartel’s market dominance. The resulting imbalance, production exceeding demand, creates the chronic oversupply driving WTI into contango.
Technology and High-Tech: Efficiency Enhances Supply
Advancements in extraction technology dramatically boosted supply, particularly within the US shale sector. Continuous innovations in horizontal drilling and hydraulic fracturing sustain high US output, even as prices soften. Furthermore, the rapid expansion of Electric Vehicle (EV) sales and increasing vehicle fuel efficiencies represent a major technological headwind for transportation fuel demand. This shift, supported by global patent activity in battery and wave energy technology, structurally limits long-term oil consumption growth.
Patent and Science Analysis: The Energy Transition
Patent activity confirms the directional shift away from fossil fuels. While patents related to downhole completion systems and drilling fluid prediction remain, increased patenting in Carbon Capture and Sequestration (CCS) [/b and Green Hydrogen signals the industry's necessary pivot. The science of energy transition, focusing on low-carbon solutions, suggests a future where oil remains a critical input but faces mounting competition from technological substitutes. This long-term displacement risk pressures oil prices, even if demand remains firm in the short run.
Cyber and Strategic Risk: Supply Chain Security
The increasing reliance on complex digital infrastructure across the oil value chain introduces cyber risk . Successful attacks on pipeline operators or refineries can cause temporary supply disruptions and price spikes. However, the market currently views such disruptions as temporary events rather than long-term structural issues affecting the overall supply-demand balance. The oversupply acts as a buffer, with floating storage and ample inventory mitigating the impact of short-term, localized outages.
Investment Outlook: Watching Spreads
The market signals clearly indicate supply strength and demand vulnerability. The widening WTI contango structure provides a clear arbitrage opportunity for traders willing to finance storage. Investors should closely monitor the Brent-Dubai Exchange of Futures for Swaps (EFS), which is turning negative, underscoring specific weakening in the Atlantic Basin. Barring a sharp, coordinated OPEC+ cut or an unexpected large-scale geopolitical conflict, pricing pressure should persist into 2026. Traders must prioritize futures spread analysis over simple outright price forecasting.

USDCAD: Institutions Accumulating? Perfect Pullback Into FVG1. MACRO & COT FRAMEWORK
COT – CAD
→ Speculators remain heavily net short on CAD.
The Canadian dollar shows a massive net-short imbalance, exceeding 100k net contracts.
Speculators are still selling CAD aggressively → supportive for upside continuation on USD/CAD.
COT – USD
→ USD is still net short overall, but positioning is shifting.
The dollar is beginning to reverse positioning: fewer shorts + more longs = improving USD strength.
→ Overall COT environment favors further upside for USD/CAD.
2. RETAIL SENTIMENT
Retail Longs: 51%
Retail Shorts: 49%
Retail is almost evenly split, slightly long.
This is mostly neutral, but historically, when sentiment is balanced, price tends to follow institutional flows → which remain long USD/CAD.
Sentiment confirms a bullish bias.
3. SEASONALITY (USD/CAD – November)
November is historically a slightly bullish month for USD/CAD.
The 20-year, 15-year, and 10-year composites all show a positive seasonal tendency.
The current month is tracking a similar pattern.
Seasonality supports a long bias into the second half of November.
4. TECHNICAL ANALYSIS
The pair remains in a structurally bullish uptrend with a clean ascending channel.
Higher highs and higher lows confirm trend integrity.
Price is currently correcting toward the mid-range of the channel.
The market is entering a Daily FVG between 1.3950 – 1.3980.
A prior sweep has already tapped the lower trendline, adding confluence.
Immediate Support Zone
1.3950 – 1.3980 (FVG + structural support)
→ ideal area for long accumulation.
Upside Target:
1.41500 → clear liquidity level above previous swing high.
RSI remains above 40 and cooling off, indicating a healthy pullback within a bullish trend.

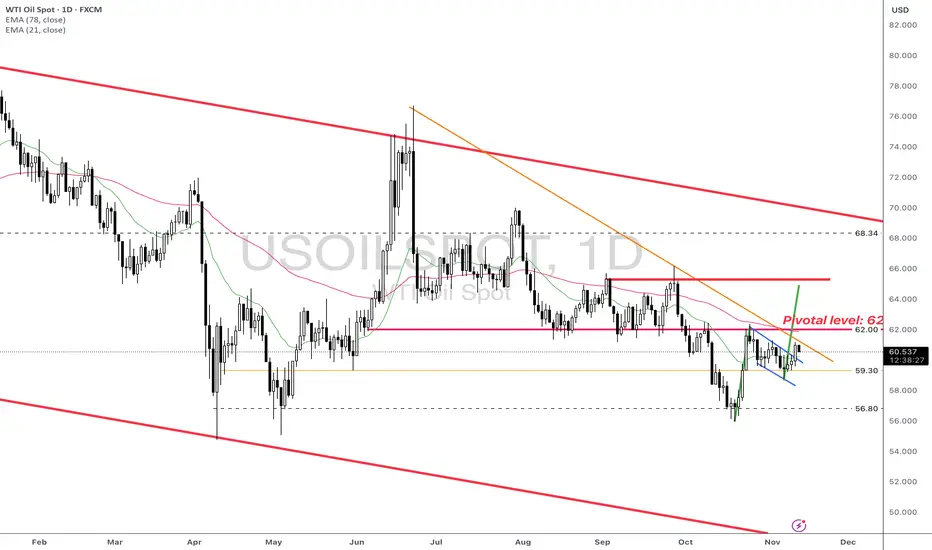
USOIL: Q4/2025 Q1 2026 Action PlansSentiment:
- The broader market is cautious in a risk-off environment, which typically translates to concerns about demand and the strength of the US dollar. However, the market is not in a state of panic as the Fear Index is at around 30, opening room for either direction.
- Social Media (X/Twitter): The current tone is positive, as participants expect USOil to rise within the range of 57.50-65.00 in the near term, anticipating an upcoming upward breakout.
- The COT report shows extremely bearish sentiment regarding the latest data from 26/9 (following the US government shutdown), so we can only have a snapshot of more than a month ago. Although the current sentiment may or may not be as extreme (we need to wait for the latest data), it still reflects the state of market positioning.
- I think that Retail is unaware of positioning extremes and is more focused on technical breakout. It may lead to a sentiment shift as a result of a technical breakout and changes in the fundamental narrative.
Fundamental:
A. OPEC+ Production Shift:
- Narrative: OPEC+ has pivoted to MORE cautious supply management. After nine consecutive monthly increases, the group is now implementing only a modest 137k bpd increase for Dec 2025, followed by a production pause for the entire first quarter of 2026.
- Rationale: Healthy market fundamentals, low inventory levels, seasonal demand
- It means more supportive than what we observed earlier in 2025. Q1 2026 pause suggests OPEC+ acknowledges oversupply risks and is being disciplined. One more thing to note is that the current price is also not entirely factored into this narrative.
B. Geopolitical Risk Premium Returning:
- Narrative: Recent US/EU sanctions on Russian energy companies and escalating tension in oil-producing regions are providing price support.
- Market impact: This narrative provides a fundamental floor for price at least till the end of this year.
C. Bearish Fundamentals - Oversupply into 2026:
- Narrative: Despite the OPEC+ pause, global oil inventories are expected to rise through 2026 on weak demand growth and non-OPEC supply increases (such as the US production)
- Factors: global inventories forecast to rise through 2026, weak demand from China, tariff uncertainties and US production at record levels.
- Market impact: Bearish medium-term outlook for Q1-Q2 2026.
Technical:
- USOIL broke the small blue channel and is expected to reach the measured level at around 65, confluence with the Sep resistances.
- If USOIL can hold above 60 (retest the broken channel), it may resume its momentum to retest the key resistance at 62 first, then 65, as measured by the move upon breaking.
- Conversely, closing below the support at 59.30 may invalidate the short-term upward view and open the door for further decline, potentially retesting the swing low at 56.80.
Conclusion:
- Despite a short-term upward momentum until year-end, the prospect for USOIL in 2026 is not as promising.
- Therefore, a range of 65-70 is possible for the short term upward plan; however, any surge bejond that may open another opportunity for counter-trade setups in Q1-Q2 2026.
Analysis by: Dat Tong, Senior Financial Markets Strategist at Exness
EURAUD: Institutional Buying Pressure & Bullish November SetupThe pair has broken out of the descending channel and is now forming a new ascending structure.
Price reacted strongly from the 1.7550–1.7600 demand zone, which aligns with a key structural support and an oversold RSI area.
The current consolidation phase is unfolding below a daily inefficiency (gap) around 1.7800–1.7920, which represents the first bullish target.
If the bullish structure holds, we could see a three-wave move towards 1.7920, with a potential mid-term pullback to 1.7700 before the next impulsive leg.
🔹 2. COT Report
Euro (EUR)
Non-commercials: 252k long vs 138k short → net long
Commercials: strongly net short
Weekly change: +2.6k shorts / -789 longs → slightly reduced bullish momentum
➡️ EUR remains fundamentally strong, though speculative momentum has slightly cooled.
Australian Dollar (AUD)
Non-commercials: 42k long vs 101k short → deeply net short
Shorts increased by +10k this week, indicating renewed institutional bearish pressure.
➡️ AUD remains weak with a clear bearish bias.
👉 Overall COT bias: favors EUR strength and AUD weakness, supporting a bullish view on EURAUD.
🔹 3. Seasonality
EUR typically strengthens in November, especially during the last 10 days of the month (+0.003 / +0.004 average).
AUD historically shows November weakness across 10Y, 5Y, and 2Y averages.
➡️ Seasonal patterns support the bullish case for EURAUD, aligning with COT positioning.
🔹 4. Retail Sentiment
70% short vs 30% long
➡️ Retail traders are heavily short, providing a contrarian bullish signal.
📈 Conclusion
The medium-term bias remains bullish on EURAUD, with potential upside extension toward 1.7920, and possibly 1.8050 if macro momentum persists.
The key support to defend lies at 1.7600 / 1.7550.
A daily close below this level would invalidate the bullish scenario and reopen the path toward 1.7400.
