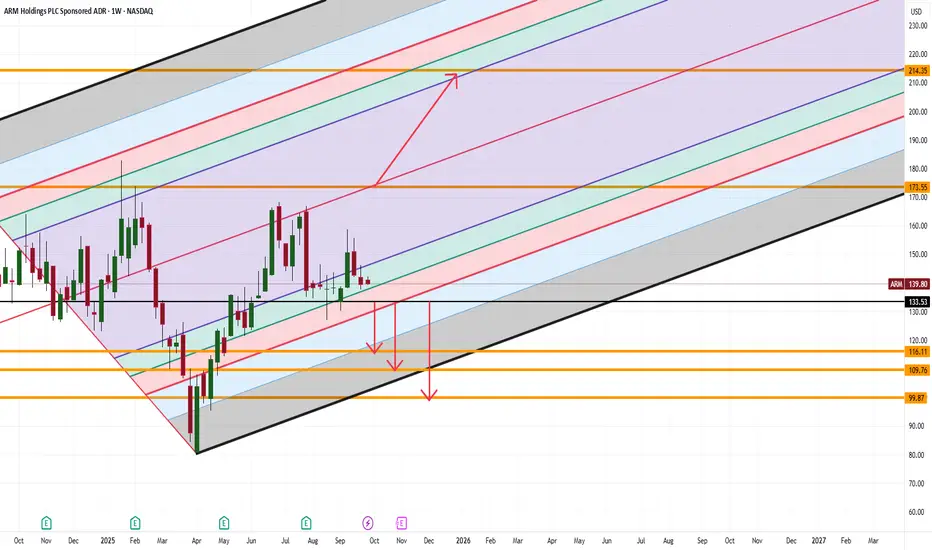
ARM Traders Won’t Like This SetupARM Holdings is sitting at a pivotal zone, and the next move could be brutal for one side of the market.
-If $133.53 breaks, momentum opens a slide toward $116, then $109, with $99 lurking as the deeper target.
-But if price can reclaim $173, the stage is set for a rally toward $213.
Here’s what makes this fascinating: most traders get tunnel vision on the current chop… while the real story is how violent ARM tends to move once it clears a range.
👉 The question isn’t if it moves, it’s which side gets trapped first.
How are you preparing for either outcome?
Semiconductors
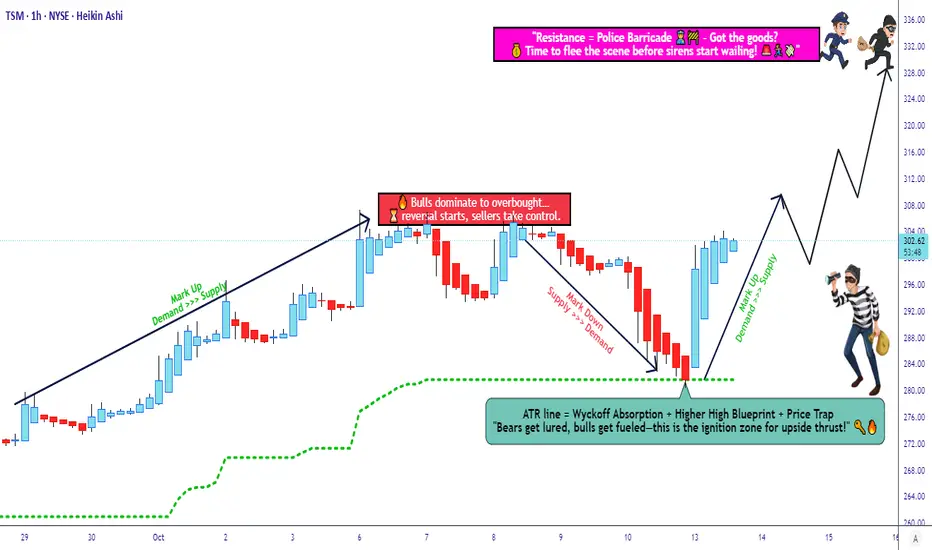
TSM Trade Setup — Strategic Entries and Risk Control🏦 TSM — “The Chip Heist: Thief Layers Up for the Big Loot” 💎
🎯 Market Setup:
TSM (Taiwan Semiconductor Mfg. Co., Ltd) is showing a bullish setup after a potential retest at the ATR line. The ATR retest will confirm buyer strength before momentum kicks in.
💰 Thief’s Master Plan (Layer Entry Tactics)
We scale in like a disciplined thief stacking gold bars:
Buy Limit 1 → 288
Buy Limit 2 → 292
Buy Limit 3 → 296
Buy Limit 4 → 300
(You can add more layers depending on your plan and risk appetite.)
🕵️♂️ Each layer reduces average entry cost and catches dips before the next move.
🧨 Stop-Loss Protocol:
Thief’s SL → 280
⚠️ This is my personal stop. Set your own stop according to your risk tolerance.
💎 Profit Extraction Zone (Target):
Target → 330 (Police Barricade / resistance zone + potential overbought trap)
Lock profits before the “trap” — that’s where pros exit quietly. 🚔💨
🧠 Key Cross-Market Links (For Confirmation)
Watch correlated tickers for better trade context:
NASDAQ:ASML → European semiconductor momentum
NASDAQ:NVDA → US chip leader, sentiment gauge
$SOX.X → Philadelphia Semiconductor Index, sector strength
NASDAQ:TSLA → Proxy for chip demand (AI + EV)
If NVDA and SOX are strong, TSM retest is likely to succeed. If they stall, be cautious.
📊 Trade Summary (Normal Format)
Confirmation: Retest at ATR line (momentum check)
Entry Plan: Layer buys at 288 / 292 / 296 / 300
Stop: 280 (adjust as needed)
Target: 330 resistance zone
Risk/Reward: Approx. 1:2.5+ depending on execution
💬 Side Note (For Thief OGs Only)
Not financial advice. We rob liquidity, not peace of mind. 😎
Trade it your way, manage risk, and protect your capital — that’s the real treasure.
✨ “If you find value in my analysis, a 👍 and 🚀 boost is much appreciated — it helps me share more setups with the community!”
⚠️ Disclaimer: This is a Thief-style trading strategy shared just for fun. Trade responsibly and DYOR before entry.
#TSM #Semiconductors #SwingTrading #DayTrading #TradingStrategy #StockMarket #BullishSetup #TradingView #ThiefTrader #LiquidityHunt #ATRstrategy #SmartMoneyConcepts #LayerEntry
SMH ETF Power Move Incoming – ATR Confirms Bullish Momentum!🎯 SMH Semiconductor Heist: Bulls Loading Up! 💎🚀
📊 Asset Analysis
VanEck Semiconductor ETF (SMH) - The chip sector's flagship ETF is showing serious strength after bouncing off the ATR (Average True Range) support zone. Bulls are flexing their muscles, and momentum is building for an upside breakout. Time to plan your entry like a pro! 🧠💰
🔥 Trade Setup: The "Layered Thief" Entry Strategy
Bias: BULLISH 🐂
Strategy: Multi-layered limit order entries (maximize your position while managing risk)
🎯 Entry Zones (Layer Your Orders):
Deploy multiple buy limit orders across these price levels to build your position strategically:
Layer 1: $328
Layer 2: $332
Layer 3: $336
Layer 4: $340
Note: You can add more layers based on your capital allocation and risk tolerance. The goal is to average into the position as price consolidates before the breakout.
🛑 Risk Management
Stop Loss: $324
This level invalidates the bullish setup if breached. The ATR support zone should hold — if it doesn't, we're outta here!
⚠️ Risk Disclosure: This stop loss level is based on my analysis. However, YOU are the captain of your own ship! Adjust your risk parameters according to your account size and risk appetite. Trade smart, not reckless! 🧠
🎯 Target Zones
Primary Target: $364 (Take Profits Here!) 💰
Maximum Target: $368 (Resistance Zone/Overbought Alert) ⚠️
At $368, we're approaching a major resistance level where profit-taking, overbought conditions, and potential bull traps converge. It's the "police barricade" 🚨 — smart thieves know when to escape with the loot! Secure your gains before hitting this ceiling.
⚠️ Profit-Taking Disclosure: These are MY target levels based on technical analysis. Your profit targets should align with YOUR trading plan and risk-reward preferences. Take money when YOU feel comfortable — it's your capital, your rules! 💼
🔗 Correlated Assets to Watch
Keep an eye on these related tickers for confirmation and broader market context:
NASDAQ:SOXX - iShares Semiconductor ETF (direct sector peer)
NASDAQ:NVDA - NVIDIA (semiconductor heavyweight, major SMH component)
NASDAQ:AMD - Advanced Micro Devices (chip sector bellwether)
NYSE:TSM - Taiwan Semiconductor (global chip manufacturing leader)
NASDAQ:AVGO - Broadcom (diversified semiconductor play)
NASDAQ:QQQM / QQQ - Nasdaq 100 ETFs (tech sector correlation)
📈 Why it matters: SMH trades in sync with these assets. If they're showing strength, it confirms the bullish thesis. If they're weak, proceed with extra caution!
📈 Technical Confluence
✅ ATR support zone holding strong
✅ Bulls regaining control after retracement
✅ Volume accumulation at support levels
✅ Risk-reward ratio favors the bulls (SL: $324 → Target: $364 = solid R:R)
The technical stars are aligning for a bullish continuation move! 🌟
🎓 Trading Wisdom
This setup combines patience (layered entries), discipline (defined stop loss), and realistic expectations (conservative profit targets). The semiconductor sector is volatile but rewarding when you trade with a plan! 💼📊
✨ If you find value in my analysis, a 👍 and 🚀 boost is much appreciated — it helps me share more setups with the community!
⚠️ Disclaimer
This analysis represents the "Thief Style Trading Strategy" — a playful approach to technical analysis meant for educational and entertainment purposes only. This is NOT financial advice. Trading involves substantial risk of loss. Always conduct your own research, manage your risk appropriately, and never trade with money you can't afford to lose. Past performance does not guarantee future results. Trade at your own risk! 🎲
#SMH #Semiconductors #SwingTrading #DayTrading #TechnicalAnalysis #NVDA #AMD #ChipStocks #TradingSetup #StockMarket #BullishSetup #LayeredEntry #RiskManagement #TradingStrategy #VanEckETF #TechStocks #MarketAnalysis #TradingIdeas #PriceAction

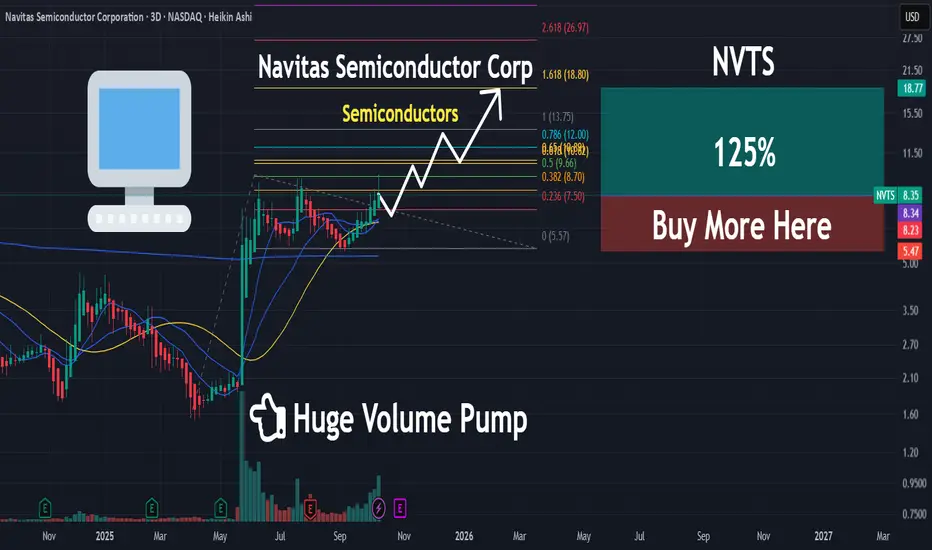
NVTS | The Next Semi To Run HARD | LONGNavitas Semiconductor Corp. engages in the development of ultra-efficient gallium nitride (GaN) semiconductors. Its GaN power ICs integrate GaN power with drive, control and protection to enable charging, power density, and energy savings for mobile, consumer, enterprise, eMobility and new energy markets. The company was founded by Daniel Kinzer, Nick Fichtenbaum, Gene Sheridan, and Jason Zhang on August 12, 2020 and is headquartered in Torrance, CA.
Can Light Truly Power the Future of AI?The exponential rise of artificial intelligence has exposed the physical limits of traditional electronic infrastructure. Electrical interconnects, once the backbone of computation, now struggle under escalating data demands, generating immense heat and power inefficiency. POET Technologies emerges as a transformative force in this landscape, leveraging its Optical Interposer™ platform to integrate electronic and photonic components at the wafer level. This innovation enables data speeds of 800G to 1.6T, meeting the insatiable bandwidth needs of AI clusters and hyperscale data centers while drastically reducing energy consumption.
At the core of POET’s advantage lies its patented low-thermal budget process, which allows photonic integration without the costly, high-temperature methods typical of semiconductor manufacturing. This approach not only minimizes thermal mismatches and signal losses but also aligns perfectly with existing CMOS foundry infrastructure—forming the foundation of an “asset-light” business model. By licensing its process and forming strategic joint ventures, POET scales efficiently without massive capital expenditure. Its collaborations with Foxconn and Semtech validate the platform’s industrial readiness, while a $75 million private placement strengthens its financial capacity to accelerate research, acquisitions, and manufacturing partnerships.
Beyond technology, POET’s innovations carry profound geopolitical and environmental implications. As nations race to secure semiconductor independence and energy resilience, POET’s energy-efficient, domestically manufacturable photonics become a critical strategic asset. Optical interconnects can cut data center power consumption by up to half, directly addressing mounting sustainability and national security concerns tied to AI’s energy footprint. Moreover, photonic architectures inherently enhance cybersecurity by offering interference-resistant, ultra-low-latency communication essential for distributed AI and defense systems.
In essence, POET Technologies transcends the definition of a semiconductor company; it represents the physical infrastructure upon which the next phase of artificial intelligence, digital sovereignty, and global energy stability may rest. By turning light into the new language of computation, POET positions itself not merely as a market participant but as an indispensable enabler of AI’s sustainable and secure future.

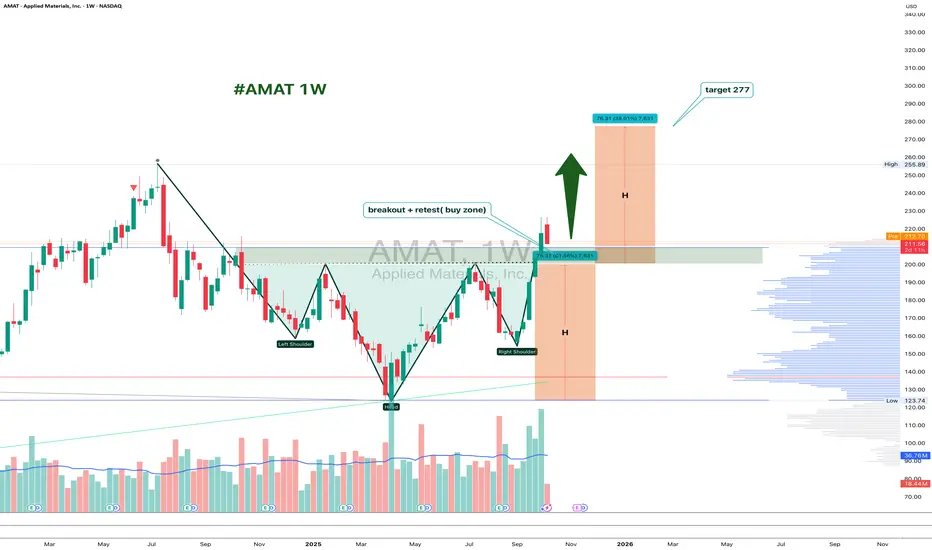
AMAT 1W: Retesting the Neckline Before the Next Move?On the weekly chart, Applied Materials (AMAT) has completed a clean inverted head and shoulders breakout around $226, and is now pulling back to retest the neckline zone near $200–211.
This area acts as strong support. If buyers defend it, the bullish pattern stays valid, with a projected target around $277, matching the 1.618 Fibonacci extension.
From a fundamental perspective, AMAT remains a key semiconductor player, benefiting from ongoing demand for chip-making equipment. The pullback looks more like a healthy pause than weakness - a classic chance for latecomers to re-enter.
Funny enough, the “head and shoulders” pattern, known for signaling tops, is doing the exact opposite here - apparently, even the market likes a good plot twist.
Bullish Thesis: Why AMD Stock Could Soar by Year-End 2025If you haven`t bought AMD before the previous rally:
What to consider now:
1. AI Tailwinds Are Accelerating
AMD is finally gaining serious traction in the AI GPU race. Its MI300X accelerator chips are being adopted by big names like Microsoft, Meta, and Oracle for data center AI workloads. While NVIDIA is still dominant, AMD is expected to grab 10–20% of the AI GPU market share by 2025, according to industry estimates. That’s a multibillion-dollar opportunity.
The MI300X already passed $1B in revenue within its first quarters.
AI server TAM (total addressable market) is expected to grow to $400B by 2027 — AMD is positioning itself aggressively to carve out its slice.
2. Valuation Looks Reasonable vs Peers
AMD trades at a forward P/E around 40, significantly below Nvidia (which trades over 60x) despite similar growth projections for the next 2 years.
Revenue expected to grow over 15–20% YoY in 2025.
Gross margins expanding as high-performance chips dominate the mix.
3. Diversified Growth: Beyond AI
Gaming segment (PlayStation 5 and Xbox Series X chips) remains strong.
Embedded segment from Xilinx acquisition continues to generate solid cash flow.
Client CPU business is rebounding as the PC market stabilizes.
4. Strong Management and Execution
CEO Lisa Su is widely respected for turning AMD around and guiding the company through major innovations and acquisitions (Xilinx, Pensando). Execution has remained consistent, especially in delivering cutting-edge performance-per-watt chips.
Disclosure: I am part of Trade Nation's Influencer program and receive a monthly fee for using their TradingView charts in my analysis.

Advanced Micro Devices | AMD | Long at $126.00Advanced Micro Devices NASDAQ:AMD may be the sleeping giant in the semiconductor / AI space. While all eyes on NVidia NASDAQ:NVDA , earnings for NASDAQ:AMD grew by 800% over the past year... and are now forecast to grow 40% per year. Any other company would be soaring right now (like NVidia), but that company is getting all the attention. And, to me, this means opportunity for the future. The cashflow is likely to grow tremendously for
NASDAQ:AMD into 2027 and beyond, which may inevitably reward investors with dividends.
From a technical analysis perspective, NASDAQ:AMD just entered my historical simple moving average zone. This area (currently $108-$126) is where I will be gathering shares. Something tremendous would have to change regarding the fundamentals of this company (like a scandal) for the overall thesis to change. There may be some near-term price pains as NVidia gets all the focus, but to meet demand in the semiconductor and AI space, NASDAQ:AMD is poised to fulfill that roll in the future.
Target #1 = $158.00
Target #2 = $175.00
Target #3 = $188.00
Target #4 = $205.00

MPWR 1D: shoulders are squared and the battery's still fullMonolithic Power Systems broke out of a long-term descending trendline after completing a clean inverse head and shoulders. Now the price is pulling back into the 705–688 zone — a textbook retest area that combines the neckline, the 0.705–0.79 Fib levels, and a major volume shelf. Add to that a golden cross (EMA50 crossing EMA200 from below) and we have a solid technical foundation for continuation. Volume on the pullback is low, indicating no panic, just rotation. If 688 holds, the next levels to watch are 755.66 and 952.17 — the latter being the 1.618 Fib extension. Tactical setup: look for a reversal signal between 705–688, with a stop just below 661. As long as price holds this zone, the bullish structure remains intact.
Fundamentally, MPWR remains one of the strongest names in the semiconductor space. With over $1.5B in annual revenue and industry-leading margins, the company continues to see strong demand from data center and EV sectors. In its latest report, management highlighted accelerating orders from Tier‑1 manufacturers. The balance sheet is clean, with zero debt, and ongoing buybacks provide downside support. In a sector full of volatility, MPWR stands out with both structural reliability and technical clarity - making it a strong candidate for long-term positioning.
If this textbook pattern plays out, the train’s just leaving the station. The best seat is usually the one taken before the doors close.

Direxion Semiconductor 3x Bull | SOXL | Long at $30.00So many semiconductor companies... which one to choose? Enter AMEX:SOXL - not for the faint of heart. Losses and gains triple compared to most semiconductor ETFs, so stay away if high-risk plays aren't your thing. The top three holdings are NASDAQ:AMD , NASDAQ:AVGO , and NASDAQ:NVDA - two of which are at all-time highs...
I wouldn't be shocked if AMEX:SOXL enters the low $20's to test the base of my historical simple moving average area, but I don't think we are done hearing about AI and the semi demand. There are large gaps to fill above and below the current price and we are at the 50/50 stage (i.e. historical simple moving average zone) for a price move up or down.
My bet is up, especially with the new presidential administration. If politicians start dumping semis, I'm out. Thus, at $30.00 AMEX:SOXL is in a personal buy zone.
Target #1 = $35
Target #2 = $40
Target #3 = $50
Target #4 = $60

ARM | The Next Semi to Move Higher | LONGArm Holdings Plc engages in the licensing, marketing, research, and development of microprocessors, systems IP, graphics processing units, physical IP and associated systems IP, software, and tools. It operates through the following geographical segments: United Kingdom, United States, and Other Countries. The company was founded on November 12, 1990 and is headquartered in Cambridge, the United Kingdom.
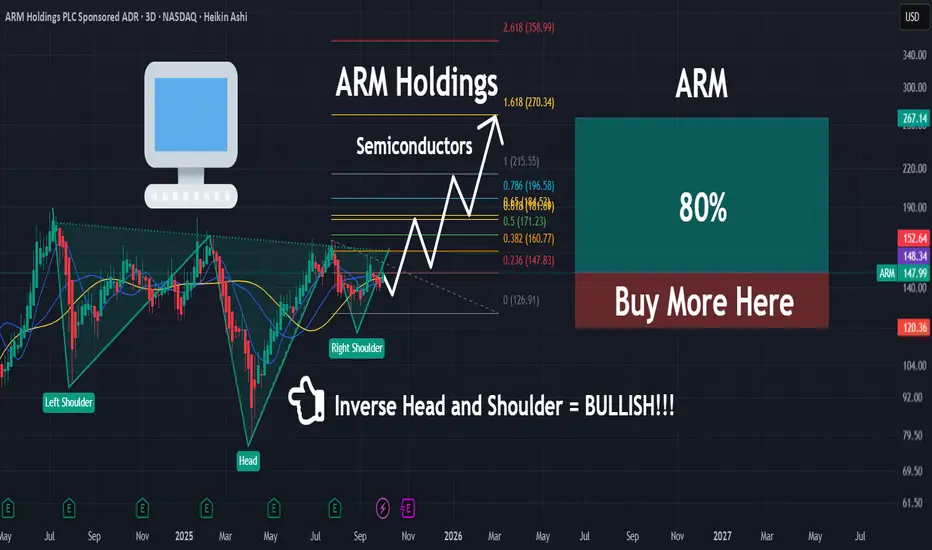
Arm Holdings (ARM): Bullish Outlook on Structural Growth ThemesArm Holdings NASDAQ:ARM is a semiconductor IP powerhouse driving innovation across AI, mobile, data centers, and IoT. With its high-performance, low-power chip architectures, Arm remains foundational to next-gen computing infrastructure.
🔍 Key Fundamentals:
Market Dominance: Arm holds a leading position in semiconductor IP, backed by deep R&D investment and expanding licensing with top global chipmakers.
Revenue Momentum: Recent earnings show strong revenue growth, underpinned by rising global demand for Arm-based designs.
AI & Cloud Pivot: Major cloud providers are rapidly adopting Arm-based server architectures, reflecting Arm’s shift into AI and enterprise computing.
IoT & Automotive Expansion: With increasing compute needs in vehicles and smart devices, Arm’s low-power design edge is unlocking new growth verticals.
📈 Technical Perspective:
We're bullish above the $120.00–$122.00 zone, with an upside target of $270.00–$275.00 based on structural demand growth and strategic diversification.
#ARM #ArmHoldings #Semiconductors #AIStocks #TechStocks #IoT #CloudComputing #ChipStocks #NVIDIA #DataCenter #BullishBreakout

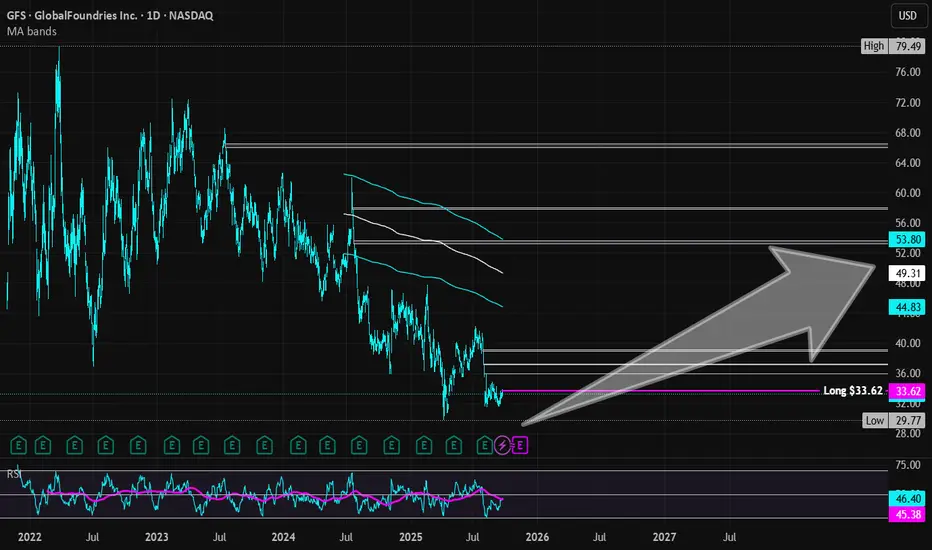
GlobalFoundaries | GFS | Long $33.62GlobalFoundaries NASDAQ:GFS
Technical Analysis:
The price is currently trading below the historical mean (see lines on chart). Given the "newness" of this stock on the market (IPO in 2021), I would often avoid an entry here until more data are gathered to better understand if the downside trend is reversing. However, in an era where AI integration is the future of tech, the growth prospects of NASDAQ:GFS make it undervalued in the semiconductor space. The current fair value is near $20. The price may get there in the near-term. But sometimes future fundamentals outweigh technical analysis... sometimes... Time will tell.
Earnings and Revenue Growth
Forecasted revenue growth between 2025 ($6.75 billion) and 2028 ($8.88 billion): 31.6%
Forecasted earnings-per-share growth between 2025 ($1.62) and 2028 ($3.12): 92.6%
www.tradingview.com
Health
Debt-to-Equity: 0.15x (low, healthy)
Altman's Z-Score/Bankruptcy Risk: 2.48 (low risk)
Insiders
Silent...
openinsider.com
Action
Due to the growth prospects and likely high demand of semiconductors, NASDAQ:GFS is in a personal buy zone at $33.62. This entry goes against some technical analysis guidance (more downside may be inevitable this year), but the *long-term* upside is more than likely there *if* earnings and revenue growth projections are accurate beyond 2025.
Targets in 2028
$39.00 (+16.0%)
$50.00 (+48.7%)
SMH Bullish Setup – Breakout Plan for the Perfect Heist!🔥🚀 THIEF TRADER ALERT: SMH BULLISH HEIST PLAN! 🚀🔥
Asset: VANECK SEMICONDUCTOR ETF (SMH)
Plan: BULLISH BREAKOUT HEIST 🎯 (Resistance wall breakout candle close above 298.00)
🎯 THIEF ENTRY STRATEGY (LAYERING METHOD) 🎯
"Steal the dip like a PRO!" 💰🔪
Multiple Limit Orders (Layer Entry) 👇
1st Layer: 298.00 (Breakout Confirmation)
2nd Layer: 292.00 (Pullback Steal)
3rd Layer: 288.00 (Aggressive Discount)
4th Layer: 284.00 (Max Pain = Max Gain)
(Add more layers if you’re a risk-loving THIEF!)
⚠️ WARNING: DO NOT place SL or orders before breakout! (Only real THIEFS wait for confirmation!)
🛑 THIEF STOP LOSS (OG STYLE) 🛑
"Protect your loot or get wrecked!" 💣
SL @ 280.00 (Hard floor – adjust based on your risk appetite!)
Place SL ONLY AFTER breakout! (No premature stops – patience = profit!)
🎯 TARGET: 324.00 🚀 (OR ESCAPE EARLY IF MARKET TURNS)
Scalpers: Ride the waves, but stay LONG ONLY! 🌊
Swing Thieves: Hold & rob big! Use Trailing SL to lock gains! 🔐💰
📢 THIEF PRO TIPS:
✅ Set Alerts! (Don’t miss the breakout!) 🔔
✅ Watch for News! (Avoid getting caught in volatility traps!) 📉📈
✅ Boost & Support! (More boosts = more heists!) 💖🚀
🔥 FINAL MESSAGE:
"The market is a casino, and WE are the robbers! 🎰💰 Steal smart, escape rich! 🏴☠️💸"
👉 LIKE, BOOST & FOLLOW FOR MORE HEIST PLANS! 👈
🚀 NEXT HEIST COMING SOON… STAY TUNED! 🚀
#ThiefTrader #SMH #BreakoutHeist #LayerEntry #LimitOrderBandit 🎯🔥

Texas Instruments: Rebound Underway, But Downside Still in PlayTexas Instruments initially continued its decline but has recently shown early signs of a rebound. Nonetheless, we still see greater downside potential in magenta wave (3), and expect the broader bearish magenta impulse to ultimately extend into the beige zone between $130.04 and $107.75. Should a new (corrective) high occur in green wave alt. above $221.79, it could temporarily postpone the anticipated sell-off. However, even in this 30% likely scenario, price would likely reverse no later than at the higher resistance level at $240.67.

Intel | INTC | Long at $20This is going to be purely about technical analysis since Intel NASDAQ:INTC has a 90x P/E and has not proven themselves to be a viable challenger in the semiconductor market (yet...). Bad news could continue to destroy this ticker, but without that news, there could be some recovery in the near term.
The NASDAQ:INTC chart is in an overall downward trend. However, based on a few of my selected simply moving averages (SMAs), there is some predictability around support/resistance areas. Some of my favorite setups are a nice bounce on the lowest (green) selected SMA, occurring in October 2022 for a "rip then dip" to the second lowest (blue) - which it hit now. Often, but not always (I can't stress this enough), this green to blue SMA bounce represents a very strong support area during a downward trend. The other move is a further dip to retest the green SMA, but I suspect that would come with tremendously bad news for Intel... let's hope not, though.
Currently, NASDAQ:INTC is in a personal buy zone at $20.00 based on technical analysis only. A stop has been set if it drops below the blue SMA (which is may further test).
Target #1 = $28.00
Target #2 = $32.00
Target #3 = $60.00+ (very long-term, but high-risk unless fundamentals change)

Monolithic Power | MPWR | Long at $580.00Monolithic Power $NASDAQ:MPWR. If the semiconductor market continues to get attention in connection with AI, there may be a bounce here near $580.00 as NASDAQ:MPWR enters my historical simple moving average area. However, a further dip into the high $400s wouldn't surprise me (tax harvesting season is in session) and doesn't change the thesis as long as the overall trend continues to stay positive. While NASDAQ:MPWR is a strong company with growth predictions on the horizon, it has a 65x P/E, 46x price-to-cash flow, lots of insider selling, and some near-term concern if the economy shows weakness. From a technical analysis perspective, though, it's in an area of opportunity as long as semis stay a "hot" investment. Thus, at $580.00, NASDAQ:MPWR is in a personal buy zone.
Target #1 = $690.00
Target #2 = $745.00
Target #3 = $825.00
Target #4 = $908.00

SOXL 1D — With a base like this, the ride’s worth itOn the daily chart of SOXL, since early March, a textbook inverse head and shoulders pattern has formed and is now in its activation phase. The left shoulder sits at $16.67, the head at $7.21, and the right shoulder at $15.11. The symmetry is classic, with volume stabilization and a narrowing range — all the elements are in place.
The key moment was the breakout through the descending daily trendline around $19.00. Price didn’t just pierce the level — it held above it, signaling a phase shift. There was an attempt to break through the 0.5 Fibonacci level at $19.60, which led to a pullback — not on heavy selling, but on decreasing volume. This wasn’t a rejection, it was a pause.
This pullback serves as a retest of the breakout zone and the 20-day moving average. The overall structure remains bullish: price stays above all key EMAs and MAs, RSI climbs past 60, and the candlestick structure is stable. Volume rises during up moves and fades during pullbacks — classic signs of reaccumulation.
The measured target from the pattern is $32.00, calculated from the head-to-neckline height projected from the breakout point. As long as price holds above $18.40, the setup remains intact. A break above $19.60 with confirmation would open the door to acceleration.
This isn’t a momentum play — it’s a setup months in the making. The structure is there, the confirmation is there, and most importantly — the price behavior makes sense. With a base like this, the ride ahead looks worth taking.

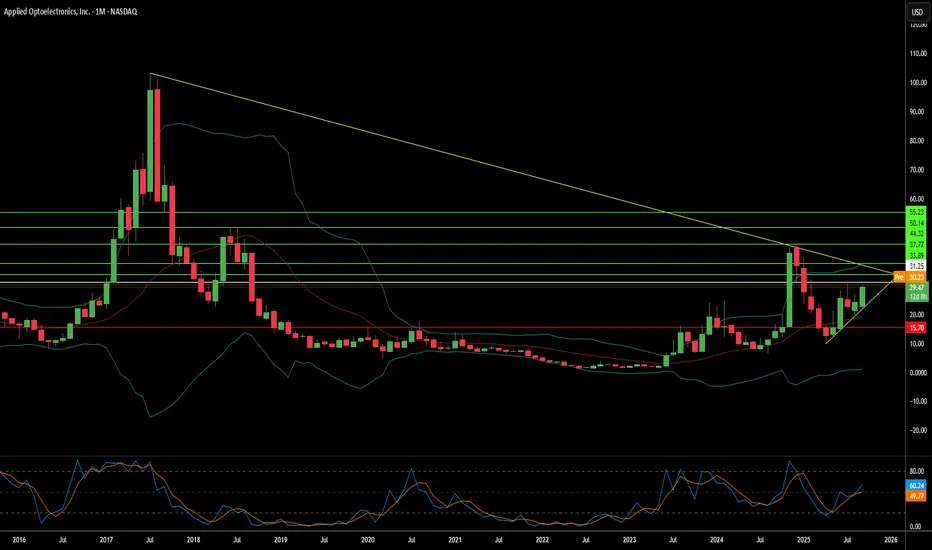
Can a Small-Cap Survive the AI Data Revolution?Applied Optoelectronics (AAOI) represents a high-stakes investment proposition at the intersection of artificial intelligence infrastructure and geopolitical supply chain realignment. The small-cap optical networking company has positioned itself as a vertically integrated manufacturer of advanced optical transceivers, leveraging proprietary laser technology to serve hyperscale data centers, driving the AI boom. With 77.94% year-over-year revenue growth reaching $368.23 million in FY 2024, AAOI has successfully re-engaged a major hyperscale customer and begun shipping 400G datacenter transceivers, marking a potential turnaround from its 2017 customer loss that previously crushed its stock performance.
The company's strategic pivot centers on transitioning from lower-margin products to high-performance 800G and 1.6T transceivers while simultaneously relocating manufacturing capacity from China to Taiwan and the United States. This supply chain realignment, formalized through a 15-year lease for a New Taipei City facility signed in September 2025, positions AAOI to benefit from domestic sourcing preferences and potential government incentives like the CHIPS Act. The optical transceiver market, valued at $13.6 billion in 2024 and projected to reach $25 billion by 2029, is driven by substantial tailwinds, including AI workloads, 5G deployment, and hyperscale data center expansion.
However, AAOI's financial foundation remains precarious despite impressive revenue growth. The company reported a net loss of $155.72 million in 2024 and carries over $211 million in debt while facing ongoing share dilution from equity offerings that increased outstanding shares from 25 million to 62 million. Customer concentration risk persists as a fundamental vulnerability, with data centers representing 79.39% of revenue. External scrutiny has questioned the viability of the Taiwan expansion, with some reports characterizing the 800G production story as an "optical illusion" and raising concerns about the readiness of manufacturing facilities.
The investment thesis ultimately hinges on execution risk and competitive positioning in a rapidly evolving technology landscape. While AAOI's vertical integration and proprietary laser technology provide differentiation against giants like Broadcom and Lumentum, emerging co-packaged optics (CPO) technology threatens to disrupt traditional pluggable transceivers. The company's success depends on successfully ramping 800G production, operationalizing the Taiwan facility, achieving consistent profitability, and maintaining its re-engaged hyperscale customer relationships. For investors, AAOI represents a classic high-risk, high-reward opportunity, where strategic execution could deliver significant returns; however, financial vulnerabilities and operational challenges present substantial downside risks.
QCOM | Consolidation Almost Done | LONGQUALCOMM, Inc. engages in developing and commercializing foundational technologies and products used in mobile devices and other wireless products. It operates through the following segments: Qualcomm CDMA Technologies (QCT), Qualcomm Technology Licensing (QTL), and Qualcomm Strategic Initiatives (QSI). The QCT segment develops and supplies integrated circuits and system software based on technologies for use in voice and data communications, networking, application processing, multimedia, and global positioning system products. The QTL segment grants licenses and provides rights to use portions of the firm's intellectual property portfolio. The QSI segment focuses on opening new or expanding opportunities for its technologies and supporting the design and introduction of new products and services for voice and data communications. The company was founded by Franklin P. Antonio, Adelia A. Coffman, Andrew Cohen, Klein Gilhousen, Irwin Mark Jacobs, Andrew J. Viterbi, and Harvey P. White in July 1985 and is headquartered in San Diego, CA.

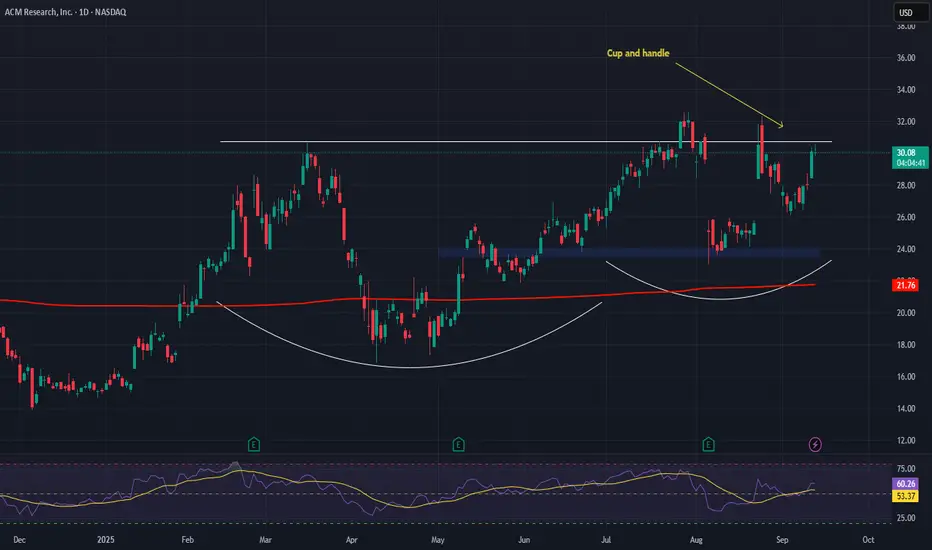
ACM Research (ACMR) —Expanding Share in China’s $35B Semi MarketCompany Overview:
ACM Research, Inc. NASDAQ:ACMR develops advanced wet cleaning and process tools that enhance chip fabrication yields, offering exposure to the fast-growing semiconductor equipment sector.
Key Catalysts:
China localization tailwinds: ACMR currently holds ~14% market share in China’s $35B wafer equipment market, with potential to reach 25% by 2030.
Technology leadership: The upgraded Ultra Cwb cleaning tool improves chip production efficiency, driving both revenue growth and margin expansion.
Scalability & supply chain control: Ongoing capacity growth at the Lingang facility strengthens operational scale and competitive positioning.
Investment Outlook:
Bullish above: $23.50–$24.00
Upside target: $50.00–$52.00, backed by China demand, tech upgrades, and facility expansion.
#ACMR #Semiconductors #ChinaTech #Chipmaking #Localization #TechGrowth #Investing
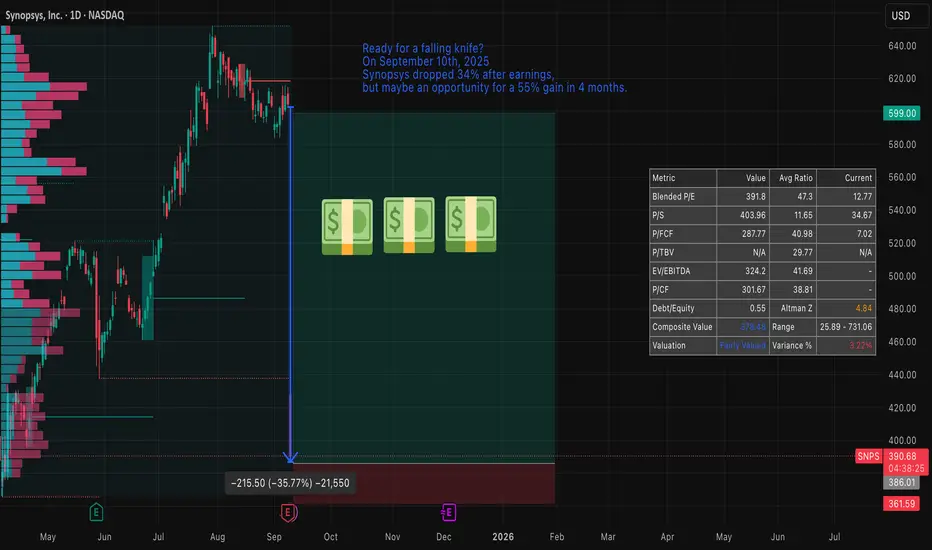
Synopsys — a sharp sell-off, risky entry and clear opportunitySynopsys plunged roughly 30–34% on 10 September 2025, wiping out a large chunk of market value after quarterly results missed expectations and guidance was cut. That kind of move often feels like a “falling knife”: attractive on paper, dangerous in practice.
Price action and technical context
The stock has gapped lower and left a sizeable down-gap to fill. From a technical viewpoint the setup resembles a fast, impulsive sell-off inside a broader downtrend established since the spring; price is now testing levels that were former support in April 2025. Short-term momentum indicators show oversold readings, but volatility is elevated and trend-following measures still favour the downside until a reliable base is formed.
Key technical reference points to watch:
Gap zone/topside resistance: around the pre-drop range near the mid-$600s.
Immediate support / stop placement: just below the April 2025 lows (your stated stop).
Possible gap-fill target: if the market rotates back, reclaiming the gap by January 2026 implies roughly a ~55% upside from current depressed levels (as you noted).
Fundamentals and why this remains an opportunity
Despite the headline shock, Synopsys’s underlying business remains high-quality:
Market-leading positions in EDA tools and IP libraries.
Strong, recurring revenue mix (software subscriptions and maintenance).
Long secular tailwinds from AI, advanced node design and chiplet modularity.
Valuation has re-rated materially after the drop — the company is no longer priced at the frothy multiples of earlier in the cycle. Analysts have revised estimates downward but many still target stock levels clustered around $600, reflecting belief in recovery by late 2025 / early 2026.
Options flow and timing
There is notable open interest concentration in both calls and puts around the $600 strike with expiries in December 2025 and January 2026. That concentration suggests the market expects meaningful activity/interest around that level into the winter and gives a window where a gap-fill or relief rally could materialize before January expiries.
Risk management and trade plan
Trade type: speculative rebound / gap-fill play, not a buy-and-forget investment.
Target: gap-fill / recovery toward pre-drop levels by January 2026 — roughly +55% potential from current depressed price (per your scenario).
Stop: just below April 2025 lows (limits downside if the downtrend resumes).
Position sizing: small relative to portfolio — treat as a high-volatility, event-driven trade.
Alternatives: consider defined-risk option structures (e.g., debit spreads) to cap downside while retaining upside exposure to a gap fill.
Catalysts to monitor
Any updates to guidance or profitability from Synopsys management.
China demand/FX developments and IP licensing commentary.
Options positioning into December 2025 / January 2026 expiries.
Broader semiconductor capital spending and AI-related design win announcements.
Technical indicators to watch
200DMA and April lows (support/resistance anchors).
RSI(14) and MACD for bullish divergence and momentum confirmation.
Volume on any recovery day — strong volume on up days increases odds of a sustained bounce.
Bottom line
This is a high-risk, high-reward setup: a classic “ falling knife ” that can be dangerous if you’re early, but presents a credible opportunity because Synopsys’s fundamentals remain solid, valuation is more attractive, and market positioning (options interest near $600) favors a potential recovery window through January 2026. Use tight risk controls (stop under April lows) and consider defined-risk option plays if you prefer limited downside.
TSMC: AI Chip Titan – Still the King or Facing New Challengers?Good morning, everyone! ☀️ TSMC: AI Chip Titan – Still the King or Facing New Challengers?
(1/9)
TSMC’s riding the AI wave with record Q4 2024 profits, but with U.S.-China curbs and fab delays, is this semiconductor king untouchable or at a crossroads? Let’s unpack it! 🔍
(2/9) – PRICE PERFORMANCE 📊
• Q4 2024: Net income up 57% to $11.4B, revenue climbed 39% 💰
• Full Year 2024: Revenue hit $87.1B, up 34% from 2023 📏
• Sector Trend: AI chip demand soaring, per Reuters 🌟
It’s a powerhouse, driven by tech’s hunger! ⚙️
(3/9) – MARKET POSITION 📈
• Market Share: Over 60% of global foundry market 🏆
• Clients: Apple, Nvidia, AMD—big names rely on ‘em ⏰
• Trend: Expanding fabs in U.S., Japan, Germany 🎯
Firm, holding the throne but not without battles! 🚀
(4/9) – KEY DEVELOPMENTS 🔑
• Q4 Earnings: Record $11.4B profit, per Jan 16 Reuters 🔄
• Expansion: Arizona fab faces delays, full ops by 2027? 🌍
• Market Reaction: Shares up 81% in 2024, still strong 📋
Adapting, with global eyes on its moves! 💡
(5/9) – RISKS IN FOCUS ⚡
• Geopolitics: U.S.-China export curbs hit demand 🔍
• Costs: U.S. fab chips 50% pricier than Taiwan 📉
• Talent: Lack of skilled U.S. workers slows growth ❄️
Tough, but risks loom large! 🛑
(6/9) – SWOT: STRENGTHS 💪
• Profit Surge: 57% net income jump in Q4 2024 🥇
• Tech Lead: 5nm mass production, 3nm in R&D 📊
• Client Base: Powers Apple, Nvidia, more 🔧
Got silicon in the tank! 🏦
(7/9) – SWOT: WEAKNESSES & OPPORTUNITIES ⚖️
• Weaknesses: High U.S. fab costs, talent gaps 📉
• Opportunities: AI chip demand, new fabs in Japan, EU 📈
Can it keep the lead amid global shifts? 🤔
(8/9) – 📢TSMC’s Q4 profit up 57%, AI booming, your take? 🗳️
• Bullish: Still the king, long-term winner 🐂
• Neutral: Steady, but risks weigh ⚖️
• Bearish: Curbs and costs slow growth 🐻
Chime in below! 👇
(9/9) – FINAL TAKEAWAY 🎯
TSMC’s record profits signal AI dominance 📈, but U.S.-China curbs and fab delays add caution 🌿. Volatility’s our friend—dips are DCA gold 💰. Grab ‘em low, climb like pros! Gem or bust?
