HBARUSDT: Ready for the Next Bull Run to 0.27430!The HBARUSDT market is looking incredibly bullish! We've just seen a strong shift from a downtrend to an uptrend, creating a perfect opportunity to go long.
The price has broken through a key resistance level, then pulled back to retest it – a textbook breakout & retest setup. This highlights the strength of the bullish momentum.
Now, with the price rejecting that level and turning it into new support, this is a strong long signal with the next target in sight!
My target is 0.27430. Let’s get ready for the next move!
Short


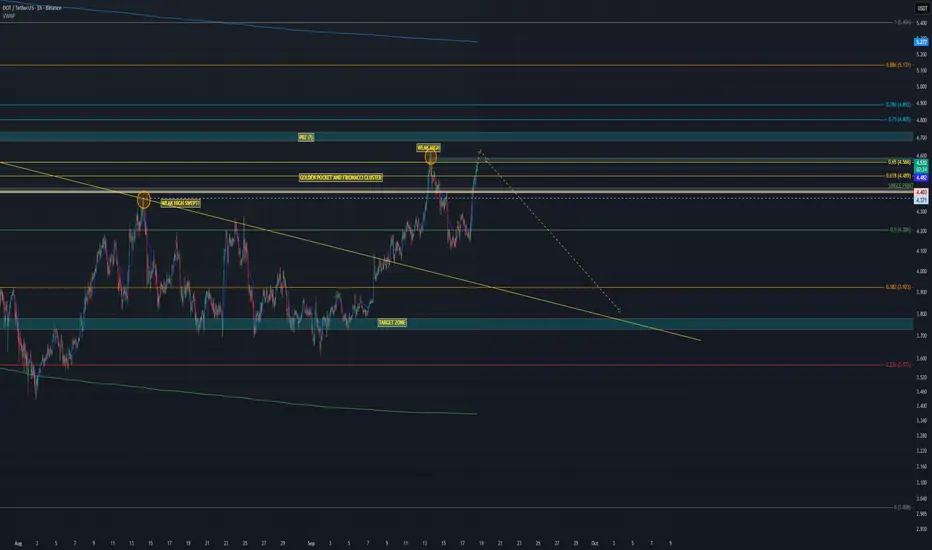
WHAT GOES UP, MUST COME DOWN – $DOT DUMP TIME?In my last analysis we nailed the move: CRYPTOCAP:DOT pumped to sweep the weak 14 Aug high exactly as projected. ✅ That mission is complete – now it’s time for the other side of the trade.
Analysis
14 Aug high swept → equilibrium reached.
Price in HTF Golden Pocket + strong Fib cluster.
Bearish harmonic + hidden bear div on CVD.
Orderflow: longs piling in, OI ↑ but price stuck → squeeze risk.
Likely SFP around $4.65 (take out Sept 13 high) → then dump.
First target: $3.75.
$LINK – PREMIUM PUMP, DISCOUNT DUMP? THE SQUEEZE SETUP EXPLAINEDLINK – PREMIUM PUMP, DISCOUNT DUMP? THE SQUEEZE SETUP EXPLAINED
Traders,
LINK — and likely the broader crypto market — is setting up for a premium squeeze that turns into a discount dump.
ANALYSIS
On Binance Perpetuals you can see longs piling in near $24 while price stalls → CVD pushes up, price doesn’t. That’s buying with no progress = bearish absorption with CVD non-confirmation. Check the data here ibb.co
Aggregated Spot CVD (all exchanges) is flat. No real spot demand → only leveraged longs propping up price. Check the data here ibb.co
Price is now inside the Golden Pocket retracement zone. High-probability reaction area where strong hands fade late longers.
Measuring swing low → swing high (06 Sep – 13 Sep), price is right at the Value Area High (VAH). This is the edge of acceptance.
Confluence: we’re also tagging the upper Anchored VWAP band (green line) from both the swing high and the swing low.
→ Why this matters: Anchored VWAP tracks the average cost basis of participants from a chosen pivot. When the swing low → high AVWAP band and the swing high → low AVWAP band overlap in the same zone, it creates double confluence: longs from the bottom see this as “expensive” and reduce risk, while shorts from the top defend their break-even. Historically, these overlaps act as strong rejection zones unless fresh spot demand breaks through.
MY TAKE
Expecting rejection at $24 and a move back toward $21 (blue AVWAP test). I think - based on data - that we might move even lower.
Setup = trapped longs at premium + no spot demand + strong confluence of VAH, Golden Pocket, and dual AVWAP resistance.
Invalidation = acceptance above $25 with spot CVD joining the move.

USDJPY Under Pressure! SELL!
My dear friends,
My technical analysis for USDJPY is below:
The market is trading on 147.95 pivot level.
Bias - Bearish
Technical Indicators: Both Super Trend & Pivot HL indicate a highly probable USDJPY continuation.
Target - 147.30
About Used Indicators:
A pivot point is a technical analysis indicator, or calculations, used to determine the overall trend of the market over different time frames.
Disclosure: I am part of Trade Nation's Influencer program and receive a monthly fee for using their TradingView charts in my analysis.
———————————
WISH YOU ALL LUCK

Bitcoin Has Potential to Continue – Don’t Miss Out!Hello everyone, Ken here!
Let’s dive deeper into the current price action of Bitcoin.
As you can see, price is moving within a clear upward channel, signaling strong bullish momentum. After a sharp rise, the price has slightly pulled back to retest the broken resistance. This is a classic break and retest setup within a larger channel, a popular trading pattern I often use.
The key point here is that if this level holds as support, buyer confidence will be further solidified. And we’re already seeing that happen!
With this momentum, I believe 118,850 USDT is the next target, where the price could reverse depending on market reactions at that point.
Wishing you successful trades and a disciplined strategy!

GOLD BEARISH BIAS RIGHT NOW| SHORT
GOLD SIGNAL
Trade Direction: short
Entry Level: 3,653.06
Target Level: 3,487.88
Stop Loss: 3,762.88
RISK PROFILE
Risk level: medium
Suggested risk: 1%
Timeframe: 1D
Disclosure: I am part of Trade Nation's Influencer program and receive a monthly fee for using their TradingView charts in my analysis.
✅LIKE AND COMMENT MY IDEAS✅

AUD/JPY SHORT FROM RESISTANCE
Hello, Friends!
The BB upper band is nearby so AUD-JPY is in the overbought territory. Thus, despite the uptrend on the 1W timeframe I think that we will see a bearish reaction from the resistance line above and a move down towards the target at around 96.239.
Disclosure: I am part of Trade Nation's Influencer program and receive a monthly fee for using their TradingView charts in my analysis.
✅LIKE AND COMMENT MY IDEAS✅

EURGBP: Short Trade with Entry/SL/TP
EURGBP
- Classic bearish pattern
- Our team expects retracement
SUGGESTED TRADE:
Swing Trade
Sell EURGBP
Entry - 0.8697
Stop - 0.8704
Take - 0.8681
Our Risk - 1%
Start protection of your profits from lower levels
Disclosure: I am part of Trade Nation's Influencer program and receive a monthly fee for using their TradingView charts in my analysis.
❤️ Please, support our work with like & comment! ❤️

BITCOIN BEARS WILL DOMINATE THE MARKET|SHORT
BITCOIN SIGNAL
Trade Direction: short
Entry Level: 117,076.48
Target Level: 111,750.81
Stop Loss: 120,567.13
RISK PROFILE
Risk level: medium
Suggested risk: 1%
Timeframe: 1D
Disclosure: I am part of Trade Nation's Influencer program and receive a monthly fee for using their TradingView charts in my analysis.
✅LIKE AND COMMENT MY IDEAS✅

EURUSD: Correction will ContinuesHello everyone, here is my breakdown of the current Euro setup.
Market Analysis
From a broader perspective, we saw a significant bullish impulse on EURUSD after the price broke out of a multi-week upward wedge. This breakout carried the price well above the Support 1 level at 1.1780, culminating in a new local All-Time High before entering a corrective phase.
Following that peak, the market has pulled back and is now consolidating. Currently, it appears that the price is attempting to build support for another move higher, likely to re-challenge the recent highs.
My Scenario & Strategy
My scenario is a bearish one, built on the expectation of a failed retest of the recent ATH. I'm looking for the price to make one more push upwards towards the recent ATH. The key signal for this short idea would be a clear and strong rejection from that high, showing that buyers no longer have the strength to continue the trend.
Therefore, the strategy is to watch for this failure at the highs. A confirmed reversal would validate the short scenario. The primary target for the subsequent decline is the 1.1795 support zone, which aligns with the Support zone 1 area.
That's the setup I'm tracking. Thank you for your attention, and always manage your risk.

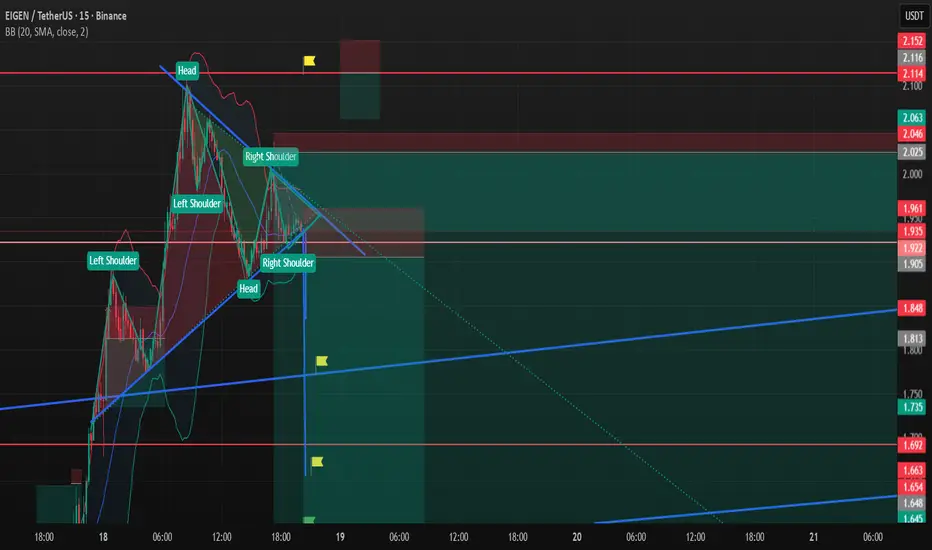
Eigen Short SetupI couldnt publish targets for the last idea it was in rush here I am for the second chart of the same position and also I added a new short position you can follow if you couldnt catch
There is both bullish and bearish head and shoulder formation I assume bearish version will work
Always manage your own risks this is not a investment advise I am not responsible neither your loss nor profit.
Targets
TP1 Blue trendline
TP2 1.658
TP3 1.590
EURCAD A Fall Expected! SELL!
My dear friends,
Please, find my technical outlook for EURCAD below:
The instrument tests an important psychological level 1.6289
Bias - Bearish
Technical Indicators: Supper Trend gives a precise Bearish signal, while Pivot Point HL predicts price changes and potential reversals in the market.
Target - 1.6257
About Used Indicators:
Super-trend indicator is more useful in trending markets where there are clear uptrends and downtrends in price.
Disclosure: I am part of Trade Nation's Influencer program and receive a monthly fee for using their TradingView charts in my analysis.
———————————
WISH YOU ALL LUCK

GOLD: Bearish Continuation & Short Signal
GOLD
- Classic bearish setup
- Our team expects bearish continuation
SUGGESTED TRADE:
Swing Trade
Short GOLD
Entry Point - 3667.1
Stop Loss - 3675.7
Take Profit - 3651.0
Our Risk - 1%
Start protection of your profits from lower levels
Disclosure: I am part of Trade Nation's Influencer program and receive a monthly fee for using their TradingView charts in my analysis.
❤️ Please, support our work with like & comment! ❤️

EURAUD Technical Analysis! SELL!
My dear subscribers,
EURAUD looks like it will make a good move, and here are the details:
The market is trading on 1.7781 pivot level.
Bias - Bearish
Technical Indicators: Both Super Trend & Pivot HL indicate a highly probable Bearish continuation.
Target - 1.7707
About Used Indicators:
The average true range (ATR) plays an important role in 'Supertrend' as the indicator uses ATR to calculate its value. The ATR indicator signals the degree of price volatility.
Disclosure: I am part of Trade Nation's Influencer program and receive a monthly fee for using their TradingView charts in my analysis.
———————————
WISH YOU ALL LUCK

EUR/USDThis is my observation for today! I think there’s a high chance, as two FVGs have already formed on the H4. Let’s go! EASY Money.

USD/CAD - Forecast🚨 USD/CAD – Key Levels in Play 🚨
🕰 Weekly View:
Price is trapped inside a 1.36 – 1.40 swing range.
Break above 1.40 → clean run into 1.44 – 1.46 supply.
Fail here → liquidity below 1.34 – 1.35 becomes the target.
📉 Daily Structure:
We’re moving inside a parallel channel, sitting mid-range at 1.38 – 1.39. Liquidity is building under 1.37 — sellers might want to grab that first.
⏱ 8H Play:
Rejection spotted at 1.38 – 1.385 supply.
➡️ Short-term pullback toward 1.37 demand looks likely.
➡️ If buyers defend that, we could see another push into 1.39 – 1.40.
📌 Outlook:
Short-term pullback 🔽 → Mid-term bullish if 1.37 holds.
Break under 1.37? Bears take control toward 1.35.
Follow for more

XHB - Housing Is In Real Trouble - My Short explained🏠 Some Facts & Fundamentals first 🏠
The Fed has made its first rate cut in 2025, and more are expected if inflation remains under control. That could put downward pressure on long-term mortgage rates, which may give the market a little boost.
Builders (like Lennar) are 🏚️ facing profit pressure 🏚️ due to affordability and are offering incentives (rate buydowns, other discounts) to spur demand.
📈 Now to the technicals 📉
Price went up to the Centerline. The 80% rule played out like textbook.
Then it closed above the Centerline, and failed to move further up to the U-MLH, which is a loud 🚨 warning sign 🚨.
And finally, we have a confirmed "Hagopian", when we close below the Centerline this Week.
To me it's all perfect in line - I mean, the TA & Fundamentals.
My plan is, to play XHB short with LEAP Options (182 Days) and take profit on the way down, which is at the Centerline, 1/4 Line and the L-MLH.
Of cours I would bail out or hedge, if price open & close again above the Centerline on the weekly time frame Chart.
⚠️ Stay updated ⚠️
I will start something new in one or two weeks, so you better don't miss it and follow! §8-)
❤️ THANK YOU ALL ❤️
...for the Boosts and Follow from this week. Your feedback is what makes it worth to post!
I wish you all a relaxing and happy weekend §8-)

USDCHF Massive Short! SELL!
My dear friends,
Please, find my technical outlook for USDCHF below:
The price is coiling around a solid key level - 0.7961
Bias - Bearish
Technical Indicators: Pivot Points High anticipates a potential price reversal.
Super trend shows a clear sell, giving a perfect indicators' convergence.
Goal - 0.7924
About Used Indicators:
The pivot point itself is simply the average of the high, low and closing prices from the previous trading day.
Disclosure: I am part of Trade Nation's Influencer program and receive a monthly fee for using their TradingView charts in my analysis.
———————————
WISH YOU ALL LUCK

CAD/JPY BEARS ARE STRONG HERE|SHORT
Hello, Friends!
CAD/JPY is making a bullish rebound on the 12H TF and is nearing the resistance line above while we are generally bearish biased on the pair due to our previous 1W candle analysis, thus making a trend-following short a good option for us with the target being the 106.590 level.
Disclosure: I am part of Trade Nation's Influencer program and receive a monthly fee for using their TradingView charts in my analysis.
✅LIKE AND COMMENT MY IDEAS✅

EURUSD Will Go Down From Resistance! Sell!
Here is our detailed technical review for EURUSD.
Time Frame: 2h
Current Trend: Bearish
Sentiment: Overbought (based on 7-period RSI)
Forecast: Bearish
The market is on a crucial zone of supply 1.177.
The above-mentioned technicals clearly indicate the dominance of sellers on the market. I recommend shorting the instrument, aiming at 1.168 level.
P.S
Overbought describes a period of time where there has been a significant and consistent upward move in price over a period of time without much pullback.
Like and subscribe and comment my ideas if you enjoy them!

BTC End of Q3 Setup Now that FOMC is over and the FED finally cut interest rates by 25bps, what does this mean for BTC in the short term future and beyond?
It has been known for a while that the September FOMC would bring a cut to interest rates and that is what we got, generally this was priced into the market and despite some low time frame volatility not much has changed in terms of % move in the last day.
However, the macro does look bullish from here. Flipping $117,500 opens up the possibility of a range high test. For me this is the direction I'm leaning towards given the macro and how seasonality suggests a stronger end to the year especially after a rate cut.
Should BTC fail to break above the grey box BTC stays within the same constraints it's had for the last month.

CADJPY: Will Keep Falling! Here is Why:
Balance of buyers and sellers on the CADJPY pair, that is best felt when all the timeframes are analyzed properly is shifting in favor of the sellers, therefore is it only natural that we go short on the pair.
Disclosure: I am part of Trade Nation's Influencer program and receive a monthly fee for using their TradingView charts in my analysis.
❤️ Please, support our work with like & comment! ❤️
