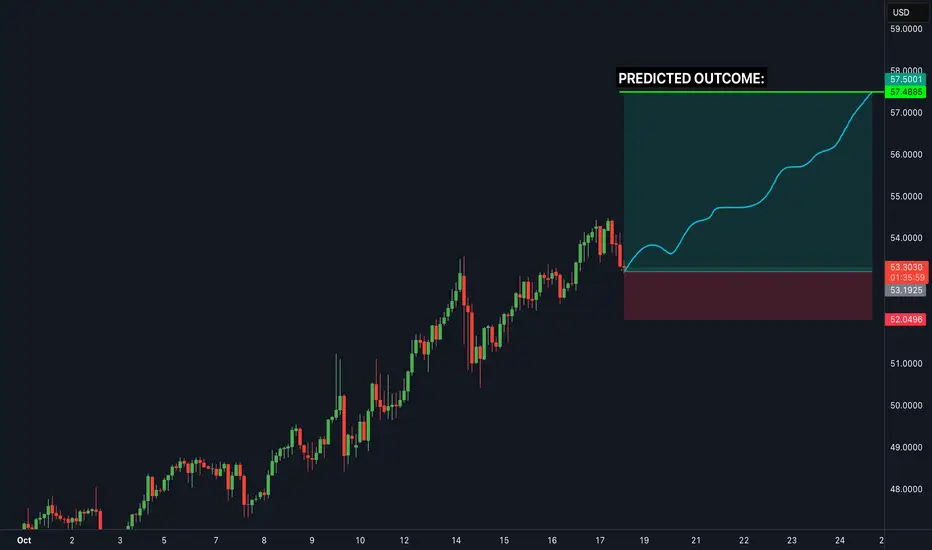
Silver (XAGUSD) Setup — VWAP & Volume Profile Trade PlanXAGUSD Silver is in a strong bullish trend on the higher timeframes, but we’ve seen an aggressive short-term reversal 🔁. I’m using VWAP and Volume Profile to help plan my trade and identify value/support areas 📊.
If price remains above VWAP and shows support from the volume profile, I’ll look for a long opportunity — otherwise I’ll stay flat and wait for confirmation 🚦. Everything’s explained clearly in the video.
⚠️ Disclaimer: This is for educational purposes only and not financial advice.
Silverlong

Grand Silver SupercycleI present the Grand Silver Supercycle. Silver has followed Elliott Wave Theory nicely through the years. The price hit a century low during The Great Depression, beginning what I believe to be the first wave of a supercycle. There is a clear five wave pattern up from this low, peaking in 1980. This is supercycle wave 1. Then, we see a five wave corrective pattern down, bottoming out in the early 90s. Alternatively, a three wave ABC pattern could be drawn. This is where supercycle wave 3 begins. Wave 3 is typically much more prominent than wave 1 in Elliott Wave Theory. For this reason, it makes sense that the next five wave pattern ending in 2011 is only the first subwave of supercycle wave 3. The second subwave corrected to the 2020 low, and we are currently on the third subwave. Within this subwave, we could either be starting a third wave (as shown in the chart) or still be on the corrective second wave. I believe the former is much more likely due to fundamentals.
Price targets within the current subwave were estimated as follows:
wave 3 length = 1.618 X wave 1
wave 3 target = $48
wave 4 length = 38.2% retracement of wave 3
wave 5 length = 1.618 X (wave 3 end - wave 1 start)
I'm more confident on wave 3 ending near $48 than I am of wave 5 ending near $95. There is strong resistance at $50, which coincides with the Elliott target zone. Wave 5 length can vary significantly. For silver at least, fifth waves have traditionally been long ones.
Fundamentals
Elliott Wave Theory is only a tool. It needs to be backed up by fundamentals when forecasting on long time frames. Silver is undervalued due to many years of supply outstripping demand, creating cheap prices. That is in the early stages of changing as now demand outpaces supply. Global silver demand was expected to hit an all time high of 1.21 billion ounces in 2022 (www.silverinstitute.org). This is largely due to increases in demand in both industry (Green Revolution) and personal investment (stackers hedging against inflation). Silver reserves currently stand at 530,000 metric tons (www.statista.com). The current demand is 38,000 metric tons per year. A simple calculation shows existing reserves could be depleted in 14 years. However, this calculation doesn't take into account new discoveries and recycling, which have so far kept pace with demand. Estimates of time to depletion of reserves vary wildly from a couple decades to a few centuries. At the moment, the prime driver of price (in addition to inflation) will be the deficit, not depletion of reserves.
Inflation is a totally different animal that is much harder to forecast long term due to its close relationship to government and Federal Reserve policy. It is more likely that when presented the choice, our leaders choose high inflation over debt default and depression. How this all is going to play out is anyone's guess. It seems for now our leaders are trying to kick the can down the road for as long as possible. If hyperinflation hits, the silver price will reach extraordinary heights.

mrmoney limited XAG/USD swing trading ideaprice formed a range demand zone which will aid price for its bullish trends

Silver is in the Down TrendHello Traders
In This Chart XAGUSD HOURLY Forex Forecast By FOREX PLANET
today XAGUSD analysis 👆
🟢This Chart includes_ (XAGUSD market update)
🟢What is The Next Opportunity on XAGUSD Market
🟢how to Enter to the Valid Entry With Assurance Profit
This CHART is For Trader's that Want to Improve Their Technical Analysis Skills and Their Trading By Understanding How To Analyze The Market Using Multiple Timeframes and Understanding The Bigger Picture on the Charts

#XAGUSD(SILVER): Price is likely to drop at $41 area. The current trading price of XAGUSD (SILVER) is at an all-time high. This is attributed to global uncertainty and the decline of the US Dollar. However, the lack of significant volume to support this level suggests a potential rapid decline. This decline could facilitate the price reaching a key level of $41.
There are two potential benefits from this drop. Firstly, it would allow for maximisation of trading by selling. Secondly, when the price reaches this level, we can purchase at the discounted price.
We wish you the best of luck and trade safely.
Team Setupsfx_

BUY SILVER! Perfect trade setupBased on deep analysis we can see silver is heading to the upside... this is a perfect risk to reward trade setup. Low risk high reward
Silver - Can it go to 50$? We like to hedge by Buying Silver and selling Gold:
Gold is already at all time highs , but Silver is not even half of it's previous highs (2011)
Silver, the 'Cinderella Gold' is a semiconductor - thus rises with technology
Silver rises and drops togethjer with Gold, thus allowing us to have a beautiful hedging opportunity for the next few months

Setupsfx_ | SILVER: Preparing For Another Bullish Move! There are two buying areas we believe could reverse the price trend, which would be a significant move in silver price history. We may even see it go above $40 for the first time. Silver is becoming a secondary best option to invest in the global market, but it will never surpass gold at least for now.
Good luck and trade safely!
Team Setupsfx_

Silver - Expecting Bullish Continuation In The Short TermH4 - Strong bullish momentum.
No opposite signs.
Until the two Fibonacci support zones hold I expect the price to move higher further.
If you enjoy this idea, don’t forget to LIKE 👍, FOLLOW ✅, SHARE 🙌, and COMMENT ✍! Drop your thoughts and charts below to keep the discussion going. Your support helps keep this content free and reach more people! 🚀
--------------------------------------------------------------------------------------------------------------------

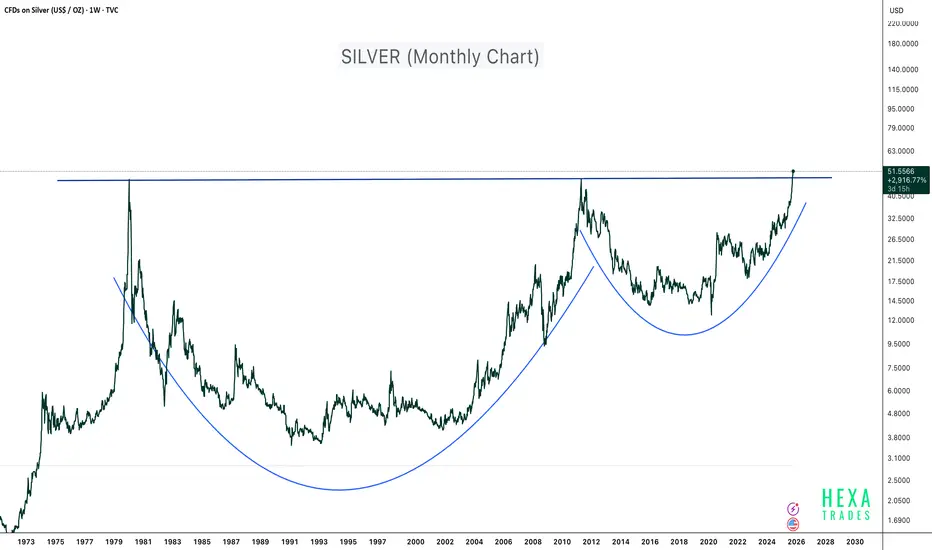
Silver - 45 Years of Breakout!Silver has just completed one of the largest and longest cup and handle patterns in financial history, spanning more than four decades. The metal has officially broken above the 1980 and 2011 highs, signaling a potential supercycle breakout on the monthly timeframe.
This type of long-term technical structure typically marks the beginning of a massive secular bull run, often driven by macroeconomic shifts such as inflation cycles, fiat currency debasement, and rising demand for hard assets.
Technical Highlights:
- Pattern: 45-year Cup and Handle formation
- Breakout Zone: Above $50 confirmed (Weekly chart)
- Structure: Deep base formation showing multiple accumulation phases (1981–2001 and 2012–2023)
Macro Perspective:
Silver is benefiting from:
- Increased industrial demand (especially in solar, EV, and electronics sectors)
- Inflationary monetary policies and growing global money supply
- Renewed investor interest in tangible and real assets
This breakout could mark the start of a multi-year bull run for silver. Long-term investors may view this as an opportunity to accumulate and hold for 10–15 years, aligning with the magnitude and duration of the pattern.
If the price experiences short-term pullbacks in the coming months, use DCA (Dollar-Cost Averaging) to build long-term exposure.
Conclusion:
After 45 years of consolidation, silver is finally breaking free. The chart points toward a historic structural breakout, potentially setting the stage for the next precious metals supercycle.
Cheers
Hexa
Disclaimer:
This analysis is for educational purposes only and does not constitute financial advice. Always conduct your own research and manage risk responsibly.
Gold’s Playbook Repeating in Silver?HI GUYS!
History doesn’t repeat, but in the markets, it often rhymes, and silver’s chart looks eerily familiar.
Gold’s long-term cup-and-handle pattern between 2013–2023 led to a massive breakout above $4,000. Now, silver appears to be tracing the same formation, just a few years behind.
Silver’s cup (2011–2024) has completed, and its handle (a descending channel) is forming right where gold’s did before it launched.
The measured target? Around $200+ USD, a level that would mark a historic revaluation of the metal.
With industrial demand rising and monetary uncertainty persisting, silver could soon follow gold’s lead, turning this technical Deja vu into a full-blown breakout.
History’s playbook is open. Silver might be next.

#XAGUSD: A Strong Bullish Move, Possible Target at $45?Silver is currently experiencing a correction, but the overall price remains bullish. Analysing the data, we can see a potential price reversal in our area of interest. Following the recent higher high, price is poised to create another record high. We should closely monitor volume and price behaviour. A strong volume signal would indicate a potential bullish move in the future.
Good luck and trade safely.
Like and comment for more!
Team Setupsfx_

Silver Cup &Handle Formation:Potential Breakout Towards $50–$100📊 Silver Technical Outlook (Long-Term View)
Looking at the chart, Silver is forming a **massive cup-and-handle pattern** that has been developing for over a decade. This is one of the strongest bullish continuation patterns in technical analysis.
🔑 Key Takeaways:
1. Support Zone ($40–$42):
* This area is acting as strong support on both weekly and daily timeframes.
* A swing trade from here can easily deliver 18–20% returns.
2. Resistance Breakout ($49–$50):
* If Silver gives a solid weekly/monthly close above its all-time high ($49.7) , it opens the door for a massive rally.
* The upside potential could extend towards $100 (almost 100% gains).
3. Trend Structure:
* Price action shows a steady uptrend since the 2020 lows.
* The blue curve highlights the accumulation-to-breakout phase, signaling strong bullish momentum.
4. Strategy for Traders:
* Short-Term Swing: Look for longs near $40–$42 with targets around $48–$50.
* Long-Term Position: A confirmed breakout above $50 could be held for a much larger move towards $75–$100.
⚠️ Risk Note: Always manage position sizing—false breakouts are possible before the big move.

$50 Silver and $4000 GoldCongratulations, everyone! 🎉
Silver has finally reached our long-term target $50, marking a new historical high. It’s been quite a ride!
From here, in the $50–$56 range, I’d start gradually locking in some profits, carefully and patiently.
In case we get a correction, I’m looking at the $39–$42 zone as a potential retracement area.
The best mid-term scenario would be a healthy consolidation between $45 and $50, followed by another leg higher.
The worst case scenario would be a drop toward $34, which could coincide with a broader stock market correction, considering that 55–60% of silver demand comes from industrial use.
Cheers! 🍻

Silver - Eventually new all time highs!🪚Silver ( TVC:SILVER ) might soon break out:
🔎Analysis summary:
If we look at the bigger picture, Silver has been consolidating for the past couple of decades. But with the recent strong rally of about +50%, Silver is once again heading back to the previous all time highs. Despite a potential short term correction, Silver remains totally bullish though.
📝Levels to watch:
$42, $34
SwingTraderPhil
SwingTrading.Simplified. | Investing.Simplified. | #LONGTERMVISION

Buy Silver ETF @91Buy SILVER in all dips
Can be Multibagger!!
Target1 - 101
Target2 - 118
Target3 - 150
Disclaimer :-
I am not SEBI registered. The information provided here is for education purposes only.
I will not be responsible for any of your profit/loss with this channel suggestions.
Consult your financial advisor before taking any decisions

Potential long for XAGUSD/SilverLooking for a new potential entry for silver. Silver is really bullish, and im looking to buy and ride the price up to potential new ATH

Trader Tilki | XAGUSD (Silver) 1H Analysis: Strategic Buy ZonesHello Guys,
Here’s my XAGUSD-SILVER analysis. I’ve received many requests for this, and every follower matters to me — I can’t ignore your demands.
As you know, SILVER usually moves in positive correlation with GOLD and often reacts the same way to news events.
The buy levels I’ll be watching:
🔵 BUY level: 44.66118
🔵 BUY level: 44.02180
🟢 Target level: 46.64801
🔴 Set your stop level according to your own margin.
If price reaches these zones, I’ll definitely open a buy position and take my shot.
Let’s see together how this analysis plays out.
Every like is my biggest motivation to keep sharing these analyses.
Thanks to everyone supporting and following me!

Get some Silver coins before breaking 50$I am expecting a weaker dollar for the next decade. Commodities especially gold, silver and oil might fly.

Silver - Expecting Bullish Continuation In The Short TermH1 - Strong bullish momentum.
No opposite signs.
Until the two Fibonacci support zones hold I expect the price to move higher further.
If you enjoy this idea, don’t forget to LIKE 👍, FOLLOW ✅, SHARE 🙌, and COMMENT ✍! Drop your thoughts and charts below to keep the discussion going. Your support helps keep this content free and reach more people! 🚀
--------------------------------------------------------------------------------------------------------------------

SILVER TO $750 IN THE NEXT DECADE ?This has to be the biggest Cup & Handle Formation in Human History. Holy Smokes.
Ok, let's dive into the Fundamentals:
1) Industrial Demand: Silver is essential in various high-growth industries such as electronics, solar energy, and medical devices. As technological advancements continue, the demand for silver is expected to increase significantly.
2) Investment Demand: Economic uncertainty, inflation, or financial crises often lead investors to seek precious metals like silver as a safe haven.
3) Supply Constraints: Silver mining production may face challenges due to factors like depleted mines, increased extraction costs, or regulatory changes. Supply shortages can occur if production cannot keep up with demand, which will ultimately lead to a short squeeze.
4) Monetary Policy and Inflation: Central banks' monetary policies, such as maintaining low interest rates or implementing quantitative easing, can weaken currencies.
5) Green Energy Initiatives: The push for renewable energy sources, particularly solar power, relies heavily on silver for photovoltaic cells. As global efforts to combat climate change intensify, the demand for silver in green technologies is likely to rise, boosting its price.
(aka Agenda 2030 - The Great Reset)
What scares me about this chart is that it suggests terrible events are imminent.
The impact of these events cannot yet be measured, but they will be catastrophic for humanity.
Stay Safe and keep stacking as fast as possible, NFA!
CYANE

Silver Long Trade ideaSilver has broken out of consolidation and closed above the recent high.
This is a bullish signal we can consider to buy/long silver, near term we should see $44 price point.
Good luck !

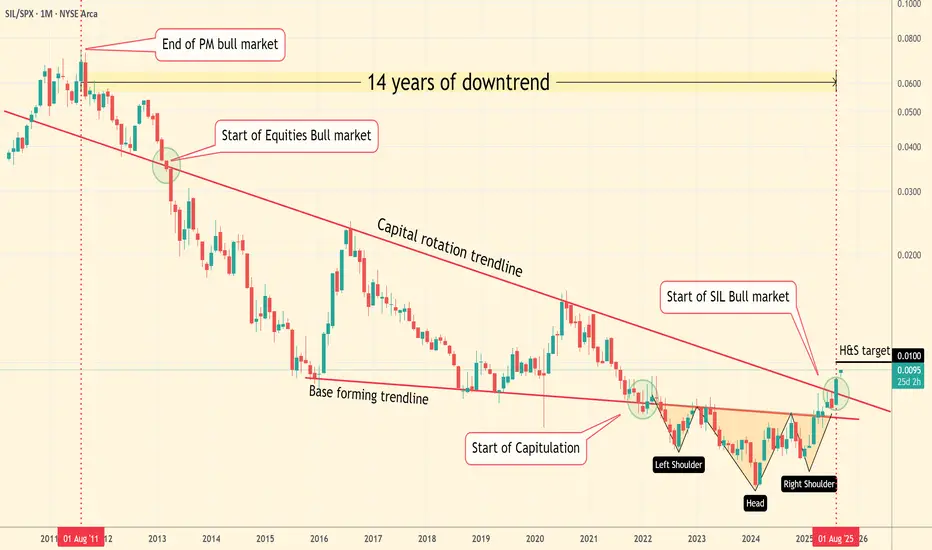
Why Silver Miners Are Poised for a Historic Breakout...After 14 long years of being left in the dust by the S&P 500, the silver mining sector is finally signaling that its time has come. The chart of the SIL/SPX ratio tells a powerful story, suggesting we're on the brink of a massive capital rotation.
The Technical Evidence Is Clear
The long-term downtrend, which has defined this ratio for well over a decade, is officially over. Following the completion of a classic Inverse Head and Shoulders pattern, the ratio has now logged a decisive monthly close above its crucial "Capital Rotation Trendline." This isn't just a minor blip; it's a major technical breakout that signals a fundamental shift in market sentiment.
The Fundamental Logic Is Unstoppable
For years, capital has overwhelmingly funneled into technology and the broader S&P 500. Now, as those sectors look increasingly overvalued, the money has to go somewhere. The asymmetry here is staggering: the sheer difference in market capitalization means that even a small percentage of funds rotating out of tech and into silver miners could trigger an explosive price move in the silver mining sector.
Physical Silver Is Providing the Catalyst
This breakout isn't happening in isolation. It's being confirmed by the price of physical silver itself, which is pushing past key resistance levels at $40 and has its sights set on $50. This move provides the perfect fuel for the miners, as higher silver prices dramatically increase their profit margins and overall value.
The situation is clear: the smart money is likely already moving. The question is, are you ready to join them?