The Scariest Divergence In the MarketThe Scariest Divergence In the Market
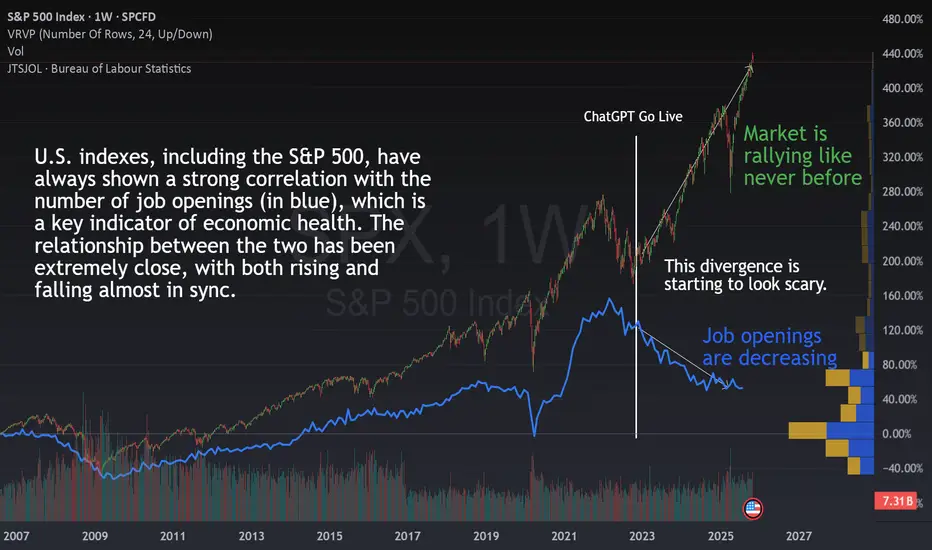
If you look at the chart, you’ll see the TVC:SPX (candles) and U.S. job openings (in blue) plotted together since 2001.
Historically, these two metrics have been highly correlated , both rising and falling almost in sync as the economy expanded or contracted.
But something changed dramatically in November 2022.
That’s when ChatGPT went live, marking the start of the AI boom that has reshaped entire industries and mindsets. From that point on, we can see a massive divergence, the kind we’ve never seen before.
While job openings have kept declining steadily, the market has rallied like never before. This is not logical from a historical point of view.
🤖 Is AI Replacing Workers?
One possible explanation is that the market sees AI as a reason for optimism:
“If companies can do more with less labor, that means higher margins and better efficiency.”
So, fewer job openings might not scare investors anymore, it could even be seen as a sign of progress.
But that raises two key questions:
Is AI really replacing workers ?
If so, what happens to the broader economy and ?
📊 What the Data Says So Far
Surprisingly, unemployment in the U.S. has increased only slightly since AI went mainstream.
It’s a slow, healthy rise not a surge. So i t doesn’t seem like AI is replacing workers at scale just yet.
That’s good news in one sense, if unemployment remains low, consumer demand stays healthy, and the economy keeps running.
However, it also means that companies’ fixed costs haven’t really improved, and their productivity gains from AI are still very moderate , far from the exponential growth that the market seems to be pricing in.
💡 My current View
From my perspective, this chart makes one thing very clear.
The benefits of AI , as of today, are still much smaller than what the market is assuming.
Yes, AI will improve margins and efficiency over time. But if everyone implements it, competition will eventually push prices down again, and margins with them. The very same than internet with the online sales.
The real challenge won’t be for companies that adopt AI, but for those that don’t adapt fast enough , or for those that overspend on AI tools that fail to deliver meaningful returns.
☄️Some AI Stocks Are Starting to Show Doubt
Several major AI-related stocks are also showing concerning patterns . We don’t have confirmation yet , but it’s time to stay alert and be prepared in case the market starts breaking key support levels among the main players.
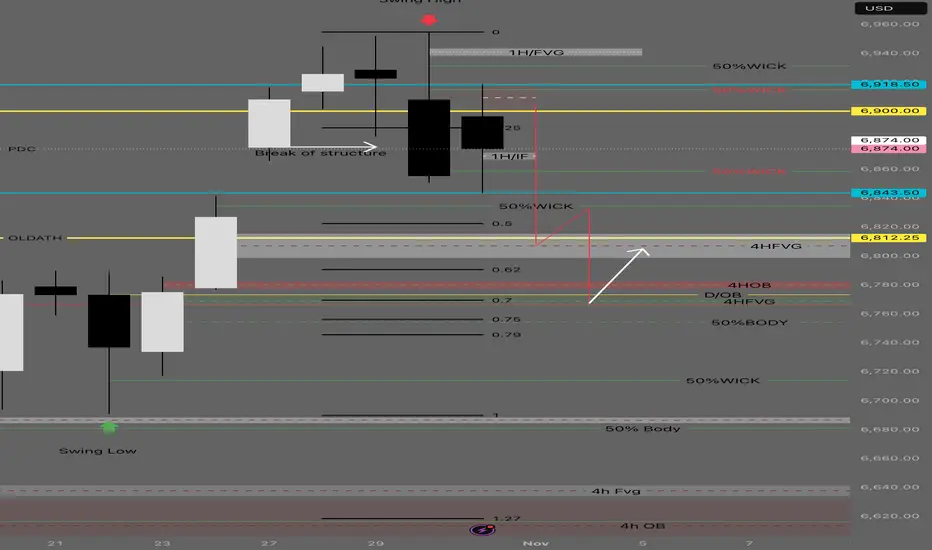
And the main index, S&P 500 is still in the bull zone but are key levels to watch closely:
🤔 What Do You Think?
Is AI truly transforming company performance as fast as investors believe?
Or are we witnessing a global over-excitement where expectations are running far ahead of reality?
Sp500index
SPX - clear bullish signs ahead..SPX Has recently tested major support levels but struggled to break through below and bounced back up to the upside. The price also broke through the resistance trendline to the upside which is a major clear sign that SPX will be hitting the next upward target (fibonacci extension) shown on the chart

S&P 500 (ES1!): Bullish! Buy This Dip!Welcome back to the Weekly Forex Forecast for the week of Nov. 3 - 7th.
In this video, we will analyze the following FX market: S&P 500 (ES1!)
The S&P500 is bullish, and buys are valid.
Price is currently in a +FVG, so looking for sells is prohibited!
If the +FVG fails, only then will buys become invalid.
Enjoy!
May profits be upon you.
Leave any questions or comments in the comment section.
I appreciate any feedback from my viewers!
Like and/or subscribe if you want more accurate analysis.
Thank you so much!
Disclaimer:
I do not provide personal investment advice and I am not a qualified licensed investment advisor.
All information found here, including any ideas, opinions, views, predictions, forecasts, commentaries, suggestions, expressed or implied herein, are for informational, entertainment or educational purposes only and should not be construed as personal investment advice. While the information provided is believed to be accurate, it may include errors or inaccuracies.
I will not and cannot be held liable for any actions you take as a result of anything you read here.
Conduct your own due diligence, or consult a licensed financial advisor or broker before making any and all investment decisions. Any investments, trades, speculations, or decisions made on the basis of any information found on this channel, expressed or implied herein, are committed at your own risk, financial or otherwise.

SPY 30 minute outlook for 3 to 7 NovemberThe most important thing first
Only trade at the map levels. For this week that list is short. 678, 682, 685, 690, and the gap zone 671 to 672. Everything else is noise until price reaches one of these spots. Your job is to listen for acceptance or rejection at the level, then act with a small number of simple rules.
Why this matters this week
The last print on Friday was near 682. Buyers defended higher lows for two weeks, yet supply still lurks above 685. This creates a tight battlefield where patience has an edge. We also walk into a week with event windows that can move liquidity at specific times. That makes a level based plan far more useful than chasing mid range impulses.
The map you can trade
Place these levels on a clean thirty minute chart. No indicators are required for the core read.
700 round number magnet. Respect the gravity if price runs
690 first upside checkpoint above the band
685 first breakout gate. Acceptance here often pulls price into 690
682 pivot around Friday close. That is the middle of the week map
678 first support inside balance
671 to 672 open gap zone from late October
665 next shelf under the gap
661 to 662 fifty day context on the daily, not a trigger but important reference
Mark a simple session based VWAP if you like, only as a way to define impulse and pullback structure. If VWAP pins near 682 during cash hours, treat that as the intraday axle.
Catalysts to respect
Write the event times directly on your chart. Private payrolls, the two ISM prints, and Treasury supply updates are the likely spark plugs. The idea is not to predict the number. The idea is to protect your risk into the time stamp and let the reaction tell you when to press or stand down. Most reactions that stick will retest a level. That is the entry you want.
Three rules for entries and exits
Keep it simple. You need only three.
Break and hold
Above 685 for fifteen minutes, buy the first pullback that holds the breakout line. Use the impulse low as your stop. First target 690. If momentum stays firm, trail under higher swing lows and let the tape pull you toward 700. If the retest under 685 appears, stand aside and wait for a clean reclaim before trying again.
Reject and rotate
If price rejects 685 early and bleeds back under 682, fade pushes back into 682 only when the tape is balanced and liquidity is thick. First target the other edge at 678. Second target is a test of the 671 to 672 gap zone. Cut the idea if a higher low forms above 682 and buyers reclaim the pivot.
Explore and revert
If 678 breaks and fails to reclaim, let price explore 671 to 672. Two ways to trade it. Either do nothing and stalk reversal structure inside the gap zone, or short failed bounces that cannot get back above 678 with a target at the top of the gap. In both cases the invalidation is a fast reclaim of 682 with improving tape.
How to size and manage
Define one Discipline unit for the week. That is your full risk per idea
Use one half unit when you trade against the outer edge of the weekly options expected move. At Monday open write the current expected move upper and lower bounds on your chart and treat them as fences for scaling
Take partials into logical magnets. Into 690 from a 685 break. Into 678 from a 682 rejection. Into 671 to 672 after a 678 failure. The objective is to convert risk into house money early, then trail with intent
What to watch intraday
A breadth or depth improvement during a 685 reclaim. That is usually the cleanest long of the day. You will see it in tape speed and order book thickness rather than in oscillators
A stall near 690 with lower highs on five minute bars. That is usually the place to stop pressing longs and to hand the rest of the work to the trail
A false break under 678 that immediately rips back through 682. That is the place to flip your bias for a rotation toward 685 again
Scenarios in plain language
Trend continuation
If buyers clear 685 and hold it on the retest, the path of least resistance is higher. Aim for a measured push into 690. If the tape is squeezing and liquidity stays supportive you can keep a runner for a look at 700. The evidence you need is simple. Higher lows on five and ten minute bars and no heavy selling into the bid.
Range rotation
If we reject 685 early, expect a ping pong week between 678 and 685 with a pivot near 682. You fade the edge only when the tape is calm. You do not fade when a data release has just hit, because the first reaction can keep running.
Pullback to value
If 678 gives way and cannot reclaim, let it go. The highest quality buy zone is down near 671 to 672 where trapped shorts may cover. The first long is often the retest that holds the top of the gap and prints a higher low on five minute bars.
Risk and discipline
Cut losers fast at the level, not in the middle of the range
Never widen stops during event minutes
Do not add size mid range. Add only at the level after confirmation
If you take three trades and all three fail to hold structure, step away for an hour. That reset often saves the day
Closing note
You do not need ten indicators and a dozen opinions this week. You need five levels, three rules, and one risk unit. Write them down. Trade only when price comes to you. Let the market do the heavy lifting.
Reminder
Education and analytics only. No advice. No guarantees. Process beats prediction.

SP500 Bearish unless price consolidate and make a swing low!If price reject 6900 on Asia or London lower prices are more likely we are to premium. Discount area 6800 -6750 keeping bull trend intact. So be aware of bull traps.
Weekly Market Outlook: Nifty, BankNifty & S&P 500Nifty (25722) slipped ~70 pts this week, staying exactly within my projected range of 26250–25350. The weekly candle formed a shooting star, signalling selling pressure from higher levels.
A close below 25711 can extend downside toward 25450–25300.
On the upside, only a close above 25860 can open a move toward 26100–26150.
BankNifty held firm above 57600, but a dip below 57450 could pull it to 57000–56750.
A breakout above 57900 with volume can take it toward 58469–58577 (ATH) — this will be key to any Nifty recovery.
S&P 500 closed at an all-time high of 6840, just shy of the crucial Fib level 6959. Sustaining above 6800 can push it to 6920–7009, while a drop below 6780 may trigger a pullback toward 6689/6568.
Historically, November brings a healthy 4–7% correction after strong October rallies. So a dip toward Nifty 25150–25200 wouldn’t be surprising — it may just set up the next leg higher.
🔹 Nifty Range: 26150–25250
🔹 BankNifty Key Zone: 57450–57900
🔹 Global Cue: S&P 500 near Fib resistance 6959

S&P500: Rising?S&P 500 futures edged slightly lower in yesterday’s session but are expected to remain within the upward trajectory of magenta wave (5), which, under our primary scenario, is likely to continue moving higher. This advance would also complete the larger blue wave (III). Afterward, we anticipate a corrective phase in magenta wave (A), which should put renewed pressure on the index. At the same time, we are monitoring our alternative scenario, which suggests that magenta wave alt.(3) has not yet concluded. If prices drop below the support level at 6,371 points, this scenario will come into play. In that case, wave alt.(4) would likely extend further downward, reaching its low within the magenta alternative Target Zone between 6,055 and 5,822 points (probability: 30%).

S&P Nearing Major Resistance (Update)This updates my previous S&P chart back last year showing the S&P still had room to run until any major resistance. We're nearing that major resistance at 7577. Looks like it might hit around January 2026.
The trouble is this trend is heating up and we needed a pullback to 6295. With all the excitement from Nvidia and other major Hyperscalers I'm worried it's going to just go straight to Major resistance. *If it does* we could be looking at a decently large pullback next year (finishing around August) down to that 6295 area and back into the supporting trend line for the next big uptrend to start.
If however we slow down here and get a pullback back to 6295 then I think we're good to make it over the major resistance without that big pullback next year.
Either way once we hit the major resistance at 7577 we'll need to get close to that lower trend line at some point to begin a new bull run.
Good luck and take caution as we approach this resistance!

US500US500 – Opportunity at Support
The price is consolidating between 6,880 and 6,920. The support region shows a buying reaction, which could generate a new impulse towards the resistance at 6960.

Trump & The Eighth (8): The Millennium S&P500 Long Deal!For friends and Donald Trump the Magnificent (Trump).
Friends, based on analysis of data from the S&P 500 index, Trump's visible activity, and the Federal Reserve's aggressive interest rate cutting cycle - the conclusion is obvious. The US economy, and therefore the global economy, is transitioning from stagnation to recession. Consequently, the S&P 500 will first enter a correction, then experience a severe crash in 2026.
However, there exists an algorithm that can soften this collapse and save the global economy. This is the exact algorithm Trump intends to execute through a deal with Russia, achieved via a Russia-Ukraine ceasefire. This must become more than a temporary truce - it must be peace for generations to come.
To save millions of lives, to rescue the global economy and US markets, the Eighth (8) will come:
The Eighth (8) - the man who, through agreements with both Putin and Trump, will provide security guarantees and immunity for Putin, his inner circle, and their capital.
The Eighth (8) will sign a peace agreement with Zelenskyy based on a 50-year lease of territories along the current front lines. Using unfrozen Russian sovereign assets, he will restore both Russian and Ukrainian territories and pay all due compensations to victims' families.
The Eighth (8) will make a deal with Trump ensuring complete cooperation, mutual understanding, and prosperity for Russia, Ukraine, and the United States.
These three steps will enable comprehensive resolution of both regional and international issues, which in turn will sustain the global economy and US market indices.
Best regards,
VinterFrank (8)

Weekly Outlook: XAUUSD, #SP500, #BRENT for 27-31 October 2025XAUUSD: BUY 4075.00, SL 4025.00, TP 4225.00
Gold starts the week near record territory, with spot prices fluctuating around $4,080 per ounce. Support comes from expectations of a Federal Reserve rate cut at the October 28–29 meeting and the recent pullback in U.S. Treasury yields ahead of the decision. Headlines about a potential temporary government funding pause in the U.S. and delayed data releases enhance gold’s role as a defensive asset, while September inflation came in slightly below expectations, reinforcing the case for policy easing. In addition, fund inflows into gold have stayed strong after October’s price spike.
The fundamental backdrop remains constructive: World Gold Council data point to renewed net purchases by central banks late in the summer, and October saw more active investment flows into “paper” gold as market volatility rose and real yields eased. Risks to this view include a more cautious Fed tone and a brief dollar rebound after the decision, but these are offset by steady institutional demand and ongoing geopolitical uncertainty.
Trade idea: BUY 4075.00, SL 4025.00, TP 4225.00
#SP500: BUY 6785, SL 6705, TP 7025
U.S. equities enter the week on strong footing: the S&P 500 holds near 6,790 after softer September inflation data and lower government bond yields. Markets are focused on the Fed’s October 28–29 decision; the prevailing view anticipates another rate cut, which would reduce borrowing costs and support the valuation of future earnings. The reporting season is in full swing, with expectations for double-digit earnings growth for 2025 and a busy week of results from index constituents.
Fundamentally, the index benefits from a combination of easing rate pressure, resilient profit expectations in sectors tied to digital infrastructure and AI-related investment, and a broadly steady consumer backdrop. Key risks include any prolonged disruption to federal services that could distort the macro data flow, and the chance of tighter corporate guidance given currency strength and fluctuations in global electronics demand.
Trade idea: BUY 6785, SL 6705, TP 7025
#BRENT: SELL 66.30, SL 68.00, TP 61.20
Brent trades around $66 per barrel. The weekly news flow is mixed: on one hand, infrastructure risks linger in the Black and Baltic Sea regions; on the other, international agencies flag accelerating supply growth alongside moderate demand. The earlier OPEC+ decision to allow a marginal output increase and revised surplus projections effectively cap prices despite sporadic supply disruptions and sanctions-related headlines.
By late October, industry assessments imply a gradual rebuild in inventories and a softer price path into Q4, albeit with elevated headline-driven volatility. Additional pressure comes from a cooler global backdrop and rising non-OPEC+ production, while any Fed rate cut would only partly lift the commodity complex. Short-position risks include an escalation of geopolitical tensions that threatens exports and an unexpectedly sharp draw in weekly U.S. stock data.
Trade idea: SELL 66.30, SL 68.00, TP 61.20

S&P 500 (ES1!): Bullish! Wait For Valid Buy Setups!Welcome back to the Weekly Forex Forecast for the week of Oct. 27 - 31st.
In this video, we will analyze the following FX market: S&P 500 (ES1!)
The S&P500 closed last week at ATHs. I expect more of the same next week.
Look for valid dip buying opportunities, my friends.
If the market disrespects the +OB, then buys become invalidated.
Enjoy!
May profits be upon you.
Leave any questions or comments in the comment section.
I appreciate any feedback from my viewers!
Like and/or subscribe if you want more accurate analysis.
Thank you so much!
Disclaimer:
I do not provide personal investment advice and I am not a qualified licensed investment advisor.
All information found here, including any ideas, opinions, views, predictions, forecasts, commentaries, suggestions, expressed or implied herein, are for informational, entertainment or educational purposes only and should not be construed as personal investment advice. While the information provided is believed to be accurate, it may include errors or inaccuracies.
I will not and cannot be held liable for any actions you take as a result of anything you read here.
Conduct your own due diligence, or consult a licensed financial advisor or broker before making any and all investment decisions. Any investments, trades, speculations, or decisions made on the basis of any information found on this channel, expressed or implied herein, are committed at your own risk, financial or otherwise.

S%P DROP AND GIVE ME 50....50K PLEASE LOLBias is BEARISH!
Hear me out tho lol!
First, we never predict; we estimate and wait! Price will tell us where it wants to go. Based on my estimate, we have big news this week that does not look very positive and could negatively affect American businesses and stocks, potentially leading to central sell pressure in the market. That, paired with no significant pullback on the D/HTF's, makes me estimate we should have nice sell ops.
4H Golden zone is around 6,809-50% and 6,801-.618%! (Great buy bounce area)
after that we have some IPP'S (important price points)
6,840 If passed and closed above we can see move to even HH's!
or
If we see a rejection to 6,801 price area we can see a dump taking out session IPP's and pushing to lower FVGs! (what I want lol)
so we are going to let the market play, while we wait....and GET PAID!!
GDluckThisWeek!

Tuesday, Oct 21st Weekly Forecast UPDATES!Welcome to the Weekly Forecast Updates!
In this video, we will analyze the following markets: DXY, EURUSD, GBPUSD, NASDAQ, S&P500
Enjoy!
May profits be upon you.
Leave any questions or comments in the comment section.
I appreciate any feedback from my viewers!
Like and/or subscribe if you want more accurate analysis.
Thank you so much
Disclaimer:
I do not provide personal investment advice and I am not a qualified licensed investment advisor.
All information found here, including any ideas, opinions, views, predictions, forecasts, commentaries, suggestions, expressed or implied herein, are for informational, entertainment or educational purposes only and should not be construed as personal investment advice. While the information provided is believed to be accurate, it may include errors or inaccuracies.
I will not and cannot be held liable for any actions you take as a result of anything you read here.
Conduct your own due diligence, or consult a licensed financial advisor or broker before making any and all investment decisions. Any investments, trades, speculations, or decisions made on the basis of any information found on this channel, expressed or implied herein, are committed at your own risk, financial or otherwise.

Weekly Outlook: XAUUSD, #SP500, #BRENT for 20-24 October 2025XAUUSD: BUY 4255.50, SL 4225.00, TP 4410.00
Gold starts the new week at elevated levels: the spot price holds near $4,255 per ounce as markets continue to expect further Federal Reserve rate cuts and as long-term U.S. Treasury yields ease. Ongoing central-bank purchases and a recovery in investment demand add support: diversification of reserves and the metal’s protective role remain in focus, while trade and political tensions between the U.S. and China keep interest in safe assets alive.
Key drivers over the week include the tone of Fed remarks and U.S. inflation releases, the direction of bond yields, and news on global gold flows. Risks for long positions are tied to a slower-than-expected pace of policy easing and a firmer dollar, but steady official buying and elevated uncertainty still shape a constructive fundamental backdrop.
Trading recommendation: BUY 4255.50, SL 4225.00, TP 4410.00
#SP500: BUY 6660, SL 6640, TP 6900
U.S. equities begin the week supported by a move in 10-year Treasury yields below 4% and a heavy earnings calendar. Consensus for Q3 profits remains constructive, and investment in AI and related equipment continues to underpin demand for the largest names. By Friday’s close the benchmark hovered around 6,664; futures point to a neutral-to-positive start while investors watch this week’s macro releases.
The balance of factors favors moderate upside: easing financial conditions, stable profit expectations, and no clear signs of a sharp demand slowdown in key sectors. Counter-risks include softness in some cyclicals, occasional stress in credit, and geopolitics. In this setup, buying on modest dips with tight risk control looks reasonable.
Trading recommendation: BUY 6660, SL 6640, TP 6900
#BRENT: SELL 61.00, SL 61.30, TP 55.00
Brent enters the new week near $61 per barrel. The near-term backdrop weighs on prices: agencies and banks flag faster supply growth in 2025–2026, including as OPEC+ curbs gradually unwind and non-OPEC output rises. At the same time, demand forecasts are turning more cautious amid slower global growth and structural trends such as improved efficiency and transport electrification. Trade frictions between the U.S. and China and headlines on U.S. inventories add to buyer caution.
Overall, the supply-demand balance tilts toward surplus, limiting upside unless fresh supply disruptions emerge. Risks to short positions include sudden outages, signals of deeper OPEC+ restraint, or a quicker-than-expected demand rebound in Asia. The base case is continued downward pressure with brief news-driven rebounds.
Trading recommendation: SELL 61.00, SL 61.30, TP 55.00

BUY SPX - S&P500- Profitable trade opportunity!Based on our deep analysis we can see that SPX (S&P500) will head to the upside. Great time to BUY - it is currently in a uptrend and is holding on to powerful support levels. The next target is the resistance level to the upside. This is a great low risk high reward trade. BUY NOW!

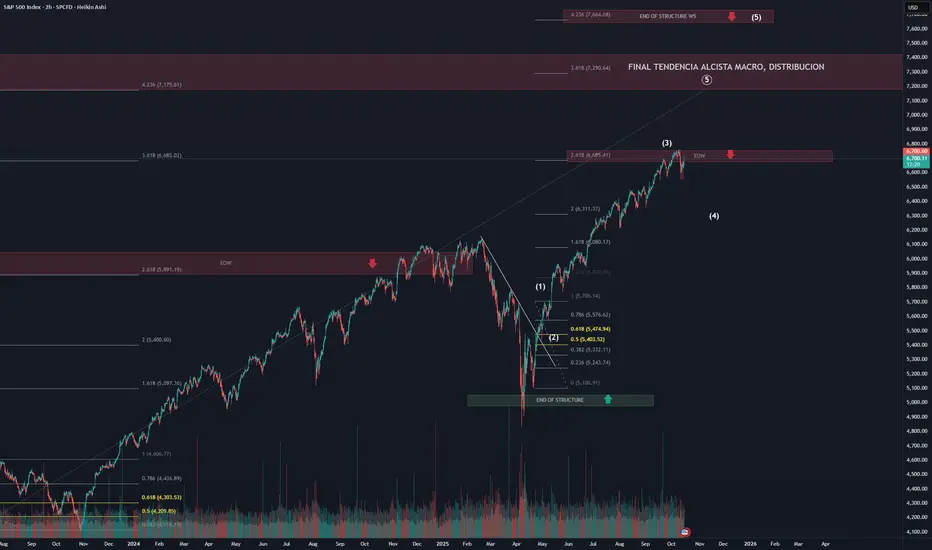
SPX Bullish Trend / Elliot analysisOur analysis of this index suggests that we are currently in the development of a Wave 4 (W4) within the last bullish substructure of the macro fifth wave, where, in the long term, we could potentially see the end of the trend between the 7100 and 7600 levels.
At the moment, the price appears to be moving within the final substructure, which seems about to begin a Wave 4 (W4) correction.
💡 This is just my opinion — always remember to do your own analysis!
From 'pullbacks' to a 'correction' (S&P 500)Setup
Still Bullish. Be patient for entry near end of the corrective move lower
Evidence..
-Trend is up, no top pattern
-No longer 'dips' to 50 DMA, now into a 'correction' with possible move towards 100 DMA
-Large bearish engulfing weekly candle
-The 4 month old trendline has broken.
-RSI has dropped under support - but not yet characteristic of bearish trend by going oversold
-Price has landed at a demand zone under 6500 (could rebound from here)
Signal
Looking to go long on another test of the demand zone OR
at next supports found at matching lows of 6350 then 6200

EURJPY | MarketoutlookThe policy divergence between the US Fed and SNB supports the pair at lower levels.
Jobless claims dropped to 227,000 for the week ending October 19, down from 242,000 the week before, suggesting some stability in the labor market. The four-week moving average rose by 6,750, reaching 231,000, which indicates that jobless claims are still showing fluctuations despite the recent decline.
The S&P Global Flash U.S. Manufacturing PMI increased slightly to 47.8 in October, up from 47.3 in September. However, this still shows that manufacturing activity is contracting for the fourth month in a row. On the other hand, the Flash Services PMI rose to 51.5, indicating modest growth in the services sector, which is important since it makes up a large part of the U.S. economy.

SPX - Bearish ScenarioContinuous three point touches along a down trend line can be seen in red
Right now price may experience this third touch on its current down trend in red.
From there I think it collapse may follow down to levels in 02 and 08 or a bit above them. (price could recover at the red line along the timeframe when covid was occurring.)
Not sure when it will occur but its going to.
Weekly timeframe

$NDX $SPX $BTC All Close at Weekly ATHPretty cool to see ₿itcoin, S&P 500 and Nasdaq all close the week at new ATH 🥳
And now we have $325B about to be dumped into the US economy in FY26Q1 along with more rate cuts on the way.
Next time you speak to a bear, reply with FU HIGHER 🚀

Bitcoin vs S&P 500 – Ratio Signals StrengthBitcoin vs S&P 500 – Ratio Signals Strength 🔍📊
This chart shows the BTCUSD/SPX ratio — in simple terms, how Bitcoin is performing relative to the S&P 500. And what do we see? Clear, technical strength .
🔑 Key Observations:
• BTC/SPX is breaking out from a bullish flag structure just above the 17.30–17.48 region
• If this breakout holds, the technical target is ~26.37 — the top of the multi-year channel
• Historically, breakouts from similar zones triggered explosive upside — even during equity pullbacks
🧠 What does it mean?
Even if the S&P 500 corrects (OR LIKELY NOT) Bitcoin can still outperform, not necessarily by skyrocketing, but by falling less, consolidating, or simply staying resilient . That’s the edge of analyzing ratios, not just price.
Macro-wise, Buffett Indicator shows equities are overvalued . If capital rotates out of stocks, BTC could be a top-tier beneficiary — especially if it keeps showing this relative strength.
💬 Final Thoughts:
• Don’t analyze BTC in isolation — compare it to what it competes with
• Ratios give clarity — this one says Bitcoin’s trend vs stocks is up and strong
• Strong support sits at 14.23 , and there's open space toward 26.37 — a zone worth watching
Are you tracking this breakout? What’s your plan for Q4?
Food for Thought 🍃
“Stocks are at all-time highs. Is this the PERFECT time for big money to hedge into Bitcoin? Likely yes.”
One Love,
The FXPROFESSOR 💙

SP500 Bearish Outlook With Tight SLBearish Technical Reading
• The index is currently trading near 6,728 after a strong recovery rally.
• Nearest hypothetical major resistance: 7,125 (weekly supply + marked zone).
• Nearest key support: 6,150 – 6,170 (structural pivot, last defended level).
• Breakdown from this zone could trigger a deeper correction.
________________________________________
Bearish Trade Setup (Tighter Levels)
• Entry: Short around 6,700 – 6,750 (current resistance zone).
• Stop Loss: 7,150 (above weekly resistance to avoid fakeouts).
• Take Profit 1 (TP1): 6,150 – 6,170 (structural demand, first bearish magnet).
• Take Profit 2 (TP2): 4,820 – 4,850 (major demand, previous accumulation zone).
________________________________________
Logic Behind Levels
• Stop Loss 7,150 is placed above the marked resistance — if price breaks and holds above, bearish thesis weakens.
• TP1 at 6,150 matches the exact key support drawn on your chart — logical place to secure partials.
• TP2 at 4,820 aligns with historical strong demand and would only be targeted if shutdown-driven fear prolongs and selling accelerates.
________________________________________
