How to Use VWAP in Confluence with StructureVWAP is one of the few indicators that consistently adds value when used correctly. It does not predict direction and it does not replace market structure, but it provides a powerful reference point for where fair value sits within the current session or trend.
When combined with structural analysis, VWAP helps you filter trades, improve timing, and avoid impulsive entries that fight the underlying flow.
The first step is understanding what VWAP represents. It shows the average price weighted by volume, reflecting where most transactions have occurred. When price trades above VWAP, it signals that buyers are in control of the session.
When price trades below it, sellers dominate. This context becomes meaningful only when it aligns with the higher timeframe structure.
Start by establishing your bias through market structure.
If the higher timeframe is in an uptrend and price trades within a discount zone, VWAP becomes a dynamic confirmation tool. A reclaim of VWAP after a liquidity sweep or after a break of structure is one of the cleanest signals that buyers are stepping back in.
The same applies in reverse for downtrends: a VWAP rejection after a pullback into premium strengthens the short bias.
VWAP also adds clarity during intraday consolidation. Ranges often form around VWAP because it reflects the session’s equilibrium. Breakouts that occur away from VWAP without pullbacks frequently lack durability.
However, a breakout followed by a retest of VWAP shows acceptance and builds confidence in continuation. This combination turns a common indicator into a reliable filter rather than a standalone signal.
Another effective use of VWAP is identifying exhaustion. When price aggressively pushes far above or below VWAP, it often signals that the move is extended. This does not mean you fade the trend, but it does mean you tighten expectations and wait for structure to align before entering. Once price reconnects with VWAP and shows intent, the next move becomes more sustainable.
VWAP becomes particularly powerful when paired with session logic. Trading above VWAP in a bullish higher timeframe environment during London or New York sessions often leads to cleaner impulses.
Trading against VWAP during low-volume hours produces far more false signals. Timing, structure, and VWAP together create a cohesive framework.
Used in confluence, not in isolation, VWAP supports disciplined decision-making.
It aligns entries with momentum, filters low-quality setups, and clarifies whether the market accepts or rejects a level. When you combine VWAP with structure, liquidity, and session context, your trades become more intentional, less emotional, and significantly more consistent.
Structure
EURUSD – 1-Hour Timeframe Tradertilki AnalysisMy friends, good morning,
I have prepared an EURUSD analysis for you on the 1-hour timeframe.
My friends, if EURUSD reaches the positive levels between 1.16418 and 1.16216, I will open a buy position and target the 1.17075 level.
Additionally, buy opportunities may also come from the 1.16604-1.16542 levels, but for me, the most suitable positive buy zone is between 1.16418 and 1.16216.
My friends, I share these analyses thanks to each like I receive from you. Your likes increase my motivation and encourage me to support you in this way.🙏✨
Thank you to all my friends who support me with their likes.❤️

17.12.25 Daily ForecastPairs on Watch -
FX:GBPAUD
FX:CADJPY
FX:EURNZD
A short overview of the instruments I am looking at for today, multi-timeframe analysis down to what I will be looking at for an entry. Enjoy!

16.12.25 Daily ForecastPairs on Watch -
FX:EURNZD
FX:GBPCHF
FX:GBPAUD
FX:GBPJPY
A short overview of the instruments I am looking at for today, multi-timeframe analysis down to what I will be looking at for an entry. Enjoy!

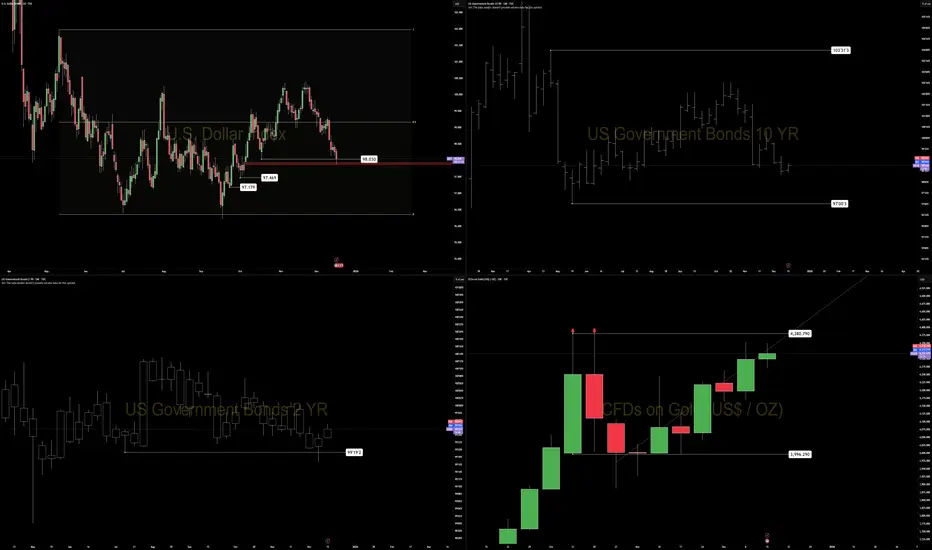
DXY — Daily Structure at a Decision PointThe dollar has completed a prior volume imbalance fill at 97.853 and is now trading against the lower boundary of the daily range.
Participation is low, consistent with late-December conditions. In this environment, daily closes matter more than intraday movement.
Key level: 98.030
This is the prior daily range low.
A daily close below 98.030 shifts the daily bias bearish
Without that close, downside pressure remains internal to the range
The move into imbalance without expansion suggests position resolution, not trend initiation. This is typical of year-end exposure reduction, rather than new macro positioning.
Cross-market context:
Gold is pressing into a double-high area without expansion.
Bonds are showing loss of momentum at the front end.
Risk assets remain supported but lack acceleration.
If structure breaks, the next natural downside references sit at 97.469 and 97.179.
Until a close confirms, this remains a confirmation environment, not a forecasting one.
NZD/USD Building Bullish Structure From DemandDespite recent corrective moves, NZD/USD is developing a strong bullish foundation as price continues to respect the major demand zone at the bottom of the chart. Each rejection from this zone shows clear evidence of institutional buying, with long wicks and aggressive recoveries indicating that sellers are losing power.
The rounded-top and earlier distribution worked mainly as a liquidity sweep, pulling price back into areas where large buyers were waiting. Now, price is forming a higher-low structure, suggesting accumulation rather than continuation of the downtrend. The presence of the Fair Value Gap (FVG 4H) below acts as a completed rebalancing area, giving room for a clean bullish expansion.
If price maintains stability above the buyer zone (0.5690–0.5700), we can expect a progressive move toward the mid-range resistance at 0.5740, and eventually a push back into the upper supply zone around 0.5800, which becomes the primary bullish target. Fresh liquidity is building above recent highs, providing the fuel needed for an upside continuation.
Overall, the market shows signs of accumulation, higher lows, and smart-money support, favoring a bullish continuation as long as price remains above the major demand zone.

EURGBP Trade Recap -1% 15.12.25In this recap I break down my EURGBP short position I took last week using the 1H in combination with the 5M to refine my entry. There was also a valid 4H RE to take as well in line with my short.
Full explanation as to why I executed on this position and this also being a textbook example of the type of bread and butter trades I take as part of my main setups within my trading plan.
Any questions you have just drop them below 👇

15.12.25 Daily ForecastPairs on Watch -
FX:EURNZD
FX:GBPJPY
FX:CADJPY
FX:GBPCHF
A short overview of the instruments I am looking at for today, multi-timeframe analysis down to what I will be looking at for an entry. Enjoy!

You're Early, Not Wrong*Trading Isn’t Hard Because of Entries.
It’s Hard Because Most Traders Don’t Wait for Alignment.
Most traders think trading is hard because:
• They can’t find the right entry
• They struggle to focus
• They’re distracted
• They don’t have enough time
• They think their strategy doesn’t work
Those are symptoms.
The real reason trading feels hard is because most traders don’t understand alignment.
⸻
📍 What Alignment Actually Means
Trading is not about being early.
It’s about being in sync.
Price moves cleanly only when:
• Higher-timeframe objectives are active
• Liquidity has been engineered and taken
• Price is delivered to fair value (premium/discount)
• Lower timeframes execute the higher timeframe plan
If even one piece is missing, the market feels random.
It’s not random — it’s misaligned.
⸻
📉 Why “Good Setups” Fail
Most losses don’t come from bad strategies.
They come from forcing execution before alignment.
Example:
• Liquidity gets swept
• Traders enter immediately
• Nearest order block fails
• Price goes deeper
Nothing broke.
Price was simply seeking better alignment on a higher controlling timeframe.
⸻
⏳ Patience Is Not Waiting for Price
Patience Is Waiting for Timeframes to Agree
This is the part no one wants to hear:
The market doesn’t pay you for being active.
It pays you for being in position at the right moment.
Alignment is rare.
That’s why consistency is rare.
⸻
🧩 Once You See Alignment, Trading Gets Quiet
When timeframes are aligned:
• You stop chasing
• You stop panicking when OBs fail
• You stop needing constant entries
• You stop overtrading
You start waiting with intent.
⸻
Final Thought
If trading feels hard right now, ask yourself:
Am I actually wrong… or am I just early?
There’s a difference.
🧠 The market is never confusing — it’s just ahead of you.
Let alignment catch up before you act.

AUDCAD - Bullish Continuation WatchBias:
Bullish.
⸻
4H:
HTF structure remains clean and intact. Monitoring price to see if continuation can be attended.
⸻
30M:
Mid-term structure is being tracked. Waiting for SSL to be taken, leading price into a test area. From there, I’ll hold for proper confirmation.
⸻
5M:
On LTF, once a LH break is confirmed, I’ll assess buy execution on the bullish leg. Until everything aligns — patience remains the edge.

USDCAD - Bullish Continuation (Correction Phase)Bias:
Bullish.
⸻
4H:
HTF bullish structure remains intact after breaking significant highs. Market is trending but currently in a corrective phase.
⸻
30M:
Mid-term structure is being monitored. Waiting for a major LH break to confirm continuation intent. Once applied, I’ll look for SSL to be taken and for price to fall into a mid-term OB test area. Execution only after mitigation.
⸻
5M:
On LTF, I’ll wait for a minor LH break to confirm direction. Until structure aligns, patience remains key and the process continues.

EURUSD- Bullish ContinuationBias:
Bullish.
⸻
4H:
HTF structure remains intact from previous weeks. No rush here — just tracking price and letting delivery develop.
⸻
30M:
Mid-term LH break printed this week, shifting focus to bullish continuation. I’m now looking for buy interest into the SSL OB resting underneath. Once mitigation applies, that’s the check.
⸻
5M:
After mitigation, I’ll wait for a LTF CHOCH. From there, I’ll look for a liquidity sweep, OB mitigation, and entry. Execution only happens once everything aligns.
Then I’m on go.
⸻
Patience first. Let’s get it.

EURGBP - Bullish ContinuationBias:
Bullish.
⸻
4H:
HTF structure remains mapped and refined. Price mitigated the HTF OB and took out a major liquidity pool, leading to a controlled pullback. Mid-term price action is now working around key HTF levels.
⸻
30M:
Mid-term price action engineered a liquidity sweep, intentionally violating mid-term levels to gather stronger fuel for continuation. Once the mid-term LH break is confirmed, I’ll begin seeking bullish interest.
⸻
5M:
After the mid-term LH break, I’ll refine LTF structure and track price until it becomes readable. Following the LH breach, liquidity should be taken and delivered into an OB. I’ll then wait for a 5M CHOCH flip into a new testing area for buy execution.
Until then — patience is key.

CADJPY- Bullish ContinuationDaily:
Bullish.
⸻
4H:
Clear higher highs and higher lows. Strong bullish momentum remains intact and continuation remains in sync.
⸻
30M:
Price broke major highs and left upside liquidity. Currently waiting for SSL to be taken and for price to deliver into an OB beneath. Execution comes only after mitigation and confirmation.
⸻
5M:
Once the 30M mid-term zone is tapped, I’ll wait for LTF structure to confirm the hold. If applied, buy execution will follow the bullish leg.
Until then — patience is key.

GBPJPY - Bullish Continuation | Alignment in ProgressDaily Bias:
Bullish.
⸻
🔹 Higher-Timeframe Context (4H)
Strong bullish momentum remains intact.
Continuation to the upside is the primary expectation.
⸻
🔹 Mid-Term Setup (30M)
• Waiting for SSL to be taken
• Looking for delivery into a mid-term OB
• After mitigation, I’ll wait for confirmation, not assumption
Discount first. Execution later.
⸻
🔹 Lower-Timeframe Execution (5M)
Once the mid-term OB is mitigated:
• I’ll wait for a lower-high (LH) break
• Structure must confirm bullish intent
• Buy execution will follow the bullish leg, not the drawdown
⸻
🎯 Objectives
• 5M highs
• Higher-timeframe objectives
Until alignment completes — patience remains the edge.
⸻
🧠 Mindset Note
Continuation rewards discipline, not anticipation.
⸻
Let’s go.

AUDJPY - Bullish Continuation | Alignment WatchDaily Bias:
Bullish.
⸻
🔹 Higher-Timeframe Context (4H)
Strong bullish momentum remains intact.
Trend is clearly to the upside, so continuation is the primary focus.
⸻
🔹 Mid-Term Setup (30M)
• Waiting for SSL to be taken
• Once applied, I’ll look for full mitigation into the mid-term OB
• Area will be tested for acceptance, not assumed
Confirmation comes after delivery.
⸻
🔹 Lower-Timeframe Execution (5M)
Once the mid-term zone is mitigated:
• I’ll wait for a structural flip on LTF
• Direction must be confirmed by structure, not candles
• Only when all timeframes align will execution occur
⸻
🎯 Objectives
• 5M highs
• Mid-term highs
• HTF objectives
Until then — patience remains the edge.
⸻
🧠 Mindset Note
Alignment creates opportunity.
Execution is the reward for waiting.
⸻
🔔 Status
Monitoring and waiting.
Let the market invite the trade.
Let’s go.

USDJPY - Bullish Continuation | Alignment - Based ExecutionDaily Bias:
Bullish.
⸻
🔹 Higher-Timeframe Context (4H)
Strong highs were established, immediately shifting focus to continuation, not reversal.
HTF structure remains intact and supportive of higher prices.
⸻
🔹 Mid-Term Delivery (30M)
• Price took SSL, initiating drawdown
• Delivery fell into a refined mid-term OB
• Zone was respected cleanly over time
This confirmed price was seeking proper discount, not breaking bias.
⸻
🔹 Lower-Timeframe Execution (5M)
After mitigation of the mid-term OB:
• I waited for CHOCH / structural flip
• Lower high (LH) was broken, confirming bullish intent
• Engineered liquidity was then taken
• Price delivered into bullish OBs, supporting continuation
Execution followed structure, not impulse.
⸻
🎯 Trade Plan
I’m attending bullish continuations only.
Targets remain active until 5M highs are breached.
Until then — patience is the edge.
⸻
🧠 Mindset Note
Continuation trades aren’t rushed —
they’re allowed to mature.
⸻
📌 Update
I’ll be posting micro moves in my Minds later this week.
We stay active — let’s go.

GBPUSD -- Alignment - Based Bullish ContinuationDaily Bias:
Bullish.
⸻
🔹 Higher-Timeframe Context (4H)
Price delivered clear bullish momentum:
• Mid-term lower high (LH) was broken
• SSL was taken, confirming continuation intent
• Structure remains intact and supportive of higher prices
HTF objective is still active.
⸻
🔹 Mid-Term Execution (30M)
After the SSL was taken:
• Price reacted into nearby OBs but failed to hold
• This was expected — price was seeking stronger discount
• Delivery continued into a 4H origin OB
Once the mid-term LH was broken:
• Price took additional SSL
• Move was engineered into a deeper mid-term OB for proper mitigation
No structure failure — just alignment.
⸻
🔹 Lower-Timeframe Read (5M)
After mitigation of the mid-term OB:
• I dropped to LTF to read structure, not candles
• Mapping structure tells the story — not single candle reactions
• Waiting for internal bullish framework to confirm
Execution comes after alignment, not during drawdown.
⸻
🎯 Trade Plan
I’ll be attending bullish continuations only.
Execution will be based on LTF structural confirmation, not impulse.
I’ll remain active and update later in the week once alignment completes.
⸻
🧠 Mindset Note
Failed near OBs don’t mean the idea is wrong —
they mean price is seeking better pricing.

12.12.25 Daily ForecastPairs on Watch -
FX:AUDUSD
FX:EURGBP
A short overview of the instruments I am looking at for today, multi-timeframe analysis down to what I will be looking at for an entry. Enjoy!

11.12.25 Daily ForecastPairs on Watch -
FX:EURGBP
FX:EURNZD
OANDA:JP225USD
A short overview of the instruments I am looking at for today, multi-timeframe analysis down to what I will be looking at for an entry. Enjoy!

GBPUSD (GU) - Weekly Bullish OutlookHigher-Timeframe Bias:
GU remains bullish. On the HTF, price continues to break significant highs, confirming bullish order-flow and directional intent. Structure is clean — no confusion here.
Middle-Timeframe Context:
Dropping into the mid-timeframes, we can see sell-side liquidity (SSL) taken cleanly. Price reacted off the first orange zone far left, but that reaction didn’t sustain — instead, price delivered a decisive push deeper into the 4H strong order block (OB).
This is where things got interesting:
• Price landed into the 4H OB
• Delivered a professional sweep (not a break — structure held)
• Then printed a midterm CHoCH, confirming bullish continuation intent
Once that midterm CHoCH was confirmed, we immediately had our next point of interest for continuation.
Refined POI:
After clearing sell-side liquidity, price tapped into the nearest orange OB, where structure held on lower timeframes.
We don’t trade candles — we trade structure. And structure told us to prepare for continuations.
LTF View:
On lower timeframes, we’ve already seen multiple clean bullish continuations into the upside. The market is respecting zones, respecting order-flow, and respecting structure.
My Plan for Market Open:
I’ll be patiently waiting for price to revisit and mitigate the internal LTF structure order block.
From that mitigation, I’ll be looking to ride resistance longs targeting:
• Midterm highs
• HTF highs
Direction is set. Structure is clean. Liquidity has been collected.
Now it’s patience until the market opens.
Smart money leads; we follow. Let’s work.

Gold intra-day selling opportunity showed after Fibo & OB bounceXAUUSD (Gold/US Dollar).
Timeframe: 15-minute chart (15m).
Trend Context: The price experienced several increase and decrease but made an imbalance on 1H timeframe yesterday, and it's probably going to decline till closing the FVG on 1h.
There is a major ascending orange trendline acting as dynamic support. The price recently tapped this line and bounced, creating the current upward retracement, but in the last 4 hours, it is showing a probability to break this line down.
I see what I see depending on several reasons:
1. ChoCh (Change of Character) indicating a structural shift that often precedes a retracement or reversal.
2. Fibonacci & Key Levels
The price is trying to bounce back from the golden area of the recent bearish swing (high to low)
0.5 Level (Equilibrium): Located at 4203.330. The price is currently testing this area.
0.618 Level (Golden Zone): Located at 4206.995. This level acts as strong resistance and aligns with the entry zone.
3. Trade Setup (Short/Sell Idea)
The setup is a bearish continuation play, looking to short the market as it retraces into a supply zone.
The entry is just before the OB on 15 min
The target is set near the recent swing low, anticipating that the price will reject the Order Block and fall back down.
⚠️ Note
This is a technical outlook based on my POV to the chart. Always manage risk carefully and adapt if market conditions change
I would be grateful to get your feedback on this idea if you have any opinions to share.
✽ Improve your awareness to seek a great analysis ✔
@AbdullahTech ♾

AUDCAD - Stuck in a Range… Bears Eye the Upper Boundary!📦AUDCAD has been moving inside a clear horizontal range , with price repeatedly rejecting the upper resistance zone highlighted in red. Each time price tapped this area, sellers regained control and pushed it downward.
⚔️Price is now approaching that same resistance once again. As long as this zone holds, we will be looking for sell setups, expecting AUDCAD to reverse back toward the lower bound of the range.
📉The bias remains bearish within this structure unless buyers manage to break and close above the resistance with strength.
Do you think AUDCAD will respect the range again? Share your thoughts below 👇
⚠️ Disclaimer: This is not financial advice. Always do your own research and manage risk properly.
📚 Stick to your trading plan regarding entries, risk, and management.
Good luck! 🍀
All Strategies Are Good; If Managed Properly!
~Richard Nasr
