Data Patterns – Absorption Phase Near Trendline ResistanceData Patterns (India) Ltd – Absorption Phase Near Trendline Resistance
NSE:DATAPATTNS
📈 Pattern & Setup:
Data Patterns is floating right below a crucial descending trendline resistance, showing classic signs of absorption after two consecutive shakeouts. Each shakeout was followed by a recovery with narrowing volatility, suggesting strong hands quietly building positions beneath the surface.
The stock has also formed a “Bull Snort” setup — a rare occurrence where the price absorbs supply near resistance instead of rejecting it. This indicates institutional accumulation and prepares the ground for a clean breakout move.
A close above 2,850–2,860 with strong volume could confirm the breakout, unlocking a potential move toward 3,800+.
📝 Trade Plan:
✍Entry: Above 2,860 (breakout confirmation)
🚩Stop-Loss: 2,700 (below the absorption low)
🎯Targets:
Target 1 → 3,250
Target 2 → 3,800 (38% potential move)
💡 Pyramiding Strategy:
1. Enter 60% above 2,860 on breakout confirmation
2. Add remaining 40% above 2,900 with volume follow-through
3. Trail stop-loss to 2,780 once price crosses 3,100
🧠 Logic Behind Selecting this Trade:
The combination of back-to-back shakeouts, higher lows, and visible absorption reflects smart money activity. The stock’s ability to hold near resistance instead of falling back confirms strength. This kind of coiling price action just below a trendline often leads to a powerful breakout rally once supply is fully absorbed.
Keep Learning. Keep Earning.
Let’s grow together 📚🎯
🔴Disclaimer:
This analysis is for educational purposes only. Not a buy/sell recommendation. Please do your own research or consult your financial advisor before trading.
Swingtrading

Asahi India Glass Limited chart analysisEntry: ₹941-945 (Current Level)
Target 1: ₹971-975
Target 2: ₹988-995
Target 3: ₹1,020+ (Extended)
Stop Loss: ₹925
Technical Rationale:
Powerful breakout from prolonged consolidation (870-940)
Strong bullish momentum with +3.02% gain today
Massive volume spike (441.46K) - significantly above average
RSI trending upward near 60, showing strong momentum
Price breaking above key resistance at 931-940 zone
Fresh 52-week high territory - no overhead resistance
Auto sector tailwinds supporting glass demand
Clear support established at breakout level (931)
Risk-Reward: Excellent 1:3+ ratio
Strategy: Momentum breakout play - Book 30% at Target 1, 30% at Target 2, trail remaining with SL at 960 after T1
Key Levels to Watch:
Support: 931, 920
Resistance: 971, 988, 1,000 (psychological)

AUDCAD: Wait for the Close – 0.9130 vs 0.9057AUDCAD is sitting at a make-or-break spot. It’s been climbing in a 4H channel but just topped out and pulled back to support. I won’t guess mid-range—I'll trade the break:
Bull: H4 candle closes above 0.9130 → room toward 0.9165/0.9180, then 0.9230–0.9250.
Bear: H4 candle closes below 0.9057 → opens 0.9000, then 0.8950–0.8920.
I prefer a close and quick retest/hold for confirmation. Watch AUD/CAD news and oil (for CAD).

HealthCare Global Enterprises Ltd. BUY SetupEntry: ₹709-712 (Current Level)
Target 1: ₹723-725
Target 2: ₹737-740
Target 3: ₹755-760 (Extended)
Stop Loss: ₹690

Oberoi Realty Limited chart analysis: BUY SetupEntry: ₹1,687-1,695 (Current Level)
Target 1: ₹1,722-1,725
Target 2: ₹1,754-1,760
Target 3: ₹1,800+ (Extended)
Stop Loss: ₹1,650
Technical Rationale:
Massive bullish momentum with +5.35% surge today
Strong breakout from consolidation zone (1,600-1,690)
Huge volume spike (2.61M) - highest in recent months
RSI spiking above 60, indicating strong bullish momentum
Price breaking above long-term resistance at 1,680
Gap-up opening showing institutional interest
Real estate sector showing strength
Clear resistance levels at 1,722 and 1,754
Risk-Reward: Favorable 1:2.5+ ratio
Strategy: Momentum play - Book partial at Target 1 (1,722), trail SL to 1,670 at Target 2. Hold remaining for extended targets
Caution: Watch for profit booking after such strong rally. Avoid chasing if price goes significantly above 1,700

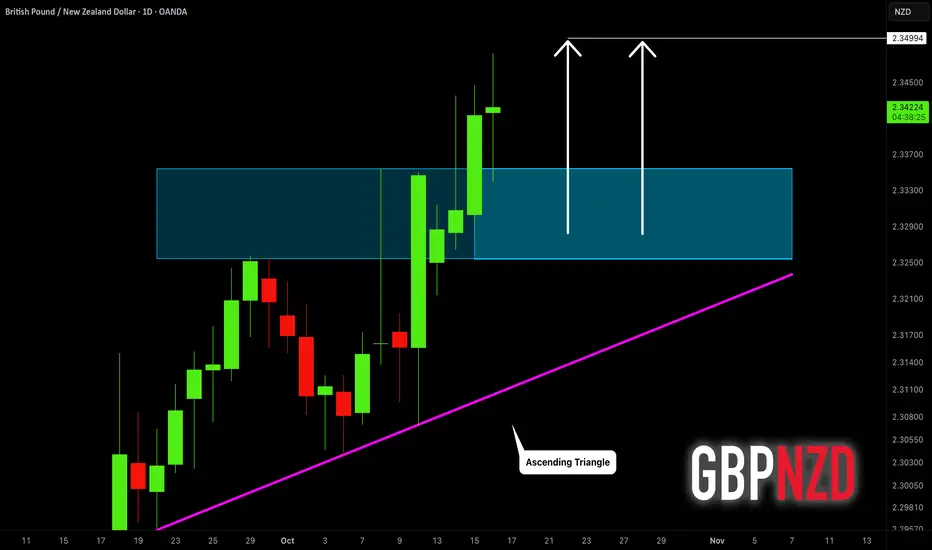
GBPNZD: Bull Run Continues 🇬🇧🇳🇿
GBPNZD will likely grow more following a confirmed
breakout of a resistance of an ascending triangle pattern on a daily.
Next resistance is 2.35
❤️Please, support my work with like, thank you!❤️
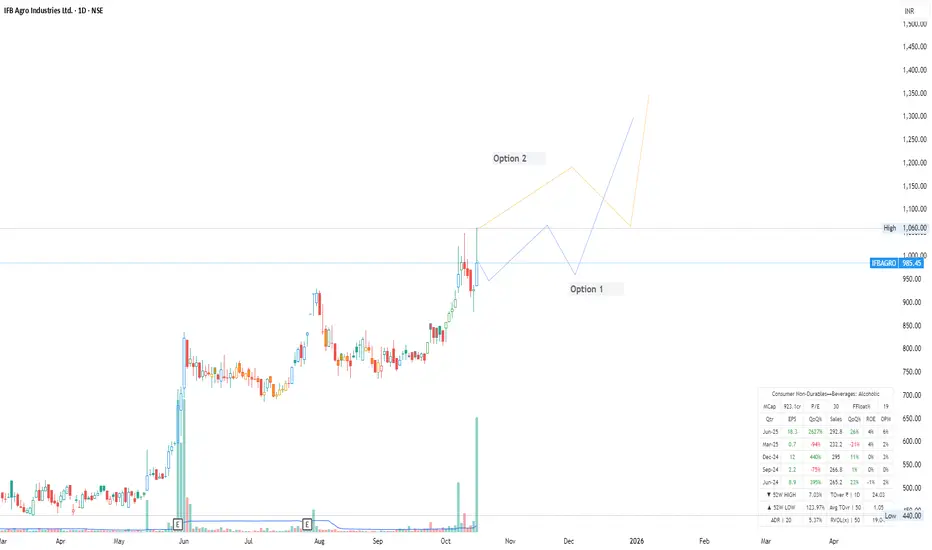
IFB Agro - Go LongIFB Agro has given a good Break Out, Expecting slight consolidation and then re initiate the momentum. There is also a possibility of exponential moving from the high of today also.
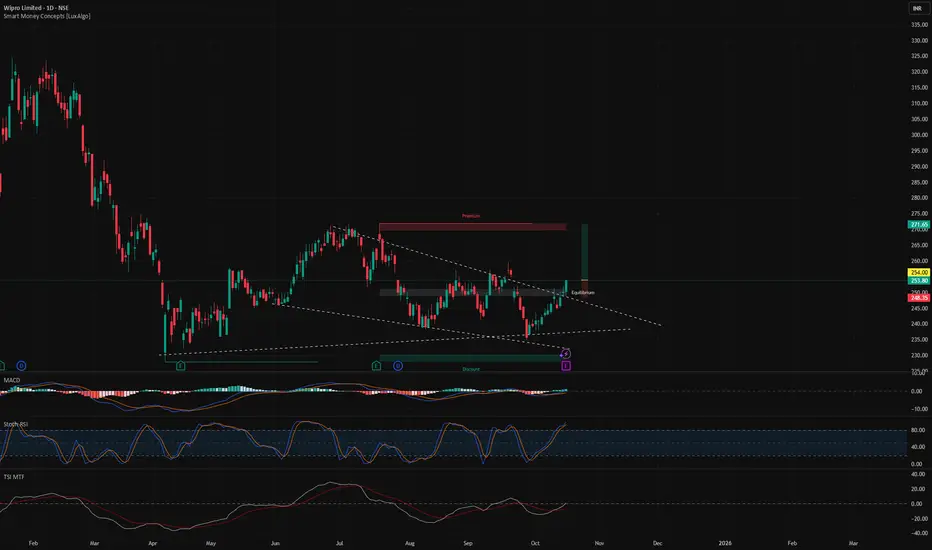
Breakout in WIPROBreakout in WIPRO.
Entry - 254
Targets - 270, 285 & 310
SL - 248
DISCLAIMER: I am not SEBI registered and the ideas posted are only for educational purpose. Do a proper analysis and always trade with STOP LOSS.
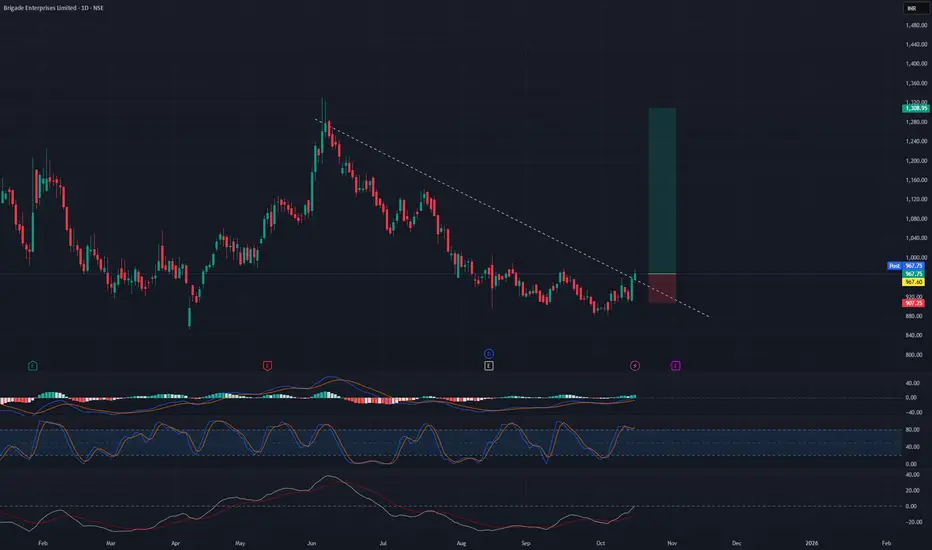
Breakout trading in BRIGADESwing trading opportunity in BRIGADE.
Entry - 970
Targets - 1130 & 1300
SL - 904
DISCLAIMER: I am not SEBI registered and the ideas posted are only for educational purpose. Do a proper analysis and always trade with STOP LOSS.
EURNZD: High Growth Potential 🇪🇺🇳🇿
EURNZD broke and closed above a significant daily
structure resistance, updating a Higher High.
It suggests a highly probable bullish trend continuation after a pullback.
Next resistance - 2.043
❤️Please, support my work with like, thank you!❤️
I am part of Trade Nation's Influencer program and receive a monthly fee for using their TradingView charts in my analysis.

IFL Finance Limited BUY Setup Entry: ₹506-508 (Current Level)
Target 1: ₹516-520
Target 2: ₹525-530
Stop Loss: ₹495
Technical Rationale:
Stock trading above EMA (469.90), showing bullish momentum
RSI at 68.69 indicating strength but not yet overbought
Price consolidating in a rectangular pattern between 490-507
Recent breakout with strong volume (2.38M)
Support from rising trendline visible
+4.43% gain today shows buying interest
Risk-Reward: Favorable 1:2+ ratio

AUD/JPY: Potential Bounce Before Bears Regain ControlAUD/JPY pulled back around 3.1% from its recent high just below the 101 handle, but price has since held above 97.85, showing early signs of near-term strength. A small spinning-top doji formed near the lower end of the range, hinting that dip buyers are starting to step in.
On the 1-hour chart, AUD/JPY has carved out three consecutive higher lows, the most recent appearing as a bullish hammer.
For now, the bias leans toward a minor leg higher before another downside attempt. Key resistance sits between 99.00–100.00, while bears will be watching for a break below 97.85 to target the 97.00 handle and possibly the 96.32 low.
Matt Simpson, Market Analyst at City Index and Forex.com

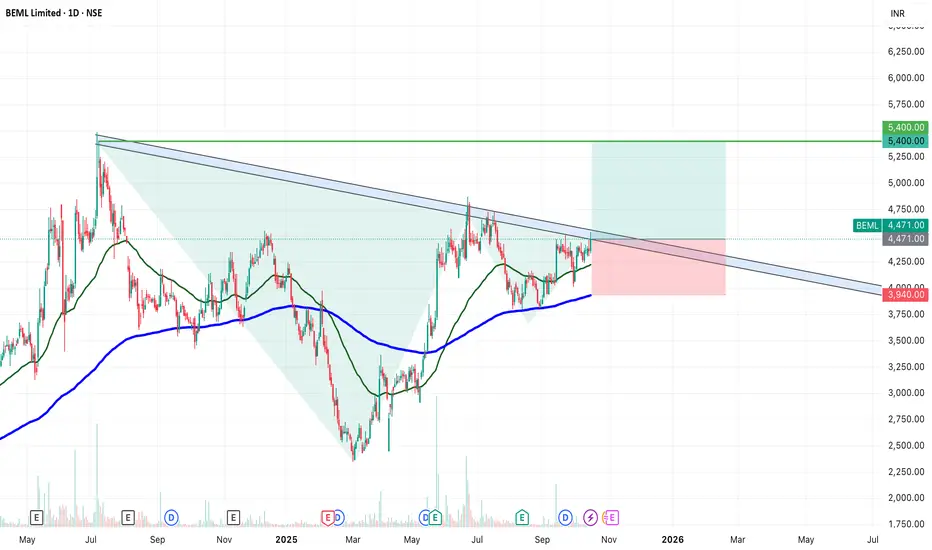
SWING IDEA - BEMLBEML Ltd , a key player in India’s defence and heavy equipment sector, is displaying a strong bullish breakout setup supported by multiple technical confirmations.
Reasons are listed below :
Breakout of a long-term trendline after multiple retests
Cup and Handle breakout, signaling continuation strength
VCP (Volatility Contraction Pattern) breakout indicating accumulation
Bullish engulfing candle on the daily timeframe confirming momentum
Higher highs and higher lows structure intact
Trading above 50 & 200 EMA, reinforcing trend strength
Target - 5400
Stoploss - daily close below 3940
DISCLAIMER -
Decisions to buy, sell, hold or trade in securities, commodities and other investments involve risk and are best made based on the advice of qualified financial professionals. Any trading in securities or other investments involves a risk of substantial losses. The practice of "Day Trading" involves particularly high risks and can cause you to lose substantial sums of money. Before undertaking any trading program, you should consult a qualified financial professional. Please consider carefully whether such trading is suitable for you in light of your financial condition and ability to bear financial risks. Under no circumstances shall we be liable for any loss or damage you or anyone else incurs as a result of any trading or investment activity that you or anyone else engages in based on any information or material you receive through TradingView or our services.
@visionary.growth.insights
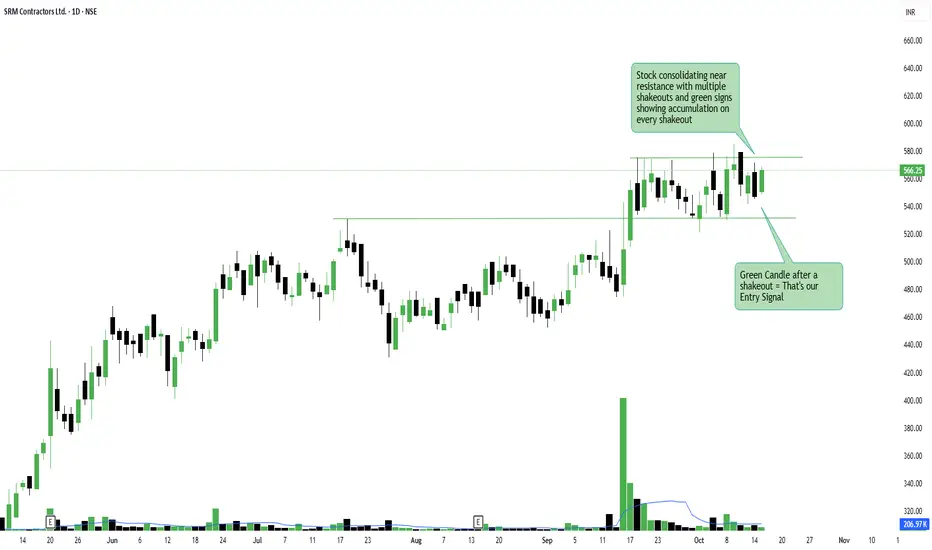
SRM Contractors Ltd – Shakeout-to-Breakout SetupSRM Contractors Ltd – Shakeout-to-Breakout Setup
NSE:SRM
📈 Pattern & Setup:
SRM Contractors is consolidating just below its key resistance around 570 after multiple shakeouts. Each shakeout has been followed by strong green candles and volume spikes — a clear indication of smart money quietly accumulating.
The recent green triangle right after a shakeout marks a potential entry signal, showing that buyers are absorbing every dip near support. The structure is forming a tight range between 540–570, and a breakout above 575 could trigger a new leg of rally continuation.
📝 Trade Plan:
✍Entry: Above 575 (breakout confirmation)
🚩Stop-Loss: 540 (below the latest shakeout low)
🎯Targets:
Target 1 → 610
Target 2 → 648 (13% potential move)
💡 Pyramiding Strategy:
1. Enter with 60% position above 575
2. Add 40% once the stock sustains above 590 with strong volume
3. Trail stop-loss to 555 once price crosses 600
🧠 Logic Behind Selecting this Trade:
This setup fits perfectly into the “shakeout-to-breakout” pattern — a reliable sign of institutional accumulation. Repeated rejections followed by higher lows are signs of pressure building near resistance. With volume steadily improving and market structure tightening, a clean breakout could be imminent.
Keep Learning. Keep Earning.
Let’s grow together 📚🎯
🔴Disclaimer:
This analysis is for educational purposes only. Not a buy/sell recommendation. Please do your own research or consult your financial advisor before trading.
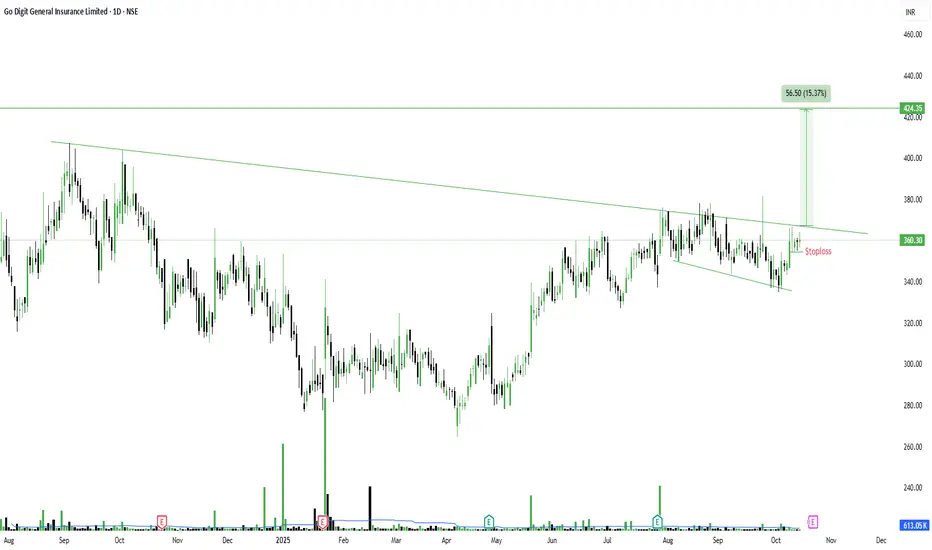
Go Digit - Descending Channel Breakout SetupGo Digit General Insurance Ltd – Descending Channel Breakout Setup
NSE:GODIGIT
📈 Pattern & Setup:
Go Digit is showing signs of a potential breakout from a long-term descending channel. After multiple shakeouts and pullbacks near the lower trendline, the stock has now reclaimed higher ground, moving closer to the upper boundary around 362–365.
The repeated pullbacks with strong recoveries highlight steady accumulation by smart money. Price compression within this narrowing channel is indicating that supply is drying up. A strong breakout above 368–370 with volume could confirm the start of a fresh rally toward 420+.
📝 Trade Plan:
✍Entry: Above 370 (breakout confirmation)
🚩Stop-Loss: 345 (below the recent higher low)
🎯Targets:
Target 1 → 395
Target 2 → 424 (15% potential move)
💡 Pyramiding Strategy:
1. Enter 60% above 370
2. Add remaining 40% once price sustains above 380 with heavy volume
3. Trail stop-loss to 355 once the price crosses 390
🧠 Logic Behind Selecting this Trade:
The price action structure suggests that sellers are gradually losing control while buyers are stepping in near support. The consistent pattern of pullbacks followed by rebounds shows quiet institutional activity. A confirmed breakout from the channel could trigger a sustained move as trapped sellers start covering.
Keep Learning. Keep Earning.
Let’s grow together 📚🎯
🔴Disclaimer:
This analysis is for educational purposes only. Not a buy/sell recommendation. Please do your own research or consult your financial advisor before trading.
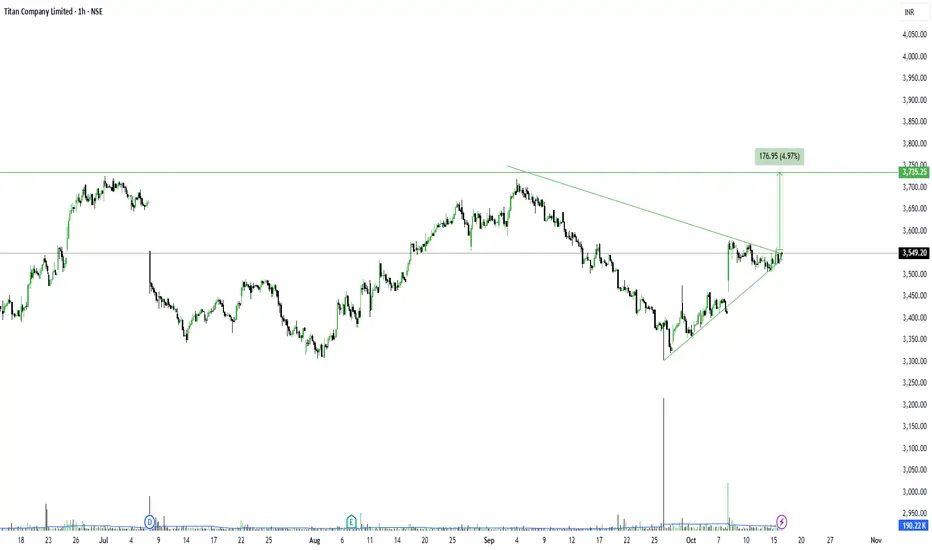
Titan – Symmetrical Triangle Breakout on the Hourly ChartTitan Company Ltd – Symmetrical Triangle Breakout on the Hourly Chart
NSE:TITAN
📈 Pattern & Setup:
Titan is forming a clean symmetrical triangle pattern on the hourly chart after a corrective phase. The price has started compressing within tighter highs and higher lows, indicating reduced volatility before a potential expansion.
Now, the stock is approaching the apex of the triangle near 3550 levels — a zone that often precedes a decisive breakout. A breakout above 3560–3570 could trigger a sharp rally, targeting previous swing highs around 3730+.
The structure suggests quiet accumulation with energy being stored for the next impulsive leg.
📝 Trade Plan:
✍Entry: Above 3570 (breakout confirmation)
🚩Stop-Loss: 3470 (below trendline support)
🎯Targets:
Target 1 → 3660
Target 2 → 3750 (5% potential move)
💡 Pyramiding Strategy:
1. Enter 60% position above 3570
2. Add 40% more above 3600 on volume expansion
3. Trail stop-loss to 3520 once price sustains above 3660
🧠 Logic Behind Selecting this Trade:
After a steady retracement from 3800+, Titan has found base support and is now compressing near breakout levels. The converging structure hints at a potential trend reversal on shorter timeframes, aligning with sectoral strength in consumer discretionary.
A breakout here could also mark a continuation of Titan’s long-term bullish trend from the weekly chart.
Keep Learning. Keep Earning.
Let’s grow together 📚🎯
🔴Disclaimer:
This analysis is for educational purposes only. Not a buy/sell recommendation. Please do your own research or consult your financial advisor before trading.
Swing trade opportunity in INOX WINDSwing trade opportunity in INOX WIND.
Entry - 150
Targets - 175 & 190
DISCLAIMER: I am not SEBI registered and the ideas posted are only for educational purpose. Always trade with proper STOP LOSS.

Bitcoin Bulls Eye Bounce, Though Bears Could Be Lurking AboveUsing correlations with Wall Street indices, I outline why I think Bitcoin could be in for a bounce - though its rally could be limited before new lows are seen.
Matt Simpson, Market Analyst at City Index and Forex.com

BORORENEWLooks good on Chart.
Breakout soon...
Above all key EMA.
Good for Short Term.
Target 840,1030.
Do Like ,Comment , Follow for regular Updates...
Keep Learning ,Keep Earning...
Disclaimer : This is not a Buy or Sell recommendation. I am not SEBI Registered. Please consult your financial advisor before making any investments . This is for Educational purpose only.

GBP/USD Looks Set To Extend Bounce From SupportGBP/USD looks set to extend its bounce on the daily chart, having found support at the monthly S1 pivot and 200-day EMA. The daily RSI (2) reached a heavily oversold level on Thursday ahead
of the bullish inside day at support.
A bull flag is also forming on the 4-hour chart. Given the strength of the rebound from support, the bias is for a break above the weekly pivot point and move to at least the October VPOC around 1.3440. Also note the weekly R1 pivot and monthly pivot just below 1.3500 just makes a viable target zone for bulls over the near term.
Matt Simpson, Market Analyst at City Index.

EURCHF: Bearish Rally Continues 🇪🇺🇨🇭
EURCHF may drop lower following a confirmed breakout
of a major horizontal support cluster.
The closest historic support is 0.9275.
With a high probability, it will be reached soon.
❤️Please, support my work with like, thank you!❤️
I am part of Trade Nation's Influencer program and receive a monthly fee for using their TradingView charts in my analysis.

New Setup: MUI have a swing trade setup signal for MU . I'm looking to enter long if the stock can manage to stay above my "BUY" line. If triggered, I will then place a stop-loss at the "SL" line. If it eventually reaches my "TP" line, I will sell half my position and utilize the 8-EMA as my trailing stop. This setup will remain valid for five trading days or until it closes below the "SL", whichever comes first.

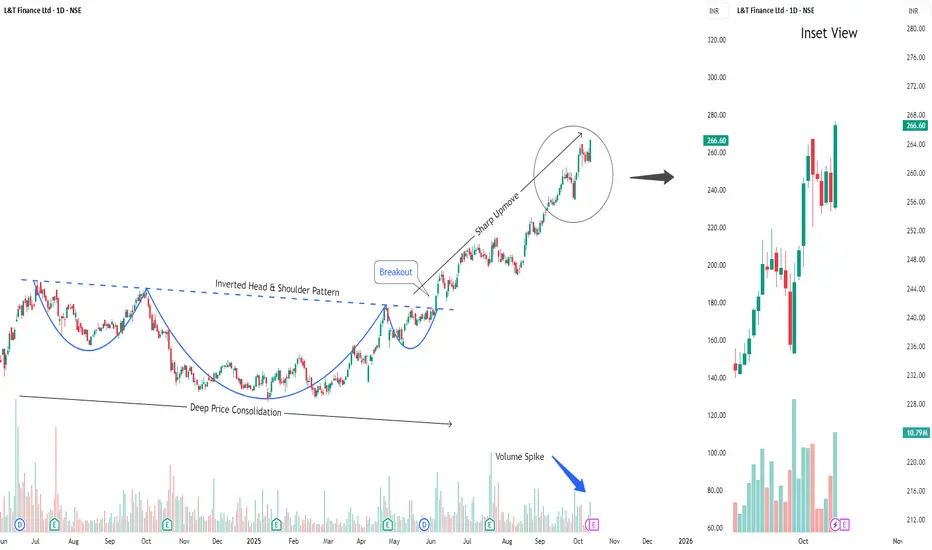
Buy L&T FinanceShort Term Trading Advice by Goodluck Capital
Buy L&T Finance
● Buy Range- 262 - 266
● Target- 280 - 285
● StopLoss- below 252
● Upside Potential- 6% -8%
● Approx trade duration 12 - 14 days